Electromyometrial Imaging of Uterine Contractions in Pregnant Women
Summary
We present a protocol for conducting electromyometrial imaging (EMMI), including the following procedures: multiple electromyography electrode sensor recordings from the body surface, magnetic resonance imaging, and uterine electrical signal reconstruction.
Abstract
During normal pregnancy, the uterine smooth muscle, the myometrium, begins to have weak, uncoordinated contractions at late gestation to help the cervix remodel. In labor, the myometrium has strong, coordinated contractions to deliver the fetus. Various methods have been developed to monitor uterine contraction patterns to predict labor onset. However, the current techniques have limited spatial coverage and specificity. We developed electromyometrial imaging (EMMI) to noninvasively map uterine electrical activity onto the three-dimensional uterine surface during contractions. The first step in EMMI is to use T1-weighted magnetic resonance imaging to acquire the subject-specific body-uterus geometry. Next, up to 192 pin-type electrodes placed on the body surface are used to collect electrical recordings from the myometrium. Finally, the EMMI data processing pipeline is performed to combine the body-uterus geometry with body surface electrical data to reconstruct and image uterine electrical activities on the uterine surface. EMMI can safely and noninvasively image, identify, and measure early activation regions and propagation patterns across the entire uterus in three dimensions.
Introduction
Clinically, uterine contractions are measured either by using an intrauterine pressure catheter or by performing tocodynamometry1. In the research setting, uterine contractions can be measured by electromyography (EMG), in which electrodes are placed on the abdominal surface to measure the bioelectrical signals generated by the myometrium2,3,4,5,6,7. One can use the magnitude, frequency, and propagation features of electrical bursts8,9,10,11,12 derived from EMG to predict the onset of labor in the preterm. However, in conventional EMG, the electrical activity of uterine contractions is measured from only a tiny region of the abdominal surface with a limited number of electrodes (two13 and four7,14,15,16 at the center of the abdominal surface, and 6417 at the lower abdominal surface). Furthermore, conventional EMG is limited in its ability to study the mechanisms of labor, as it reflects only the averaged electrical activities from the entire uterus and cannot detect the specific electrical initiation and activation patterns on the uterine surface during contractions.
A recent development called electromyometrial imaging (EMMI) has been introduced to overcome the shortcomings of conventional EMG. EMMI enables noninvasive imaging of the entire myometrium's electrical activation sequence during uterine contractions18,19,20,21. To acquire the body-uterus geometry, EMMI uses T1-weighted magnetic resonance imaging (MRI)22,23,24, which has been widely used for pregnant women during their second and third trimesters. Next, up to 192 pin-type electrodes placed on the body surface are used to collect electrical recordings from the myometrium. Finally, the EMMI data processing pipeline is performed to combine the body-uterus geometry with the electrical data to reconstruct and image electrical activities on the uterine surface21. EMMI can accurately locate the initiation of uterine contractions and image propagation patterns during uterine contractions in three dimensions. This article aims to present the EMMI procedures and demonstrate the representative results obtained from pregnant women.
Protocol
All methods described here have been approved by the Washington University Institutional Review Board.
1. MRI-safe marker patches, electrode patches, and rulers (Figure 1)
- Print the MRI and electrode patch templates (Figure 1A) on paper.
- Cut clear vinyl and silicone rubber sheets (Table of Materials) into 22 (vinyl) and 44 (rubber) rectangular (120 mm x 60 mm), and 4 (vinyl) and 8 (silicone rubber) square (60 mm x 60 mm) patches.
- Make MRI-safe marker patches: Overlay a template with a clear vinyl patch and glue MRI-safe markers (vitamin D liquid softgels) to the vinyl patch at the centers of the circles, which represent the electrode holder cavities on the template (Figure 1B).
- Make electrode patches: Label the circle locations on the silicone rubber patches and punch holes at those locations using a punch set with a diameter of 8 mm.
- Attach electrode holders over each hole with double-sided adhesive collars (Table of Materials). Align the circumference of the electrode holder cavity with the circumference of the hole punched on the silicone sheet.
- Install the X-ring into the cavity on top of the electrode holder, cover the holder with the color-coded silicone sheet, and insert the pin-type active electrode through the X-ring into the holder. The electrode is centered in the cavity of the electrode holder. The electrode cables should go between the two layers of silicone sheets and in the middle of the two rows of holders along the long edge. Adjust the length of the electrode cable by twining it around the electrode holder if needed.The assembly of an electrode patch is concluded (Figure 1C).
- Apply three strips of medical-grade double-sided tape to the electrode patch between the rows of electrodes along the long edge of the patch.
- Cut six measuring tapes at their 30 cm marks. Retain the top section from 0 cm to 30 cm. To make a horizontal ruler, glue the edges at 0 cm of two measuring tapes to a long piece of vinyl strip with a gap in the width of the tape. Apply double-sided adhesive tape to each ruler.
- Store the patches and rulers in a closed-lid storage box.
2. MRI scan
NOTE: The MRI scan is scheduled at a gestational age (GA) of 36-40 weeks, prior to the mother's expected delivery date, determined based on the subject's schedule and her nurse's recommendation. The estimated time duration for this step is 2 h.
- After the subject signs the consent form, ask the subject to change out of her street clothing into the MR-safe pants and gown provided by the MRI technician. Place MR-safe marker patches (Figure 1B) on the body surface in the exam room.
- Place patches on the back surface.
- Instruct the subject to sit on a medical exam bed. Peel the liner off the double-sided tape and apply a vertical ruler along the subject's spine, with the end of the ruler at the buttock cleavage.
- Place a horizontal ruler at the level of the iliac crest, with the center crossing over the vertical ruler. Peel the liner off the double-sided tape on the patches.
- Apply two rectangular patches on the back, so that the long edges of the patches are next to the vertical ruler and the corners of the patches are at the intersection of the rulers.
- Place additional patches to the left and right of the first two patches so that the patches are bilaterally symmetric. For average-sized subjects, apply four rectangular patches at each side (Figure 1E).
- Place patches on the abdominal surface.
- Raise the head of the exam bed to around 40° and guide the subject to lie down in Fowler's position. Place a vertical ruler along the midline of the abdomen, with the 3 cm mark near the fundus region determined by manual palpation.
- Apply a horizontal ruler so that its center is at the 6 cm mark of the vertical ruler and extends to the left and right lateral along the natural curvature of the abdomen.
- Place the first rectangular patch above the horizontal ruler and to the left of the vertical ruler, so that its long edge is parallel to the horizontal ruler and one corner of the patch is at the intersection of the two rulers.
- Place the second rectangular patch to the left of the first patch, with its long edge along the horizontal ruler. Place the third and fourth patches directly below the horizontal ruler and vertically aligned with the first and second patches.
- Place the fifth rectangular patch below the third patch, with its short edge along the vertical ruler. Place the sixth rectangular patch next to the fifth on the left side. Place the seventh patch below the fifth patch, with the short edge along the vertical ruler. Leave gaps of 2-3 cm between patches 3, 5, and 7 for the curvature of the abdomen.
- Place the two square patches (s1 and s2) below the sixth patch and seventh patch, vertically aligned with the sixth and seventh patch, respectively. Place patches on the right abdominal surface so they are bilaterally symmetric with those on the left (Figure 1F).
- Place patches on the back surface.
- Take photos and notes of the patch layout to record the positions of the rulers relative to each other and the subject's umbilicus.
- Have an MR technician screen the subject according to MRI safety rules and regulations at Zone II of the MRI facility. Then, guide the subject through Zone III to Zone IV, where a 3 T MR scanner resides.
- Guide the patient to lie down on the MRI bed in a supine position and provide her with an MR-safe microphone, a headphone set, and a signaling squeeze ball. Cover the subject's lower abdomen with a 32-array MRI coil (Figure 2A). Start the MR scanning.
NOTE: A radial volume interpolated breath-hold examination fast T1-weighted sequence was used to perform MRI on the entire abdomen using either a 3 T Siemens Prisma or Vida scanner. The resulting MR images had a resolution of 1.56 mm x 1.56 mm and a slice thickness of 4 mm.
- Guide the patient to lie down on the MRI bed in a supine position and provide her with an MR-safe microphone, a headphone set, and a signaling squeeze ball. Cover the subject's lower abdomen with a 32-array MRI coil (Figure 2A). Start the MR scanning.
- Use the localizer to adjust the field of view to cover the entire uterus and cervix. Then, perform an MRI scan with a T1-weighted sequence with the volume-interpolated breath-hold examination (repetition time [TR] = 4.07 ms, echo time [TE] = 1.78 ms, flip angle = 10°) and multiplanar reconstruction of the data set (field of view [FOV] = 500 mm x 500 mm, matrix = 320 x 320, voxel size = 1.56 x 1.56 x 4 mm3).
- Store the data in digital imaging and communications in medicine (DICOM) format.
- Remove the MRI patches and rulers from the subject and clean the abdomen and back with baby wipes.
- Remove the double-sided tape from the patches, disinfect the patches with germicidal disposable wipes, and apply new double-sided tape for the next experiment.
3. Bioelectricity mapping and 3D optical scan
NOTE: Conduct bioelectricity mapping after the subject has been admitted to the labor and delivery unit, and her cervix has dilated to around 4 cm. The estimated time duration for this step is 2 h.
- Prepare the electrode patches: Fill conductive gel into a curved tip irrigation syringe. Add the gel into the electrode holder cavities on each electrode patch using the syringe. Remove the liners of the double-sided tapes.
- Apply the electrode patches according to the same procedures as described in step 2.1, following the placement layout described in the photos and notes taken in step 2.2.
- Connect the power and data cords of the 3D optical scanner. Open the 3D scanning software (Table of Materials). Hold the handheld optical scanner (Table of Materials) upright, with the flashing cameras facing the subject.
- Press the Start button on the scanner to start the scanning, and press the Start button again to record the scanning. Move the scanner around the subject to take 3D optical scans to capture the electrode locations.
NOTE: Optical scans of the lower back surface are taken after placing electrode patches on the back surface. Optical scans of the abdominal surface are taken after placing electrode patches on the abdominal surface. - Press the Stop button on the scanner to finish the 3D scanning.
- Press the Start button on the scanner to start the scanning, and press the Start button again to record the scanning. Move the scanner around the subject to take 3D optical scans to capture the electrode locations.
- Take photos and notes of the patch layout. Note the positions of the rulers relative to each other and the subject's navel.
- Place four grounding electrodes, with the "LL" electrode on the lower left abdomen, the "LA" electrode on the left upper chest, the "RA" electrode on the right upper chest, and the "DRL" electrode on the abdominal surface near the umbilicus or the lower right abdomen.
- Connect the components of the bioelectricity mapping hardware, including the laptop, analog to digital (AD) box, battery box, electrode patch, grounding electrode cables, optical fiber, and USB2 receiver (Figure 1D).
- Open the software Active View on the laptop and turn on the AD box.
NOTE: If the status light is yellow on the AD box, the grounding electrodes have poor contact with the skin. In this case, remove the grounding electrodes, add more gel, and place them back in their locations. Repeat until the status light turns blue. - Check the Electrode offset module in Active View. If any electrodes have a large offset (over a quarter of the largest offset), improve their contact with the skin by securing them using medical paper tapes or by reinstalling (removing them, adding more gel, and placing them back in their locations).
- Click Start file > Paused to save the bioelectricity signal data streams in real time. After a 900 s recording, click Pause Save > Stop to finish the recording and store the multi-electrode measurement in a binary data file (BDF) file.
- Repeat step 3.9 four times after the research assistant has checked to ensure the subject is comfortable and willing to continue.
- After the last recording (usually four recordings in total), turn off the AD box and disconnect the electrode patches, grounding electrodes, optical fiber, and USB cable.
- Remove the electrode patches and grounding electrodes from the subject.
- Clean the subject's abdomen and lower back with a towel or baby wipes.
- Pack up all the equipment and store the electrode patches and grounding electrodes for cleaning.
- Clean the electrode patches and grounding electrodes in lukewarm water with dish soap in the cleaning room. Disinfect them with germicidal wipes.
- Air-dry the patches and apply double-sided mounting tape to the patches and rulers for the next experiment.
4. Generation of the body-uterus geometry
- Perform segmentation of the MRI data using a data analysis software application.
NOTE: Here, Amira software was used- Launch the data analysis software and load the MRI DICOM data. Go to the Segmentation module and click New to create a new label. Click Edit > Adjust the range to > Data histogram to change the image contrast.
- In Sagittal View, choose the Brush tool, label the uterus boundaries of the MR images, fill in the regions, and add to the label file. Repeat this step every three to five slices.
- Select the segmented regions and click Selection > Interpolate > + to interpolate the segmentation of all the slices. This completes the segmentation of the uterine surface.
- Click New to create a new label file. Choose the Magic wand tool, place the masking threshold at the initial local minimum of the data histogram, and adjust it gradually until the entire body is highlighted in blue.
- Choose All slices, click on any blue region, and then click + to add the segmentation into the label file. Click Segmentation > Fill holes > All slices > + to fix the holes.
- Go to the Segmentation module and click New to create a new label for the uterus. Manually segment the uterus on the MR images. Use Interpolate if needed.
- In the Project module, generate the surface data from the label files of the uterus and body surface.
- Choose a surface file, reduce the number of faces in Simplification Editor > Simplify by 50%, and click Simplify now. Choose the simplified surface file and right-click Smooth Surface (iteration = 20, lambda = 0.6) > Apply. Then, choose the smoothed surface file and right-click Remesh Surface (% 100) > Apply to re-mesh to each surface.
- Continue to perform step 4.1.7 until the body surface comprises approximately 18,000 faces and the uterine surface comprises roughly 640 faces.
- Click File > Export Data As > STL ascii to save the two surfaces in stereolithography (STL) format.
- Perform post-processing of the optical 3D scan data.
- Load the optical 3D scanning file of the abdominal surface into Artec studio 12 professional.
- Select the target optical scan and duplicate the scan.
- Click Autopilot to start processing the selected scan.
- In the Model creation module, choose the scan quality (geometry, texture), object size, hole-filling method (watertight), etc., and click Next.
- In the Editor module, choose Lasso selection and erase the redundant regions.
- Click Next to create an automatic refinement of the scan.
- Click Editor > Lasso selection to remove unnecessary regions.
- Click File > Export Meshes > STL File Format to save the surface in STL format.
- Align the optical 3D scan data to the MRI body surface and generate the body-uterus geometry with the tool command language (TCL) scripts in the data analysis software.
- Load the STL format surfaces generated from steps 4.1 and 4.2 with pre-programmed data analysis software project.
- Run the prompt TCL command line to prepare data analysis software objects for rigid alignment for the abdominal surface.
- Click Two Viewers (horizontal) and display the optical scan torso surface in the left viewer and the MRI body surface in the right viewer.
- Place five or six landmarks on both surfaces and run the prompt TCL command line to apply the rigid alignment.
- Repeat steps 4.3.2-4.3.4 for the back surface.
- Click Single Viewer and display the rigid-aligned optical-scanned body surface in the viewer.
- Run the prompt TCL command line to prepare data analysis software objects for non-rigid alignment.
- Click Project > Create Object > Landmarks and add landmarks at the electrode locations on the optical scanned body surface.
- Click File > Export Data As > LandmarkSet Ascii to export the landmark files for non-rigid alignment.
- Run the Geometry module in the EMMI data processing pipeline to perform a non-rigid alignment.
- Execute the TCL command line prompt to import the automatically aligned electrode landmarks and improve the precision of the electrode landmarks in reference to the notes and photos described in steps 2.3 and 3.3.
- Click File > Export Data As > LandmarkSet Ascii to export landmark files for the electrode locations.
- Run the EMMI data processing pipeline-geometry module to load the STL files and LandmarkSet files, and generate the body-uterus geometry in MAT format.
5. Electrical signal preprocessing
- Run the EMMI data processing pipeline-EMG preprocessing module to load the BDF file and process the raw electrical signal with a Butterworth filter with the frequency band 0.34-1 Hz.
- Run the EMMI data processing pipeline- artifacts detection module to automatically detect the local and global artifacts in the filtered signal.
6. Uterine electrical signal reconstruction and characterization
- Run the EMMI data processing pipeline-reconstruction module to load the body-uterus geometry and preprocessed electrical signal data and compute the electrical signals on the uterine surface.
- Run the EMMI data processing pipeline-EMG signal analysis module to automatically detect the onsets and offsets of each EMG burst on the uterine surface.
- Choose the observation window on the cluster figure overlay to compute the activation time at each uterine location for every observation window and create an isochrone for each observation window.
Representative Results
Representative MRI-safe patches and electrode patches are shown in Figure 1B,C, created from the template shown in Figure 1A. The bioelectricity mapping hardware is shown in Figure 1C, with the connections of each component marked in detail. Figure 2 shows the entire EMMI procedure, including an MRI scan of the subject wearing MRI patches (Figure 2A), 3D optical scanning (Figure 2B), bioelectricity mapping (Figure 2C), the generation of body-uterus geometry (Figure 2D), and a schematic of the EMMI data (Figure 2E).
Figure 3A shows a representative raw body surface electrogram with a sampling rate of 2,048 Hz. The raw signal is significantly affected by baseline drift, maternal electrocardiographic signal, maternal breathing, and other factors. In electrical signal preprocessing (section 5 in the protocol), a Butterworth bandpass filter with cutoff frequencies of 0.34-1 Hz and a downsample of a factor of 20 were applied to generate the filtered signal shown in Figure 3B. Three clear EMG bursts are marked with green lines in Figure 3B.
Figure 4A–F shows six successive uterine surface potential maps 0.2 s apart in anterior, left, posterior, and right views. The warm colors represent positive potentials and the cool colors represent negative potentials. The respective time of each uterine potential is labeled in the electrogram in Figure 4G, which is from the sites indicated with asterisks in Figure 4A–F. A region of high positive potential starts at the site marked with an asterisk (Figure 4A), enlarges (Figure 4B–E), and finally diminishes (Figure 4F). These EMMI-generated potential maps allow investigators to visualize the dynamic progression of uterine contractions in three dimensions.
Figure 5A shows an EMMI-generated isochrone map from four views. In the images, warm colors represent early activation, cool colors represent late activation, and dark blue represents no activation in the specific observation window. This isochrone map displays a uterine contraction sequence in which the uterine activation is initiated at the right fundus and propagated to the anterior and right. No activation occurred in the left posterior. Three representative uterine electrograms from sites a, b, and c are shown in Figure 5B. The red and blue lines mark the start and end times, respectively, of the isochrone map in Figure 5A. The EMG burst at site a occurred before those at sites b and c. These EMMI-generated isochrone maps allow investigators to visualize the uterine contraction sequence.
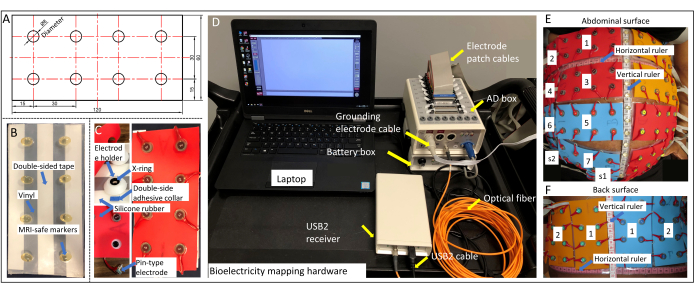
Figure 1: Design of the electrode patch. (A) Template for making MRI-safe marker patches and electrode patches, with measurements shown in millimeters. (B) MRI-safe marker patch. (C) Electrode holder, pin-type electrode, and electrode patch. (D) Bioelectricity mapping hardware with each component labeled. (E) Patch layout on the abdominal surface. (F) Patch layout on the back surface. Please click here to view a larger version of this figure.
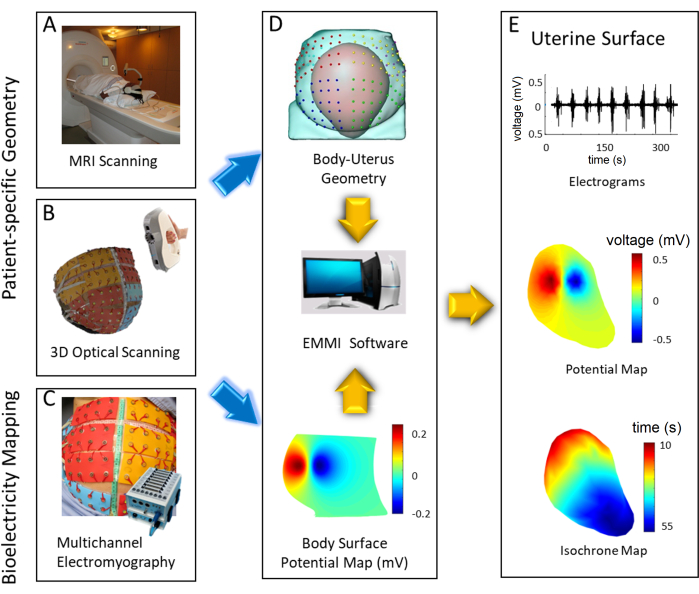
Figure 2: Flowchart of the EMMI system. (A) MRI scan of the lower body. (B) A 3D optical scan of the body surface with electrodes in place. (C) Bioelectricity mapping. (D) Body-uterus geometry and electrical signal preprocessing. (E) Uterine electrical signal reconstruction and characterization. Please click here to view a larger version of this figure.
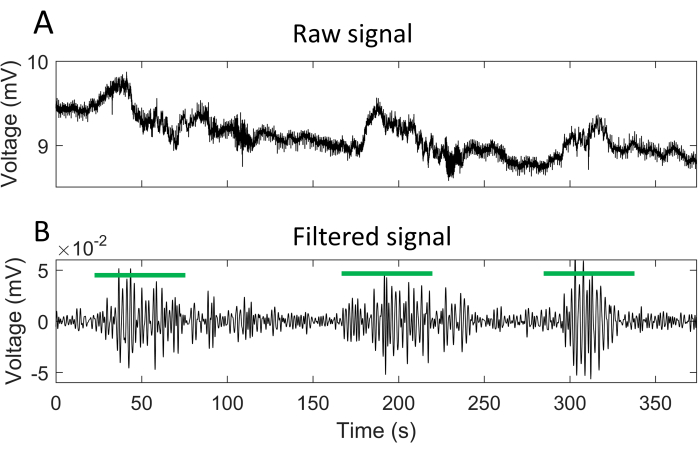
Figure 3: Representative body surface electrogram. (A) A 375 s raw signal recorded from a pin-type electrode on the body surface. (B) Signal from A after a Butterworth bandpass and downsampling. The green lines mark the times of EMG bursts. Please click here to view a larger version of this figure.
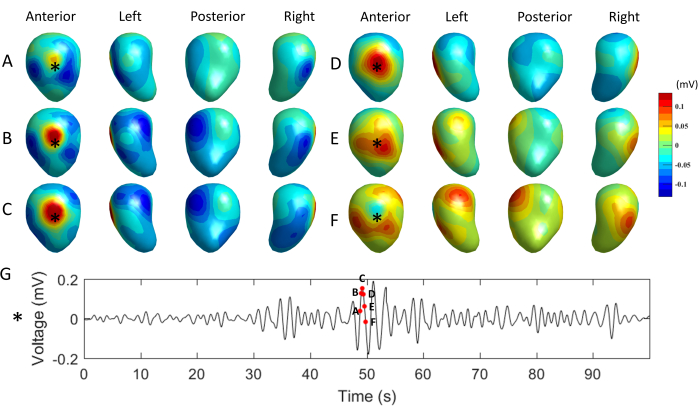
Figure 4: Representative uterine surface potential maps. (A–F) Potential maps shown in four views at times marked in the electrogram in G with red dots. The warm colors represent positive potentials and the cool colors represent negative potentials. (G) Electrogram at the site labeled with an asterisk in A-F. Please click here to view a larger version of this figure.
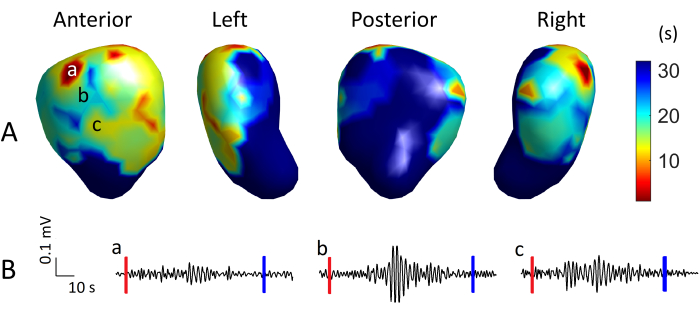
Figure 5: Representative uterine isochrone map and electrograms. (A) An isochrone map shown in four views, with warm colors representing early activation, cool colors representing late activation, and dark blue representing non-activation. (B) Uterine electrograms from sites a, b, and c. The red and blue vertical lines mark the start and end, respectively, of the observation window for this isochrone map. Please click here to view a larger version of this figure.
Discussion
Electromyography has indicated that the frequency and amplitude of uterine electrical signals alter during the gestational period2,16,25. Several studies have explored the uterine propagation patterns of uterine contractions in patients in active labor10,17,26,27,28. Still, no conclusive propagation direction has been reported, due to the limited number and coverage, as well as the non-standard configuration of the body surface electrodes. The absence of the predominant propagation direction may also be because of the non-fixed pacemaker in the myometrium16,29, but no convincing direct evidence has been reported. EMMI implements a full coverage of the electrodes on the body surface and applies an inverse computation to reconstruct the electrical activities on the uterine surface. EMMI makes it possible to characterize the electrical propagation of the uterine contraction on the whole uterine surface, displaying where the contractions initiate and how they propagate. In addition, with its high temporal resolution, EMMI can analyze the evolution of uterine contractions as the labor progresses with isochrone maps. A thorough analysis of uterine contractions would hold promise to provide new insights into human myometrium electrical maturation and improve the clinical management of human labor.
Preterm labor is a condition potentially caused by multiple pathologic processes, such as cervical diseases, infection, a decline in progesterone action, placental pathologies, abnormal uterine contraction, etc.30,31. By providing high temporal and spatial resolution electrical images of uterine contractions, EMMI holds great promise to improve the prediction accuracy of preterm labor/birth caused by abnormal uterine contractions.
There are several critical steps in performing EMMI in pregnant women. Firstly, the electrode patches must be placed in the same locations as the MRI-safe patches. Following the placement instructions (see the protocol) is critical to reducing electrode location errors. Secondly, it is crucial to use the appropriate amount of gel and establish adequate contact between electrodes and skin to ensure optimal electrical signal activity. Thirdly, multiple optical scans may be required to ensure the acquisition of high-quality body surface geometry.
We have two limitations in the current version of EMMI. One limitation is that MRI is expensive and not portable. Because it is challenging for women to undergo MRI after labor starts, MRI is conducted a few days before they are anticipated to go into labor. As for the preterm patients, whose anticipated labor date is more uncertain than that of term patients, we scheduled multiple MRI scans at 24, 28, 32, and 37 weeks (if the patient goes to term) to record the body-uterus geometry as close to the labor as possible. However, for clinical feasibility, a potential enhancement for EMMI is to utilize clinical ultrasound to obtain patient-specific body-uterus geometry at the bedside. This would decrease the overall expense of EMMI and allow real-time geometry measurement right before or during the electrical recording. The other limitation is the large number of electrodes, which increases the cost of the study and may makes it hard for daily clinical usage. Thus, on the one hand, we plan to make a validation test over the accuracy of EMMI with fewer electrodes. On the other hand, we plan to incorporate cheaper, wearable, disposable, printed electrodes that can be mounted on an elastic material32,33,34. Though several enhancements will be made in the future, the core protocol reported in this manuscript would not change. This work would make it possible for other research groups to reproduce our EMMI work.
Disclosures
The authors have nothing to disclose.
Acknowledgements
We thank Deborah Frank for editing this manuscript and Jessica Chubiz for organizing the project. Funding: This work was supported by the March of Dimes Center Grant (22-FY14-486), by grants from NIH/National Institute of Child Health and Human Development (R01HD094381 to PIs Wang/Cahill; R01HD104822 to PIs Wang/Schwartz/Cahill), by grants from Burroughs Wellcome Fund Preterm Birth Initiative (NGP10119 to PI Wang), and by grants from the Bill and Melinda Gates Foundation (INV-005417, INV-035476, and INV-037302 to PI Wang).
Materials
| 16 G Vinyl 54" Clear | Jo-Ann Stores | 1532449 | |
| 3 T Siemens Prisma | Siemens | N/A | MRI scanner |
| 3M double coated medical tape – transparent | MBK tape solutions | 1522 | Width – 0.5" |
| Active electrode holders with X -ring | Biosemi | N/A | 17 mm |
| Amira | Thermo Fisher Scientific | N/A | Data analysis software |
| Bella storage solution 28 Quart clear underbed storage tote | Mernards | 6455002 | |
| Extreme-temperature silicone rubber translucent | McMaster-Carr | 86465K71 | Thickness 1.32” |
| Gorilla super glue gel | Amazon | N/A | |
| LifeTime carbide punch and die set, 9 Pc. | Harbor Freight | 95547 | |
| Optical 3D scan | Artec 3D | Artec Eva Lite | |
| PDI super sani cloth germicidal wipes | McKesson medical supply company | Q55172 | Santi-cloth |
| Pin-type active electrodes | Biosemi | Pin-type | |
| REDUX electrolyte gel | Amazon | 67-05 | |
| Soft cloth measuring tape | Amazon | N/A | any brand can be used |
| Sterilite layer handle box | Walmart | 14228604 | Closed box |
| TD-22 Electrode collar 8 mm | Discount disposables | N/A | |
| Vida scanner | Siemens | N/A | MRI scanner |
| Vitamin E dl-Alpha 400 IU – 100 liquid softgels | Nature made | SU59FC52EE73DC3 |
References
- Hadar, E., Biron-Shental, T., Gavish, O., Raban, O., Yogev, Y. A comparison between electrical uterine monitor, tocodynamometer and intra uterine pressure catheter for uterine activity in labor. The Journal of Maternal-Fetal & Neonatal Medicine. 28 (12), 1367-1374 (2015).
- Schlembach, D., Maner, W. L., Garfield, R. E., Maul, H. Monitoring the progress of pregnancy and labor using electromyography. European Journal of Obstetrics, Gynecology, and Reproductive Biology. 144, S33-S39 (2009).
- Jacod, B. C., Graatsma, E. M., Van Hagen, E., Visser, G. H. A. A validation of electrohysterography for uterine activity monitoring during labour. The Journal of Maternal-Fetal & Neonatal Medicine. 23 (1), 17-22 (2009).
- Garfield, R. E., et al. Uterine Electromyography and light-induced fluorescence in the management of term and preterm labor. Journal of the Society for Gynecologic Investigation. 9 (5), 265-275 (2016).
- Devedeux, D., Marque, C., Mansour, S., Germain, G., Duchêne, J. Uterine electromyography: A critical review. American Journal of Obstetrics and Gynecology. 169 (6), 1636-1653 (1993).
- Jain, S., Saad, A. F., Basraon, S. S. Comparing uterine electromyography & tocodynamometer to intrauterine pressure catheter for monitoring labor. Journal of Woman’s Reproductive Health. 1 (3), 22-30 (2016).
- Lucovnik, M., et al. Use of uterine electromyography to diagnose term and preterm labor. Acta Obstetricia et Gynecologica Scandinavica. 90 (2), 150-157 (2011).
- Garcia-Casado, J., et al. Electrohysterography in the diagnosis of preterm birth: a review. Physiological Measurement. 39 (2), 02 (2018).
- Maner, W. L., Garfield, R. E. Identification of human term and preterm labor using artificial neural networks on uterine electromyography data. Annals of Biomedical Engineering. 35 (3), 465-473 (2007).
- Rabotti, C., Mischi, M. Propagation of electrical activity in uterine muscle during pregnancy: a review. Acta Physiologica. 213 (2), 406-416 (2015).
- Cohen, W. R. Clinical assessment of uterine contractions. International Journal of Gynaecology and Obstetrics. 139 (2), 137-142 (2017).
- Maner, W. L., Garfield, R. E., Maul, H., Olson, G., Saade, G. Predicting term and preterm delivery with transabdominal uterine electromyography. Obstetrics & Gynecology. 101 (6), 1254-1260 (2003).
- Leman, H., Marque, C., Gondry, J. Use of the electrohysterogram signal for characterization of contractions during pregnancy. IEEE Transactions on Biomedical Engineering. 46 (10), 1222-1229 (1999).
- Vasak, B., et al. Uterine electromyography for identification of first-stage labor arrest in term nulliparous women with spontaneous onset of labor. American Journal of Obstetrics and Gynecology. 209 (3), e1-e8 (2013).
- Euliano, T. Y., et al. Monitoring uterine activity during labor: a comparison of 3 methods. American Journal of Obstetrics and Gynecology. 208 (1), e1-e6 (2013).
- Garfield, R. E., Maner, W. L. Physiology and electrical activity of uterine contractions. Seminars in Cell & Developmental Biology. 18 (3), 289-295 (2007).
- Rabotti, C., Bijloo, R., Oei, G., Mischi, M. Vectorial analysis of the electrohysterogram for prediction of preterm delivery: a preliminary study. 2011 Annual International Conference of the IEEE Engineering in Medicine and Biology Society. IEEE. , 3880-3883 (2011).
- Wu, W., et al. Noninvasive high-resolution electromyometrial imaging of uterine contractions in a translational sheep model. Science Translational Medicine. 11 (483), (2019).
- Wang, H., et al. Accuracy of electromyometrial imaging of uterine contractions in clinical environment. Computers in Biology and Medicine. 116, 103543 (2020).
- Cahill, A. G., et al. Analysis of electrophysiological activation of the uterus during human labor contractions. JAMA Network Open. 5 (6), 2214707 (2022).
- Wang, H., et al. Noninvasive electromyometrial imaging of human uterine maturation during term labor. Nature Communications. 14 (1), 1198 (2023).
- Kok, R. D., de Vries, M. M., Heerschap, A., vanden Berg, P. P. Absence of harmful effects of magnetic resonance exposure at 1.5 T in utero during the third trimester of pregnancy: A follow-up study. Magnetic Resonance Imaging. 22 (6), 851-854 (2004).
- Choi, J. S., et al. A case series of 15 women inadvertently exposed to magnetic resonance imaging in the first trimester of pregnancy. Journal of Obstetrics and Gynaecology. 35 (8), 871-872 (2015).
- Ray, J. G., Vermeulen, M. J., Bharatha, A., Montanera, W. J., Park, A. L. Association between MRI exposure during pregnancy and fetal and childhood outcomes. JAMA. 316 (9), 952-961 (2016).
- Benedetti, M. G., Agostini, V., Knaflitz, M., Bonato, P. Applications of EMG in clinical and sports medicine. Intech Open. , 117-130 (2012).
- Lange, L., et al. Velocity and directionality of the electrohysterographic signal propagation. PloS One. 9 (1), e86775 (2014).
- Planes, J. G., Morucci, J. P., Grandjean, H., Favretto, R. External recording and processing of fast electrical activity of the uterus in human parturition. Medical & Biological Engineering & Computing. 22 (6), 585-591 (1984).
- Mikkelsen, E., Johansen, P., Fuglsang-Frederiksen, A., Uldbjerg, N. Electrohysterography of labor contractions: propagation velocity and direction. Acta Obstetricia et Gynecologica Scandinavica. 92 (9), 1070-1078 (2013).
- Young, R. C. The uterine pacemaker of labor. Best Practice & Research. Clinical Obstetrics & Gynaecology. 52, 68-87 (2018).
- Goldenberg, R. L. The management of preterm labor. Obstetrics and Gynecology. 100 (5), 1020-1037 (2002).
- Rubens, C. E., et al. Prevention of preterm birth: harnessing science to address the global epidemic. Science Translational Medicine. 6 (262), 5 (2014).
- Shi, H., et al. Screen-printed soft capacitive sensors for spatial mapping of both positive and negative pressures. Advanced Functional Materials. 29 (23), 1809116 (2019).
- Lo, L. W., et al. An inkjet-printed PEDOT:PSS-based stretchable conductor for wearable health monitoring device applications. ACS Applied Materials and Interfaces. 13 (18), 21693-21702 (2021).
- Lo, L. W., et al. Stretchable sponge electrodes for long-term and motion-artifact-tolerant recording of high-quality electrophysiologic signals. ACS Nano. 16 (8), 11792-11801 (2022).
