Here, we describe an advanced tool designed for chlorophyll biosynthesis monitoring during the early stages of Arabidopsis seedling de-etiolation. The novel methodology provides non-invasive real-time chlorophyll fluorescence imaging at high spatial and temporal resolution.
Chlorophyll biosynthesis is a hallmark of de-etiolation, one of the most dramatic stages in the plant life cycle. The tightly controlled and highly dynamic process of chlorophyll biosynthesis is triggered during the shift from the dark to the light in flowering plants. At the moment when etiolated seedlings are exposed to the first traces of sunlight, rapid (in order of seconds) conversion of protochlorophyllide into chlorophyllide is mediated by unique light-accepting protein complexes, leading via subsequent metabolic steps to the production of fully functional chlorophyll. Standard techniques for chlorophyll content analysis include pigment extraction from detached plant tissues, which does not apply to studying such fast processes. To investigate chlorophyll kinetics in vivo with high accuracy and spatiotemporal resolution in the first hours after light-induced de-etiolation, an instrument and protocol were developed. Here, we present a detailed procedure designed for statistically robust quantification of chlorophyll in the early stages of Arabidopsis de-etiolation.
De-etiolation represents the most dramatic phase in the plant life cycle, characterized by a number of morphological changes and complete rearrangement of plant metabolism (from hetero- to auto-tropic)1. Chlorophyll biosynthesis is a hallmark of light-induced de-etiolation in plants and a very dynamic process. Formation of chlorophyll from dark-produced precursor protochlorophyllide must be tightly coordinated to avoid damage due to reactive byproducts2. The protochlorophyllide reduction to chlorophyllide is catalyzed by light-dependent protochlorophyllide oxidoreductases (PORs), unique enzymes activated directly by light. The reaction is very fast, taking place in the order of ms to s3, leading to recognizable chlorophyll accumulation within minutes after etiolated seedling irradiation4,5,6. More time (from hours to days) is required for chloroplast biogenesis to establish a fully functional photosynthetic apparatus3.
Various methods exist to analyze chlorophyll content, including high-performance liquid chromatography (HPLC) or spectrophotometry. Usually, these techniques demand the destruction of plant tissue4,5,6, restricting the determination of changes in chlorophyll levels over time. Methods allowing non-invasive chlorophyll kinetics establishment may open a whole new perspective to study plants in diverse aspects ranging from fundamental research questions, such as analyzing the process of chlorophyll synthesis in time and space, to more practical applications, such as assessment of stress tolerance or effect of biostimulants on the chlorophyll kinetics. Considering this, we introduced a system for monitoring chlorophyll formation, iReenCAM7. It incorporates a CCD camera, emission filters, light sources, and a pipeline for automated fluorescence analysis (Figure 1). The main feature of the developed device is high spatial and temporal resolution, outperforming in the parameters used in current approaches, and sufficient sensitivity and specificity when compared with standard analytical methods7.
The non-invasive procedure described here requires minimum reagents and comprises simple steps, allowing to obtain a chlorophyll kinetics profile in living Arabidopsis seedlings during very early stages of de-etiolation. The protocol can be useful for the study of highly dynamic process of chlorophyl synthesis influenced by number of factors, both exogenous (salt, drought, biostimulants, heavy metals, etc.) and endogenous (typically associated with changes in the gene activity) in origin without a need to detach any plant tissue, thus avoiding additional stress.
1. Medium preparation
2. Seed surface sterilization and plant growth conditions
3. Chlorophyll fluorescence measurement and analysis
4. Data extraction and analysis
The typical output obtained using the newly developed procedure in the 4-day-old de-etiolated Arabidopsis seedlings of wild-type (WT), ecotype Columbia-0 (Col-0) is shown in Figure 3. Under control conditions (DMSO-supplemented MS media), the chlorophyll biosynthetic curve starts with an initial burst of the chlorophyll synthesis, in which the protochlorphyllide pool synthesized during the scotomorphogenic phase of the growth, is quickly converted to chlorophyll owing to the light-induced PORs7,8,9. The initial phase of fast chlorophyll accumulation takes approximately 10 min and is followed by a lag phase, during which the minima of the dark-synthesized protochlorophyllide are reached (approximately 30 min after irradiation; for the HPLC-measured protochlorophyllide curve, see7). During the lag phase, the chlorophyll biosynthetic genes are upregulated10, leading to light-induced production of protochlorophyllide. The newly synthesized protochlorophyllide is promptly converted to chlorophyll, detectable as exponential phase (in case of WT Col-0 starting at approximately 120 min after irradiation), finishing with another lag phase at approximately 4 h after the de-etiolated seedling irradiation (Figure 3). In the presence of 6-benzylaminopurine (BAP), the first significant differences are detectable during the exponential phase7, suggesting negative effect of BAP on the chlorophyll kinetics in later stages of chlorophyll biosynthesis (at about 2 h after the start of illumination with actinic light; Figure 3).
For comparison of different conditions and/or genotypes, normalization of the raw data is necessary. As no chlorophyll was detectable using HPLC under various conditions and/or different genotypes in etiolated seedlings, we performed the normalization (F/F0) to the T0 fluorescence levels (F0) measured for the corresponding treatment and/or genotype7. To demonstrate the importance of normalization, we present both raw data and the data normalized to the mean chlorophyll fluorescence value of control measured at T0 (F0; Figure 3A and Figure 3B, respectively).
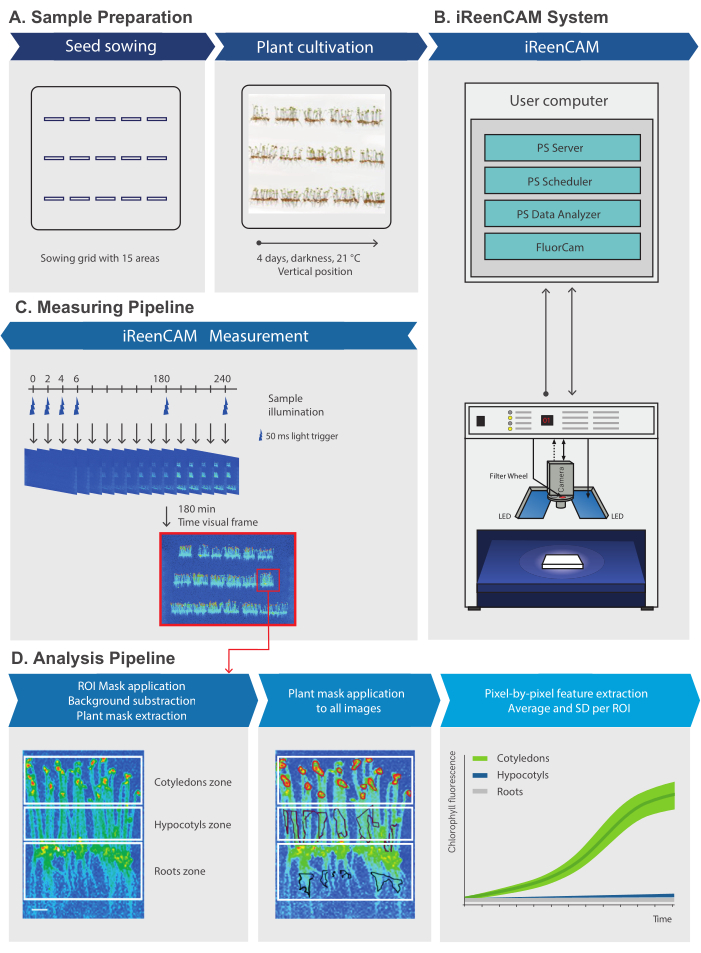
Figure 1: Measuring device protocol overview. The scheme of iReenCAM measurement and analysis pipeline. (A) Sample preparation by grid-defined seed sowing, stratification, light induction of germination and vertically oriented Petri plate cultivation in darkness. (B) Control module for automatic and programmable image acquisition and data management based on PlantScreen phenotyping SW toolbox organizes the operation of the entire system by controlling and synchronizing the HW operation with user defined measurement and analysis protocol. (C) The measuring protocol is designed for dynamic measurements of the fluorescent sample images in 2 min intervals for 4 h in total, i.e., 120 measuring rounds. Time visual frame of representative false-color image of vertically oriented 4-day-old Arabidopsis seedlings acquired at time 180 min is used for ROI mask generation. (D) Mask defining ROI for a tissue of interest (e.g., cotyledon, hypocotyl, or root zone) is applied on the time visual frame, background subtraction is performed and pixel by pixel fluorescence values for each ROI (defined by the plant mask) from all measurement rounds is extracted. Finally, the raw data (fluorescence F) is normalized to the mean fluorescence value at T0 (F0). Scale bars = 1 cm (A) and 0.25 cm (C). The figure was modified from7. Please click here to view a larger version of this figure.
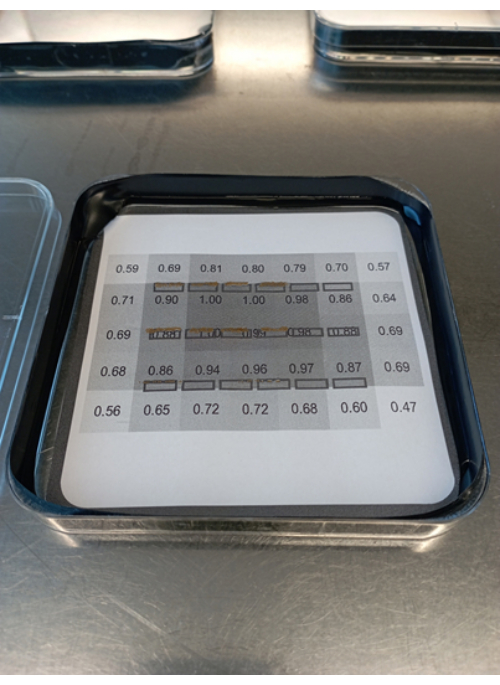
Figure 2: Seed placement. The figure shows placing Arabidopsis seeds on the Petri plate with light-tight edges using the sawing grid. Please click here to view a larger version of this figure.
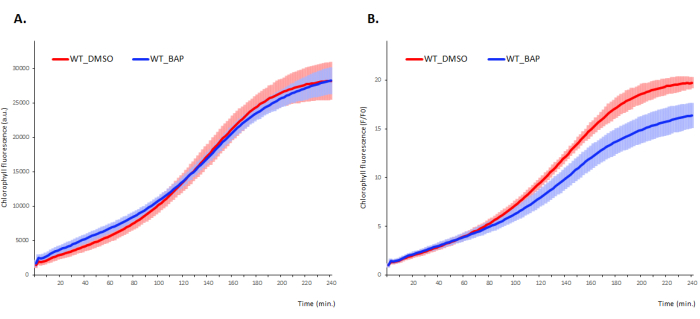
Figure 3: Chlorophyll accumulation kinetics in the early stages of Arabidopsis de-etiolation. Etiolated WT Col-0 seedlings were grown on media supplemented with BAP or DMSO (mock). (A) The mean value ± SD (shaded area), n=9 of raw data and (B) data normalized to the mean fluorescence value at T0 (F0). Please click here to view a larger version of this figure.
Supplementary Figure 1: Sowing grid. Left: Sowing grid with outlined rectangular boxes for placing the seeds of each genotype into a measuring spot located in the area of actinic light homogeneity (light intensity ≥ 0.7 of the maximum light intensity). Right: Schematic representation of 4 days old, etiolated Arabidopsis seedlings grown for the analysis. The sowing grid provides a possible scheme for Arabidopsis seeds positioning ensuring light homogeneity and proper seed density (each slot can be used for seed placement as the size of a slot, distance between the slots and the light homogeneity in the area of the grid are unified). Please click here to download this File.
Supplementary Figure 2: Fluorescence measuring protocol. Please click here to download this File.
Supplementary Figure 3: Experimental configuration allowing to avoid unwanted light exposure.(A) The measuring device is placed in the walk-in phytotron, (B) to the chamber separated by light-tight door. (C) The in vitro cultivation boxes (red arrowhead) dedicated for the etiolated seedlings growth under defined conditions (temperature and relative humidity) are placed just beneath the device (yellow arrowhead), ensuring the minimal risk of light exposure. The source of green dim light (blue arrowhead) is mounted on the wall next to the control PC (orange arrowhead). Please click here to download this File.
Supplementary Figure 4: Mask generation procedure in the workflow using PS data analyzer software. Print screenshots of individual steps to be performed for the tray mask (steps 4.3-4.6) and plant mask (step 4.12) generation and data analysis (steps 4.7 and 4.13). Please click here to download this File.
Supplementary Figure 5: Sowing density affecting measurement variability. Chlorophyll accumulation kinetics in 4-days-old, etiolated Arabidopsis WT Col-0 seedlings grown (A) separately (as individual seedlings, here n=5) or in a group of (B) high (HD, n=30-40) or (C) low density (LD, n=10-15). The n corresponds to the number of seedlings per slot of the sowing grid, data represent the mean values ± SD (shaded region). The high or low density corresponds to the number of seedlings per slot of the sowing grid as mentioned. Please click here to download this File.
Supplementary Figure 6: Cultivation interval and space requires species-specific optimization. Growth of various plant species using the Arabidopsis-optimized protocol. (A) Seeds placement on the sowing grid. (B) 4-day-old, etiolated seedlings of (from the left to the right) Arabidopsis thaliana, Brassica napus, and Crambe abyssinica. Please click here to download this File.
Critical steps of the protocol and troubleshooting – no light and take care of the mask
As highlighted directly in the protocol description above, avoiding even the trace amounts of light both during cultivation of etiolated plants seedlings or just before starting the protocol is of critical importance11. In our setup, we use a dedicated dark chamber located in the walk-in phytotron and separated from the rest of the phytotron with light-tight rotating door (Supplementary Figure 3). The chamber is equipped with plant cultivation space and workbench allowing to accommodate the device together with control PC and fume hood. This allows us both to grow the plants in darkness and start the measurement without the need for plate transportation.
The way of plant cultivation and mask generation is critical for subsequent quantification of chlorophyll fluorescence signal via the assay proposed. One should avoid getting clumps of gelling agent or small visual trash/dust in the media as it might cause light reflection. As the recognition of chlorophyll fluorescence by the software is limited by the mask, a plant area that will not be covered by the mask will simply not be analyzed by the software. During the 4 h measurement, seedlings grow/move a bit, therefore designated mask could require adjustments as it may not fit through all the measurement rounds for the accurate signal intensity quantification. According to our experience, the imperfect mask definition seems to be the main source of variability. During the optimization experiments, we monitored the changes in the variability of chlorophyll fluorescence values taken for analysis in i) individual seedlings and a group of seedlings with ii) higher (30-40 seeds) and iii) lower (10-15 seeds) density sowing (Supplementary Figure 5). We used a higher density of seed sowing since it showed the lowest variability. The higher variability seen in case of individual seedlings/lower density sowing originates mostly from the higher proportion of pixels located at the edge between the signal and the background and the slight movement of the seedlings during the 4 h measurement interval.
To ensure that all measurements are accurate, check if the plant mask fits the first round, then to the 15th, 30th, 45th, 60th 75th and so on till the last one (by picking the number of the round and clicking Refresh Preview). This will take only a couple of minutes but will ensure that the whole cotyledon area is being covered and evaluated. If at any round the plant mask does not fit (the required area is not fully covered), divide the experiment into several parts. Then perform the protocol starting from Step 4 (4.1-4.13) to create a specific mask separately for each part of the experiment. For example, if you notice the displacement of the plant mask at the round 60-61 (or slightly earlier), divide the experiment into two parts – 1st part (1-60 rounds) and 2nd part (61-121 rounds). For the 1st part use the image of round 41 to generate a plant mask and for the 2nd part use round 91. At Step 4.13, when analyzing the data, be careful to choose the rounds according to the corresponding part of the experiment (e.g., rounds 1-60 for the first part and 61-121 for the second one, as in the aforementioned example) before clicking Analyze. When working with Arabidopsis, the movement of plants is negligible as they grow rather slowly but if applying the protocol for different species (see below), the growth pace should be taken into account.
Modifications and limitations
The number of parameters can be modified, including the intensity and wavelength of the actinic light and/or the light being applied between the intervals of actinic light application. The measuring device includes the integrated, fully motorized, and software-controlled filter wheel. Thus, the measuring algorithm suitable for the quantification of other pigments, typically also products of the tetrapyrolle biosynthetic pathway10,12, might be included in the protocol in case of adding the appropriate filters.
Also, as it was mentioned earlier, the protocol can be used not only for Arabidopsis plants. However, when working with other plant species, each step of the protocol should be revised accordingly taking into consideration the species-specific features including the germination and growth rate and/or the size (Supplementary Figure 6).
One of the important limitations of the protocol is the timespan, during which the chlorophyll quantification analysis can be performed. After chlorophyll becomes integrated into the photosystem complexes, the fluorescence signal becomes biased by the photosynthesis energy consumption (what is called the variable chlorophyll florescence is present) as has been observed during later stages of de-etiolation13. As assayed using OJIP transients assay14,15, no signs of photosynthetic activity was detectable using this experimental setup during the first 4 h of de-etiolation7. However, if the extended time period of photomorphogenesis is supposed/necessary to be assayed, the level of photosystems assembly and possible effect of photosynthesis on the overall fluorescence levels should be tested.
Finally, it should be mentioned that our protocol based on the fluorescence measurements, allows relative, not absolute chlorophyll quantification. If absolute quantification is needed, corresponding calibration must be performed using an alternative, e.g. HPLC approach.
Significance with respect to existing methods – simple, fast, and statistically robust chlorophyll quantification with high time and spatial resolution
The procedure described here allows the real-time detection and quantification of chlorophyll in living Arabidopsis seedlings during early stages of de-etiolation. Compared to other approaches mostly relying on chlorophyll extraction from detached plant material16,17 or recently developed optical methods18,19 this approach is purely non-invasive, allowing chlorophyll quantification by in vivo measurement of fluorescence intensity. Also, there is no need for additional reagents necessary for sample preparation as with other existing alternative methods including the aforementioned HPLC- or spectrophotometry-based approaches. The newly introduced protocol is simple, fast, and accurate, as previously verified using HPLC5. Using the standard protocol settings, the final curve of a single biological repeat is made out of 120 measuring points (fluorescence intensity means) taken during 4 h of the measurement, each consisting of up to 15 measuring spots. Typically, the final curve includes the data of three biological replicas (e.g., three independently prepared plates), and three measuring spots (three technical replicas), each consisting of 30-40 seedlings. Thus, there are around 300 seedlings assayed in each time interval, providing statistically robust dataset, allowing to reliably detect even small differences as demonstrated on mutants affected in various steps of chlorophyll biosynthesis7. Here we encourage the user to employ the recently developed statistical approach based on generalized linear mixed models combined with classical time series models as a suitable tool for the chlorophyll kinetics data analysis20.
Future applications of the technique – fast and cheap screening
The aforementioned features make this approach a useful tool suitable for fast and cheap screening and highly precise quantification of traits associated (directly or indirectly) with chlorophyll biosynthesis. This might include studies employing the forward genetic screening to better characterize the complex and multi-level regulations of chlorophyll biosynthesis10,12,21. Considering the possibility of various compound treatment, the protocol is also highly valuable to study, for example, the importance of light-mediated hormonal regulations22,23 or screening for low-molecular compounds with possible impact on chlorophyll accumulation kinetics.
The authors have nothing to disclose.
This work was supported from the European Regional Development Fund-Project SINGING PLANT (No. CZ.02.1.01/0.0/0.0/16_026/0008446). This project has received funding through the MSCA4Ukraine project (ID 1233580), which is funded by the European Union. We are grateful to Lenka Sochurkova for the graphical design of Figure 1.
6-benzylaminopurine | Duchefa Biochemie | B0904.0001 | |
Aluminum foil | Merck | Z691577 | |
Arabidopsis thaliana Col-0 seeds | NASC collection | N1092 | |
Cultivation chamber | PSI | custom made | |
Dimethilsulfoxid | Thermo Fisher Scientific | 042780.AK | |
Eppendorf single-channeled, variable (100-1000 μL) | Merck | EP3123000063 | |
Gelrite | Duchefa Biochemie | G1101 | |
iReenCAM device | PSI | custom made/prototype | |
Laboratory bottles, with caps (Duran), 100mL | Merck | Z305170-10EA | |
Laminar-flow box | UniGreenScheme | ITEM-31156 | |
Linerless Rubber Splicing Tape, 19 mm width, black, Scotch | 3M Science. Applied to Life | 7000006085 | |
Microcentrifuge tube, 2 mL with lid, PPT, BRAND | Merck | BR780546-500EA | |
Micropore tape | 3M Science. Applied to Life | 7100225115 | |
Osram lumilux green l18w/66 | Ovalamp | 200008833 | |
Petri plates – Greiner dishes, square, 120 x 120 x17mm, vented | Merck | Z617679-240EA | |
Pipet tips, 1000 μL, Axygen | Merck | AXYT1000B | |
The Plant Screen Data Analyzer software | PSI | delivered as a part of the iReenCAM |