1. Preparation of Resting Human T Lymphocytes
- Using RosetteSep Human T Cell Enrichment Cocktail and RosetteSep Density Medium, purify T cells from human blood samples according to the manufacturer’s instructions. The resulting cell population should contain 95% CD3+ resting T cells. We purify human T lymphocytes from peripheral blood samples collected from healthy volunteers in accordance with the protocol approved by the UC Davis Internal Review Board.
- After isolation, resuspend resting T cells at a density of 0.5 x 10⁶ cells/ mL in cell culture medium containing RPMI-1640 medium with glutamine and HEPES, supplemented with 10% fetal calf serum, 2% GlutaMAX-I, 1% RPMI 1640 vitamin solution, 1% RPMI 1640 amino acids solution, 1% sodium pyruvate, and 0.03% β-mercaptoethanol.
- Place cell suspension into cell culture flasks and maintain at 37°C in a humidified incubator with 5% CO2 for up to 24 h prior to the experiment.
2. Preparation of the Recording Chamber
- The following are needed to prepare recording chambers: a) silicon O-rings, b) round, 25-mm coverslips cleaned with 70% ethanol and distilled H2O, c) mixed Sylgard184, prepared according to the manufacturer’s instructions, and d) two 60 x 15 mm Petri dishes.
- Place ~0.5 mL of mixed Sylgard184 into a 60×15-mm Petri dish.
- Dip the bottom part of the O-ring into the Sylgard184 using forceps.
- Remove excess Sylgard184 from the rim of the O-ring by placing the O-ring on a clean surface, such as another Petri dish.
- Place the ring onto the coverslip and press it down.
- Cure the Sylgard184 by heating the chambers at 85° C for 40-60 min or until the Sylgard184 is polymerized.
- Store the recording chambers in a dust-free container.
3. Preparation of Patch Pipettes
- On the day of the experiment, pull pipettes with a ~2-μm tip diameter using glass capillaries and a pipette puller. We use borosilicate tubing with filament (O.D.: 1.5 mm and I.D.: 1.10 mm). Store pipettes in a dust-free location.
- Coat pipette tips with Sylgard184 or HIPEC R6101 Semiconductor Protective Coating, according to a standard procedure 9.
- Gently fire-polish the pipettes before the experiment.
4. Patch Clamp Setup Preparation
- Configure and save the macros for gigaseal formation in the software controlling your patch-clamp amplifier. We use an EPC-10 amplifier supported by Windows XP and Pulse software for the data acquisition. We set the “set-up”, “on-cell”, and “whole-cell” macros according to the EPC-10 manual and use them for all experiments.
- Prepare bath solutions and pipette solutions listed in Table 1 prior to the experiment and store them at 4° C for up to 1 week.
| Chemicals | Bath Solutions (mM) | Pipette Solutions (mM) | ||
| # 1 | # 2 | # 3 | ||
| CH3SO3Na | 130 | 110 | 125 | – |
| NaCl | 2 | 4 | 5 | – |
| Ca(OH)2 | – | 20 | – | – |
| MgCl2 | 3 | 1 | – | 5 |
| MgSO4 | – | – | – | 2 |
| HEPES | 10 | 10 | 10 | 15 |
| HEDTA | – | 10 | – | |
| EDTA | – | – | 1 | – |
| Cs-aspartate | – | – | – | 125 |
| BAPTA | – | – | – | 12 |
| Glucose | 10 | 10 | 10 | – |
Table 1. Solutions for whole-cell CARC current recordings.
All chemicals were purchased from Sigma-Aldrich, St. Louis, MO.
- Determine liquid junction potentials (LJ) between the patch pipette solution and each bath solution 10. Save the LJ value in the appropriate place using your acquisition software. For example, in the Pulse program insert the LJ value into “LJ” control in the “Amplifier” window.
- Configure and save the stimulation protocols, as shown in Figure 1, in the appropriate place of your acquisition software before the experiments. In the Pulse program, we set the acquisition protocol in the “Pulse Generation” window.
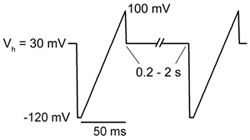
Figure 1. Stimulation protocol. Voltage ramp from -120 to +100 mV of 50 ms in duration is applied every 0.2 – 2 s (5 – 0.5 Hz). Holding potential (Vh) between ramps is maintained at +30 mV.
5. Mounting Cells on the Microscope Stage
- Coat the recording chambers with poly-L-lysine for ~20 min and wash with H2O and then with Hank’s balanced salt solution (HBSS) before plating the cells.
- Plate 500 μL of cell suspension containing 0.2-0.5 x10⁶ cells into the chamber and incubate for 20 min at 37° C.
- Secure the recording chamber with the attached cells in a chamber holder. We use a custom-made chamber holder, where the base supports the bottom of the coverslip, while the top part gently presses against the top of the coverslip.
- Place the chamber holder on the stage of the inverted microscope.
- Focus on the cells in transmitted light. We use a 40X oil immersion objective.
- Place the Ag/AgCl reference electrode into the bath.
- Align the multibarrel, gravity-driven perfusion system. The tip of the inflow tube should be placed at a 45° angle to the coverslip close to the field of view.
- Position the suction tube opposite to the tip of the inflow tube.
- Perfuse the chamber with phosphate-buffered saline (PBS) or HBSS to wash away the cell culture media and loosely attached cells.
6. CRAC Channel Currents Recording
- Find a cell that is firmly attached to the coverslip. We typically select an average-sized, round cell with a smooth outer surface.
- Perfuse the recording chamber with Ca2+-free, 3 mM Mg2+-containing bath solution #1 (Table 1) containing 0.5-1 μM thapsigargin for 8-10 min to block the SERCA pump. We perform this step to deplete the store prior to gigaseal formation.
- Using an Eppendorf microloader and a P-20 displacement pipette, fill the patch pipette with the pipette solution (Table 1) and insert the patch pipette into the pipette holder on the amplifier headstage. The Ca2+ chelator BAPTA is included in the pipette solution to passively deplete the store and to reduce Ca2+-dependent CRAC channel inactivation.
- Apply a small amount of positive pressure (~3 inches of H2O) inside the patch pipette before entering the bath. We use a custom-made pressure-suction device connected to pressurized air and vacuum lines to create positive or negative pressure inside a patch pipette.
- Lower the patch pipette into the bath under visual control via the microscope. In the “Oscilloscope” window, you should see a current flowing through the pipette. A step-like change in the current amplitude should be induced by a small amplitude voltage pulse (test pulse) applied by the preset macro. At this time, you should be able to determine the value of pipette resistance. The resistance of our pipettes is typically 5-6 MΩ.
- Correct the “offset” potential generated between the pipette and the reference electrode.
- Under visual control via the microscope, bring the pipette tip closer to the cell until it touches the cell membrane.
- Apply negative pressure (20-40 inches of H2O) inside the patch pipette.
- Monitor the gigaseal formation in the “oscilloscope” window. You will see the amplitude of the current, induced by the test pulse, decreases and the value of pipette resistance increases to >5 GΩ. Usually gigaseal forms within a few seconds, but it may take 1-2 min to achieve a stable gigaseal.
- Compensate for the pipette capacitance (“C-Fast”).
- Break the patch membrane by applying additional negative pressure using a 20 cc syringe.
- Set the holding potential to +30 mV. A positive holding potential helps to prevent calcium-dependent CRAC channel inactivation.
- Compensate for the membrane capacitance of the cell (“C-slow”); save or record the value of C-slow.
- Check the value of the access resistance “Rs“. In our experiments, the Rs is typically 7-20 MΩ.
- Start to apply a series of voltage ramps with a frequency of 0.5 Hz (Figure 1) in Ca2+-free 3 mM Mg2+-containing bath solution #1. In this solution, CRAC current is negligibly small as compared with the “leak” current due to the poor permeability of CRAC channels for Mg2+. Save and use the current traces recorded in bath solution #1 in future analyses as “leak” currents. The absolute amplitude of the “leak” current at -100 mV should be less than or equal to 5 pA. If the cell is “leaky”, stop the experiment and start over using a new patch pipette and a new cell.
- To record Ca2+ current via CRAC channels (ICa-CRAC), replace Ca2+-free 3 mM Mg2+-containing bath solution #1 with 20 mM Ca2+-containing bath solution #2 (Table 1) by switching the perfusion valves. This allows for Ca2+ to flow via CRAC channels and produce an inward current. In the “Oscilloscope” window, you will see development of inwardly rectifying ICa-CRAC (Figure 2). The current amplitude at negative voltages will continue to increase for about 1 min due to the Ca2+-dependent potentiation of the CRAC current.
- Increase the frequency of stimulation with voltage ramps to 5 Hz, which is necessary to record the transient Na+ current via CRAC channels.
- Replace the 20 mM Ca2+-containing bath solution #2 with Na+-containing divalent cation-free solution #3 (Table 1) by switching the perfusion valves. In the “Oscilloscope” window, you will see a transient development of larger amplitude inwardly rectifying Na+ current via the CRAC channels (INa-CRAC; Figure 2).
- One may apply 20 mM Ca2+-containing bath solution #2 containing 1-5 μM La3+ at the end of the experiment to record the “leak” current. However, we did not find this approach useful because the “leak” current changes over time and it may become larger or smaller at the end of the experiment. We prefer to take the current recorded in the Ca2+-free 3 mM Mg2+-containing bath solution # 1 at the beginning of the experiment as a “leak” current.
- Save the recorded current traces for further analysis.
7. Data Analysis
- Retrieve the saved current records into analysis software. We use the Pulse program for analysis.
- Measure the current amplitudes at the beginning and at the end of voltage ramps. We typically measure the current amplitudes at -100 mV and at +100 mV using pairs of cursors in the “Oscilloscope” window of the Pulse program.
- Export the values of current amplitudes into a graphic program for further analysis and graphical presentation. We use Origin Scientific Graphing and Analysis Software, version 7.
8. Representative Results
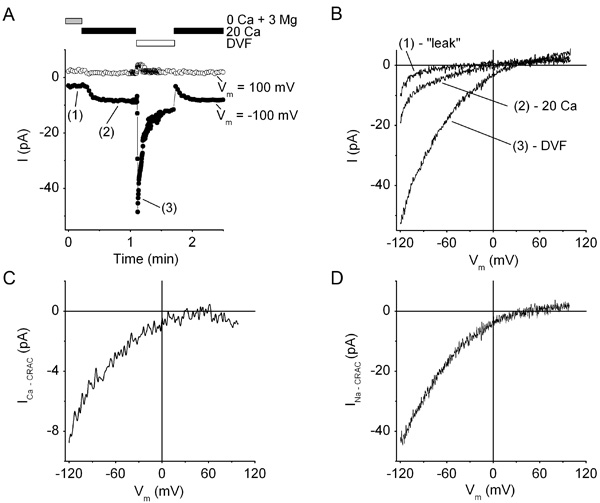
Figure 2. CRAC currents in a resting human T cell. (A), Time course of CRAC currents recorded in whole-cell voltage-clamp configuration at -100 mV (filled circles) and +100 mV (open circles). Prior to gigaseal formation, the cell was preincubated for ~10 min in Ca2+-free 3 mM Mg2+-containing bath solution #1 containing 0.5 μM thapsigargin. After break-in, bath solutions were sequentially applied as follows: Ca2+-free 3 mM Mg2+-containing bath solution #1 (0 Ca + 3 Mg), followed by 20 mM Ca2+-containing bath solution #2 (20 Ca), followed by divalent cation-free bath solution #3 (DVF), followed by bath solution #2 (20 Ca). The cell was stimulated with a series of voltage ramps as shown in Figure 1. The frequency of ramps was 5 Hz in bath solution #3 (DVF) and 0.5 Hz in all other solutions. Note the slow development of ICa-CRAC after application of 20 mM Ca2+-containing bath solution #2 and the fast transient development of INa-CRAC in DVF bath solution #3. (B), Representative current traces recorded during voltage ramps in Ca2+-free 3 mM Mg2+-containing bath solution #1 (“leak”), 20 mM Ca2+-containing bath solution #2 (20 Ca), and bath solution #3 (DVF). (C, D), Current-voltage relationships of ICa-CRAC (C) and INa-CRAC (D) obtained by subtracting “leak” current from the currents recorded during voltage-ramps in 20 mM Ca2+-containing bath solution #2 (20 Ca), and bath solution #3 (DVF) shown in panel (B).
