1. Some care must be taken in preparing and placing a Raman sample within this system.
- Because the system typically makes use of very high numerical aperture objectives with very short working distances, the samples are placed on a coverslip. Biological samples are typically placed on a No. 1 thickness coverslip mounted in an Attofluor cell chamber (Invitrogen, Carlsbad, CA).
- Liquid samples, particularly those toxic to humans, are placed in a small glass bottle with a coverslip cemented to the opening by means of a silicone epoxy. The bottle is then inverted for measurement.
- Because our system depends on precise timing of the pump and signal pulses, we are constrained not to use the conventional focus adjustment of our microscope, which translates the objective up and down. This adds and subtracts optical path from our system. Instead, we place our samples on a secondary stage mounted on top of the microscope stage that has its own independent focus control.
2. In order to take time-gated Raman spectra, the excitation beam must be properly prepared.
- We start with light emerging from a 2.4 W tunable pulsed Ti:Sapph laser (Chameleon, Coherent Systems, Santa Clara, CA). Each pulse in the 80 MHz pulse train has 30 nJ of energy, has a temporal width of 140 fs, and has a spectrum centered at 808 nm with a spectral bandwidth of ~6 nm.
- To prevent back-reflections from re-entering the laser cavity, the light is passed through a Faraday isolator. A half-wave plate placed before the Faraday isolator allows continuous tuning of the total power sent into the system.
- Because 6 nm is too broad a bandwidth to resolve most Raman modes, the beam is sent through a very narrow (0.8 nm FWHM, Andover Corporation, Salem, NH) bandpass filter centered at 808 nm.
- The light is then focused by an achromatic doublet (f = 100 mm) onto a 5 mm β-Barium Borate (BBO) crystal (CASIX, Fuzhou, Fujian, P. R. China) to halve the wavelength from 808 nm to 404 nm. The BBO crystal is placed in a mount with tip and tilt controls, and also mounted on a translation stage. To maximize the efficiency of the wavelength conversion, the crystal must be placed precisely symmetric about the focus of the doublet, and with its crystal axis aligned to the polarization of the incoming beam.
- Because efficiency of the wavelength conversion is polarization-dependent, control over the amount of light sent to the sample can be obtained by placing a second half-wave plate after the Faraday isolator. By rotating this waveplate, the intensity of light sent to the sample can be adjusted independently of the intensity sent in the pump beam (to be discussed below).
- The wavelength-converted light is recollimated by a second achromatic doublet (f = 500 mm) chosen such that the exiting beam is large enough to fill the back aperture of the microscope objective, and directed into an inverted microscope (IX-71, Olympus, Center Valley, PA) by means of two steering mirrors.
- The microscope objective, being the optical element housed within the most monolithic component of the system, defines the optic axis. To align the excitation beam to this axis, a mirror is placed in the sample plane of the microscope. The two steering mirrors are then iteratively tuned while observing the back-reflected laser beam on a CCD cam-era (μEye, IDS, Obersulm, Germany) attached to the imaging port of the microscope. Assuming that the image on the camera is centered on the microscope’s field-of-view, the beam is on-axis when the focal spot is centered on the microscope chip and translation of the objective along the z-axis does not change the center point of the defocused beam.
- When a sample is placed in the sample plane and irradiated with laser light Raman scattering occurs. A dichroic filter placed below the microscope objective separates the wavelength-shifted Raman scattered light (and fluorescence) from the excitation beam, directing the Raman scattered light to the side port of the microscope. The microscope was modified to remove any lenses within this path, such that the signal light emerges from the microscope collimated.
- Because the signal beam emerging from the microscope is larger than the clear aperture of the Glan-thompson polarizers, a 0.47x telescope constructed of two achromatic doublets (f1 = 75 mm, f2 = 35 mm) is used to shrink the beam.
- The signal light is then polarized by a Glan-Thompson polarizer oriented at 0° with respect to vertical in the lab frame, and directed to a dichroic mirror where it is recombined with the pump beam.
3. In order for the optical gate to operate at peak efficiency, care must be taken in the preparation of the pump beam (Kerr beam) as well.
- The pump pulse is first magnified by 0.35x with a telescope constructed with two achromatic doublets (f1 = 35 mm, f2 = 100 mm) to match the final size of the signal beam.
- The pump beam is then sent into a delay line composed of a right angle prism placed on a linear translation stage that can be tuned to ensure temporal overlap of the pump and signal pulses (tuning to be discussed below).
- After the delay line, the beam is sent through a half-wave plate and polarizer oriented at 45° with respect to vertical in the lab frame. This ensures the proper polarization state of the pump beam when it reaches the nonlinear medium.
- The light is then reflected off of two steering mirrors, one with piezo-electric controls, that are used to finely adjust the position of the pump beam such that it overlaps spatially with the signal beam. The overlap is obtained by observing the pump and signal beams at two locations, one close and one far from the dichroic mirror where the beams are combined. By using the first steering mirror to overlap the two beams at the near point, and the piezo mirror to overlap the beams at the far point, the pump beam can be made exactly collinear with the signal beam.
- With the two beams combined, the Kerr gate and collection system are set up to maximize the collected time-gated signal.
4. With the two beams combined, the Kerr gate and collection system are set up to maximize the collected time-gated signal.
- The pump and signal beams are first passed through a dichroic filter that has an OD of 6 at 404 nm to prevent any residual excitation light from exciting Raman scattering within the nonlinear medium.
- The pump and signal beams are then both focused by an achromatic doublet (f = 35 mm) into a 1 cm pathlength quartz cuvette containing the nonlinear material. Any nonlinear material having a suitably high nonlinear index (higher than CS2), and suitably short temporal response (<2 ps), can be utilized here. For these experiments, we use carbon disulfide, CS2 , that has a nonlinear index n2 = 3.1 x 10⁻¹⁸ m2/W. The light is then recollimated by a second doublet with a focal length identical to the first.
- The beams are then passed through and Glan-Thompson analyzer on a rotating mount, and then through a set of absorption and interference filters that combined have an OD of 10 at 808 nm.
- Finally, the signal light is focused by an achromatic doublet (f = 35 mm) into a 50 μm multimode optical fiber, where the fiber is mounted in a stage that allows translation in x, y, and z. The fiber is then coupled to a commercial imaging spectrograph with attached CCD camera (SP2300i and Pixis 100B, respectively, both manufactured by Princeton Instruments, Trenton, NJ).
- To align the collection system to maximize collected signal, the analyzer is set to 0° and a test sample of toluene is placed in the sample plane. By adjusting the x, y, and z controls of the fiber mount, the collected Raman signal is optimized.
- To ensure proper spatial and temporal overlap of the pump and signal beams, a mirror is placed in the sample plane of the microscope. The 404 nm filter is removed from the system. With the analyzer rotated to 90° the retroreflected 404 nm beam is sent into the spectrograph with the intensity adjusted such that it does not saturate the camera. With the pump beam off, the analyzer is rotated to minimize the transmitted 404 nm signal. With the pump beam turned back on, the delay stage is slowly tuned until the transmission of the 404 nm light begins to increase. Then, by iteratively tuning the delay stage, the piezo-electric mirror, and the x, y, and z controls of the fiber, one maximizes the signal.
- Because the retro-reflected 404 nm beam and the Raman scattered light may take slightly different paths through the system, final adjustments are made by placing a strong Raman scatterer (such as toluene) on the sample stage and the slightly tweaking the alignment by changing the delay stage, piezeo-electric mirror, and x, y, and z controls of the fiber to optimize the Raman signal.
5. Collection of a single time-gated Raman spectrum requires acquisition of several spectra to correct for system artifacts.
- With the analyzer set to 0°, the excitation beam on and the pump beam off, an “ungated” spectrum is taken, representing the spectrum that would be acquired without the benefit of the time-gating system.
- With the analyzer set to 90°, the excitation beam and the pump beam still off, a back-ground spectrum is taken, representing the amount of stray light leaking through the polarizers and other elements in the system.
- With the analyzer remaining at 90° and all beams on, the “gated” spectrum is taken, representing the Raman scattered light allowed through the crossed polarizers by the presence of the pump beam.
- Finally, with the analyzer still at 90°, the excitation beam off and the pump beam on, a second background spectrum is taken, representing the contribution to the “gated” spectrum of residual amounts of 808 nm light entering the spectrograph.
- Additionally, a spectrum is taken with all lasers off, characterizing the baseline “dark” signal level of the camera and electronics.
- Because the spectra often require lengthy integration times, it is imperative to break this integration time into several pieces (frames) to allow for proper correction of cosmic rays – a common problem when acquiring data over spans of several minutes.
6. Once acquired, several processing steps are helpful to improve the quality and appearance of the data.
- First, all spectra are dark corrected by subtracting off the “dark” spectrum.
- To correct for cosmic rays, the several frames constituting one acquisition are compared to each other on a pixel-by-pixel basis. For any pixel of any frame that falls outside of 2 median deviations from the median value for that pixel across all frames, that pixel’s value is replaced by the median value across all frames.
- The cosmic ray corrected frames are then averaged and smoothed by a Savitzky-Golay filter 1.
- To extract the “true” gated spectrum, we subtract the “excitation-only” and “pump-only” spectra from the measured gated spectrum.
- Finally, the gated and ungated spectra are then background corrected by subtracting a 5th-order polynomial, determined using the method of Lieber and Mahadevan-Jansen 2.
7. Representative Results:
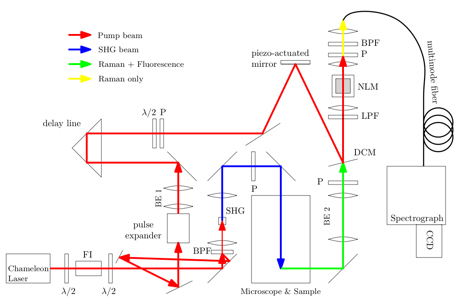
Figure 1. Schematic diagram of the Kerr gating system. The pump beam path is shown in red, while the SHG path is shown in blue. The path where Raman and Fluorescence are overlapped is shown in green, while the path where the Fluorescence has been temporally filtered out is shown in yellow. Abbreviations as follows: BPF, band pass filter; CCD, charge-coupled device; DCM, dichroic mirror; FI, Faraday isolator; λ/2, half wave plate; LPF, long-pass filter; NLM, nonlinear medium; P, polarizer; SHG, second harmonic generation crystal.
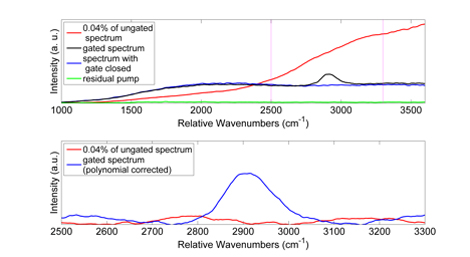
Figure 2. Top: Raw spectra of coumarin dissolved in immersion oil. Red curve shows the spectrum taken with the gate held open (analyzer set for maximum transmission). Black curve shows the spectrum taken with the analyzer aligned for minimum transmission and a pump beam applied (the gated spectrum). Blue curve shows the spectum taken with the analyzer aligned for minimum transmission and no pump beam applied (gate held closed). Green curve shows the spectrum taken with only the pump beam applied. Dashed magenta lines indicate spectral region shown in panel below. All spectra have been smoothed with a 11 point, 3rd order Savitzky-Golay filter. Bottom: Spectra of coumarin dissolved in immersion oil after fluorescence background subtraction. Red curve is the spectrum with the gate held open, and the blue curve is the gated spectrum. The gated spectrum clearly shows the convoluted high-wavenumber peak characteristic of oils.
