A protocol for nanoparticle tracking analysis (NTA) and high-throughput flow cytometry to evaluate polymeric gene delivery nanoparticles is described. NTA is utilized to characterize the nanoparticle particle size distribution and the plasmid per particle distribution. High-throughput flow cytometry enables quantitative transfection efficacy evaluation for a library of gene delivery biomaterials.
Non-viral gene delivery using polymeric nanoparticles has emerged as an attractive approach for gene therapy to treat genetic diseases1 and as a technology for regenerative medicine2. Unlike viruses, which have significant safety issues, polymeric nanoparticles can be designed to be non-toxic, non-immunogenic, non-mutagenic, easier to synthesize, chemically versatile, capable of carrying larger nucleic acid cargo and biodegradable and/or environmentally responsive. Cationic polymers self-assemble with negatively charged DNA via electrostatic interaction to form complexes on the order of 100 nm that are commonly termed polymeric nanoparticles. Examples of biomaterials used to form nanoscale polycationic gene delivery nanoparticles include polylysine, polyphosphoesters, poly(amidoamines)s and polyethylenimine (PEI), which is a non-degradable off-the-shelf cationic polymer commonly used for nucleic acid delivery1,3 . Poly(beta-amino ester)s (PBAEs) are a newer class of cationic polymers4 that are hydrolytically degradable5,6 and have been shown to be effective at gene delivery to hard-to-transfect cell types such as human retinal endothelial cells (HRECs)7, mouse mammary epithelial cells8, human brain cancer cells9 and macrovascular (human umbilical vein, HUVECs) endothelial cells10.
A new protocol to characterize polymeric nanoparticles utilizing nanoparticle tracking analysis (NTA) is described. In this approach, both the particle size distribution and the distribution of the number of plasmids per particle are obtained11. In addition, a high-throughput 96-well plate transfection assay for rapid screening of the transfection efficacy of polymeric nanoparticles is presented. In this protocol, poly(beta-amino ester)s (PBAEs) are used as model polymers and human retinal endothelial cells (HRECs) are used as model human cells. This protocol can be easily adapted to evaluate any polymeric nanoparticle and any cell type of interest in a multi-well plate format.
The determination of the number of plasmids complexed per nanoparticle is important to design effective nanoparticle-based gene delivery strategies, particularly for co-delivery of multiple plasmids to the same cell target, as often is required in stem cell reprogramming studies12. Few approaches to calculate the number of plasmids associated with a single nanoparticle have been described, and each approach has drawbacks in the techniques used for estimation13-16. Quantum dot (QD) labeling combined with TEM has been used to estimate plasmids per particle in chitosan-based nanoparticles. Estimation with this QD technique is complicated due to the need to label the DNA, which may alter its self-assembly properties; the possibility that encapsulated unlabeled DNA is not directly detected; potentially overlapping plasmids and QDs in the 2D TEM images of particles; and other simplifying assumptions13. An alternative approach that is applicable when ordered microdomains exist in the particles has been used to study Lipopolyamine-DNA complexes via cryo-transmission electron microscopy (cryo-TEM), X-ray scattering, and dynamic light scattering (DLS)14,15 . Unfortunately, materials such as the polymeric nanoparticles investigated here are not applicable with this method. In another study, Collins et al. used a flow particle image analysis technique to study (Lys)16-containing peptide/DNA complexes; however, their method can only evaluate larger, micron-sized particles16. Thus, we recently developed a novel and flexible assay to quantify the number of plasmids per nanoparticle11.
1. Cell Seeding
2. Cell Transfection
3. Analysis of Transfection Efficiency and Cell Toxicity
Transfection efficiency is analyzed visually with a fluorescence microscope and quantified using a flow cytometer forty-eight hours post-transfection. Cell toxicity is analyzed visually with a fluorescence microscope and quantified using the CellTiter 96 AQueous One assay twenty-four hours post-transfection.
4. Nanoparticle Sizing with NTA and Plasmid Per Particle Calculations
Figure 1 shows a fluorescence microscopy image of an example of a successful transfection of HRECs with the EGFP plasmid. The brightfield image is helpful to ensure that cells maintain their usual morphology. Additionally, cell viability assays, such as MTS or similar assays, can be used to assess the nanoparticle toxicity7. Flow cytometry, as described, can be used to quantify the transfection efficiency. When using the HyperCyt multi-well plate attachment, the data will need to be processed appropriately in order to correctly identify the wells. As can be seen in the right panel of Figure 2, when the cell counts are good (thousands of cells per well), and the fluidics are operating correctly, the individual wells are easier to pick out both manually and by the software. However, if the cell counts are too low or there is a problem with the fluidics, it becomes much more difficult to identify the individual wells (left panel of Figure 2), and the experiment likely needs to be repeated. Replacing the tubing of the Hypercyt can often fix problems with the sample flow. Once the individual well data are obtained, most common flow cytometry software can be used to analyze the exported .FCS files. In Figure 3, FlowJo is used to gate the positively transfected cells by comparing to the untreated wells.
The PBAE nanoparticles are usually between 100 – 200 nm in size as measured by the Nanosight NTA. When performing NTA, it is important that the number of nanoparticles on the screen be between 20 – 100 so that the software will be able to accurately track the particles. Figure 5A is an example of too many particles, while Figure 5B shows an example of an appropriate number. Processing the captured video should be done such that the observed particles onscreen are picked up by the software, represented with the red cross hairs. An example of when the threshold for picking up particles is too low can be seen in Figure 5C, while an example of a better threshold level is seen in Figure 5D. A different dilution of the sample can be performed to make sure that the sample is in the correct concentration range. The new particle concentration given by the Nanosight should match the new dilution. Once the size and particle concentration are obtained, the plasmid per particle average and distribution can be calculated. Example results can be seen in Figure 6. The experimental timeline is shown in Figure 7.
Wells/Plate | Volume/Well (μl) | Cells/Well |
96 | 100 | 2,500 to 5,000 |
Table 1. Typical cell plating protocol for a 96-well plate format.
Wells/Plate | Volume/Well (μl) | Particle Volume/Well (μl) | DNA/Well (μg) | DNA (μg/ μl) | DNA 1 μg/μl stock (μl) | NaAc (μl) |
96 | 100 | 20 | 0.6 | 0.06 | 3 | 47 |
Table 2. Typical DNA dilution protocol for a 96-well plate format.
Polymer:DNA (wt/wt) | Particle Volume/Well (μl) | # Replicate Wells | DNA/ Well (μg) | Polymer/Well (μg) | Polymer/ 10 μg/μl stock (μl) | NaAc (μl) |
20 | 20 | 4 | 0.6 | 12 | 6 | 44 |
40 | 20 | 4 | 0.6 | 24 | 12 | 38 |
60 | 20 | 4 | 0.6 | 36 | 18 | 32 |
100 | 20 | 4 | 0.6 | 60 | 30 | 20 |
Table 3. Typical polymer dilution protocol for a 96-well plate format.
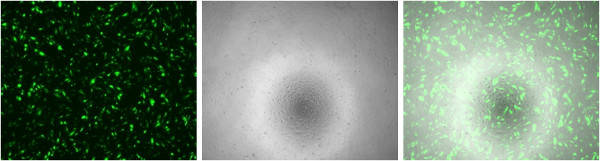
Figure 1. Single color channel fluorescence imaging of HRECs transfected with PBAE. (Left) GFP fluorescence, colored green; (Middle) Brightfield image; (Right) Composite image.
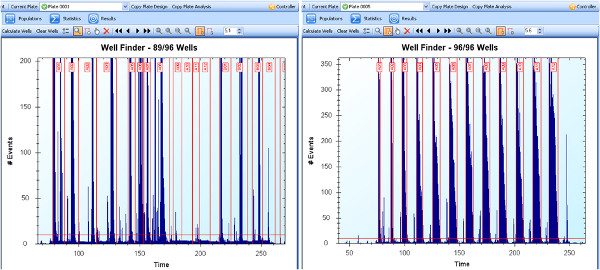
Figure 2. Hypercyt software well identification step after data collected. (Left) Example of problematic data due to low counts or issue with the fluidics; (Right) Example of clean data, with easily identified wells. Click here to view larger figure.
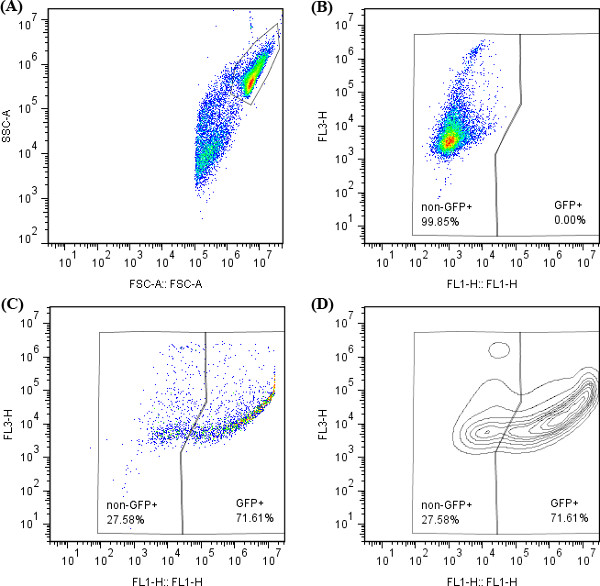
Figure 3. FlowJo gating for cells transfected with EGFP plasmid. (A) FSC vs. SSC for untreated cells; (B) FL1 vs. FL3 for untreated cells; (C, D) FL1 vs. FL3 for cells transfected with PBAE. Both pseudo-color density (C) and (D) contour plots are useful to determine the location to draw gates.
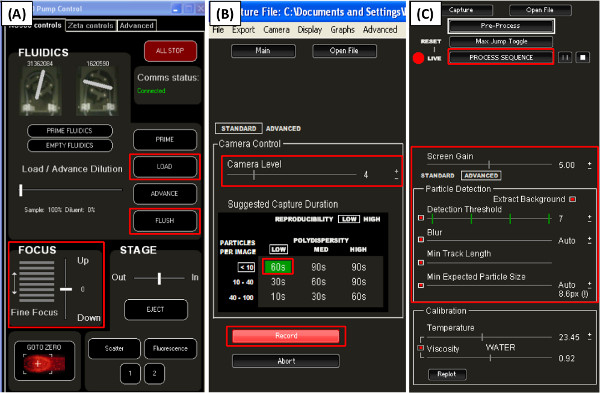
Figure 4. Screenshot of parts of the Nanosight nanoparticle tracking analysis software, version 2.2. (A) The fluidics control; (B) Capture mode, used to capture video of the nanoparticles; (C) Processing mode available after opening a previously captured video. Red boxes highlight functions discussed in the protocol. Click here to view larger figure.
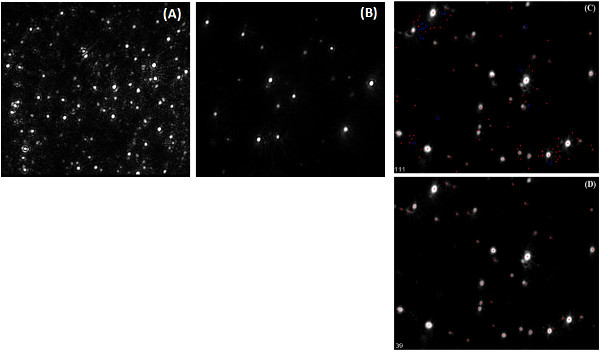
Figure 5. Example of Nanosight video capture and analysis. Screenshots of sample before video capture for sample that is not diluted enough (A), and with appropriate dilution (B); Screenshots of analysis mode with particle detection threshold set too low (C) and set appropriately (D), with red cross hairs identifying all particles appropriately. Click here to view larger figure.
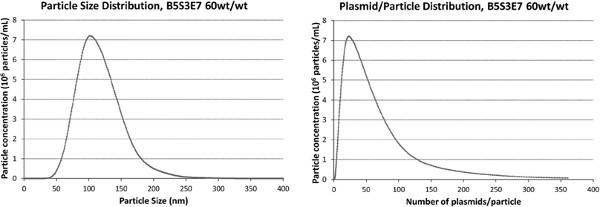
Figure 6. Size distribution and plasmid per particle distribution data of PBAE (B5S3E7, 60:1 polymer to DNA wt/wt) based nanoparticles analyzed using nanosight tracking analysis technique. Reprinted from [14] Small, 8, Bhise, N.S., Shmueli, R.B., Gonzalez, J., and Green, J.J. A novel assay for quantifying the number of plasmids encapsulated by polymer nanoparticles, 367-373, Copyright 2012, with permission from Wiley-VCH. Click here to view larger figure.
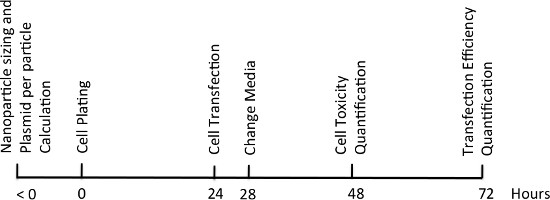
Figure 7. Experimental timeline.
The protocols above describe methods of evaluating the transfection efficacy of nanoparticle formulations, as well as a way to characterize the particle size and DNA loading of the nanoparticles. The number of plasmids per particle is an important parameter that can help predict the effectiveness of the particle and can also be used for dose determination. Nanoparticle tracking analysis can be performed in a range of different aqueous solutions, such as those differing in salt concentration. Often this characterization is performed in PBS, to mimic physiological saline. While sizing in PBS can give a good estimate of the size of the nanoparticles in media or physiological saline, the amount of serum present can affect the size and stability of nanoparticles17. Therefore, particle characterization in various concentrations of serum can be important for certain applications as well. In order to characterize the particles in serum, an additional step is recommended due to the high background scattering of serum proteins. In this case, the particles should be fluorescently tagged, so that through the use of the fluorescence filter, the particles can be specifically tracked distinctly from serum proteins.
The plasmid per particle quantification is general enough to be used with different nanoparticle formulations, including other polymeric or inorganic particulate systems. Due to the different light scattering behavior of different materials, the video capture and processing parameters may need to be modified. Additionally, the sensitivity of the NTA may change depending on the material. The plasmid per particle protocol described above is a fast and useful method for characterizing nanoparticles.
The authors have nothing to disclose.
The authors thank the TEDCO MSCRF (2009-MSCRFE-0098-00) and NIH R21CA152473 for support.
Reagent | |||
Phosphate Buffered Saline, 1x (PBS) | Invitrogen | 10010 | |
EGM-2MV BulletKit | Lonza | CC-3202 | |
Trypsin | Invitrogen | 25300 | |
Sodium acetate buffer | Sigma-Aldrich | S7899 | Dilute to 25mM in deionized water |
Dimethyl sulfoxide | Sigma-Aldrich | 276855 | |
pEGFP DNA | Elim Biopharmaceuticals | NA | |
DsRed DNA | Addgene | 21718 | |
PEI, branched | Sigma-Aldrich | 408727 | |
CellTiter 96 AQueous One | Promega | G3580 | |
Materials | |||
Clear flat bottom 96-well plate, sterile | Sarstedt | 82.1581.001 | |
Clear round bottom 96-well plate, sterile | Sarstedt | 82.1582.001 | |
12-channel Finnpipette | Thermo Scientific | NA | 5-50 and 50-300 μl |
Fluorescence Microscope | Zeiss | NA | Model number: AX10 |
C6 Accuri flow cytometer | BD Biosciences | NA | |
HyperCyt attachment | Intellicyt | NA | |
NS500 | Nanosight | NA |