We describe procedures to quantify and characterize atherosclerotic lesions in mouse models using precision sectioning of the aortic sinus and ascending aorta combined with histochemical and immunohistochemical analysis.
Atherosclerosis is a disease of the large arteries and a major underlying cause of myocardial infarction and stroke. Several different mouse models have been developed to facilitate the study of the molecular and cellular pathophysiology of this disease. In this manuscript we describe specific techniques for the quantification and characterization of atherosclerotic lesions in the murine aortic sinus and ascending aorta. The advantage of this procedure is that it provides an accurate measurement of the cross-sectional area and total volume of the lesion, which can be used to compare atherosclerotic progression across different treatment groups. This is possible through the use of the valve leaflets as an anatomical landmark, together with careful adjustment of the sectioning angle. We also describe basic staining methods that can be used to begin to characterize atherosclerotic progression. These can be further modified to investigate antigens of specific interest to the researcher. The described techniques are generally applicable to a wide variety of existing and newly created dietary and genetically-induced models of atherogenesis.
In the last two decades the development and use of atherosclerosis-prone mouse models through dietary and/or genetic manipulation have significantly increased our understanding of the molecular and cellular mechanisms involved in atherosclerotic lesion development1-3. A great deal of our knowledge and understanding of atherogenesis comes from studies carried out in apolipoprotein (Apo)-E deficient4 mice, in which atherosclerotic lesions develop spontaneously and low density lipoprotein receptor (LDLR)-deficient5 mice, in which atherosclerosis is diet induced. An important advantage of these models is that they permit the study of relatively large numbers of genetically defined animals under controlled dietary and environmental conditions. In addition, the advanced atherosclerotic lesions that develop in some of these mouse strains appear to be very similar to those observed in human subjects, containing lipid filled necrotic cores and fibrous caps. Atherosclerosis develops rapidly in these mouse models making it very feasible to study lesion development, from fatty streak to advanced plaque, over a matter of weeks. Furthermore, known risk factors for cardiovascular disease in humans, including diabetes6, dyslipidemia7, obesity8, hypertension9, cigarette smoke10, and a sedentary environment11 have been shown to further accelerate lesion development.
In most, if not all atherosclerosis-prone mouse models, lesion development can be first detected at the aortic sinus. The time of onset depends on mouse strain and diet. As lesions increase in size they tend to grow up the ascending aorta. In ApoE-/- and LDLR-/- mice, subsequent lesion development can be detected at aortic bifurcations in the aortic arch, in the descending aorta and in other larger arteries12-14. Dr Beverly Paigen and colleagues, in addition to developing some of the earliest models of diet-induced atherosclerosis, also established an assay for the quantification of atherosclerotic lesions at the aortic sinus that has become the standard of lesion measurement in mouse models15. Over the years this technique has been refined and described in detail16. Here we present a modified version of the "Paigen method" for the quantification and characterization of atherosclerotic lesions in a mouse. The analysis of serial aortic cross sections from a specific vascular region and in a defined and fixed orientation, facilitates precise data collection and permits the accurate detection of variations in lesion development in different treatment groups. The methods presented here builds upon the previous techniques. Specifically, we describe how the characterization of lesion in terms of area, volume, necrotic, and cellular content is possible through the examination of serial sections using a combination of histochemistry and immunohistochemistry.
The McMaster University Animal Research Ethics Board has preapproved all procedures described herein.
1. Harvesting Heart and Aorta
2. Preparation of the Aorta
3. Sectioning of the Aorta
4. Staining and Quantification of Atherosclerotic Lesions
Atherosclerotic lesions can be analyzed in many different ways using a variety of techniques. The most basic analysis involves determination of lesion cross sectional area. In order to accurately compared lesion area, it is important that the starting point for lesion measurement is consistent from sample to sample. This is facilitated by using the valve leaflets for orientation. To facilitate the accurate identification and quantification of the lesion area, select cross sections are stained with hematoxylin and eosin. This involves immersing the slides in a series of solutions for specified times, that will deparaffinize/stain the tissue.
Protocol for hematoxylin and eosin staining:
5. Further Characterization of the Atherosclerotic Lesion
Specific details regarding the stage of atherosclerotic development can be determined by staining with antibodies directed against specific cell types or markers. Immunohistochemistry on paraffin sections is a standard technique that is used to identify specific cell types or markers within the context of the surrounding unstained tissue. Antigen detection is generally achieved using a horseradish peroxidase substrate.
Immunofluorescence staining involves the use of fluorophore-conjugated antibodies and requires a fluorescence microscope and appropriate filters for detection. This technique permits simultaneous staining of two (or more) antigens.
General Protocol for Immunohistochemical staining:
6. General Protocol for Immunofluorescence Staining
A similar protocol, with minor changes, can be followed for immunofluorescence staining.
Five week old LDLR-/- mice were fed a standard diet or a high fat diet for ten weeks. Mice were sacrificed and perfused with formalin as described above. Cross sections of the aortic sinus were prepared and stained with hematoxylin and eosin to determine lesion area and volume (Figure 4). When mice are fed a standard chow diet, atherosclerotic development is very limited and may not be detectable at 15 weeks of age. High fat diet significantly accelerates atherogenesis in this model and induces the formation of large advanced lesions containing necrotic acellular cores and fibrous caps.
Atherosclerotic lesions can be further characterized by staining for the presence of specific cell types and factors that define stages of lesion development. Monocyte infiltration into the intima represents one of the earliest events of atherogenesis. Intimal monocytes differentiate into macrophages which engulf cellular debris and lipids. Lipid engorged macrophages, known as foam cells, create a "fatty streak" in the artery wall.
Macrophage/foam cells can be detected at all stages of lesion development by staining with antibodies against specific macrophage markers including F4/8017, CD6818, Mac-3 (CD107)19, and MOMA-220 (Figure 5). Vascular smooth muscle cells (VSMCs) are confined to the medial layer of a healthy artery. VSMCs are induced to migrate and proliferate in the intima during the development of an advanced lesion. VSMCs can be identified by staining with an antibody against alpha actin21 (Figure 5).
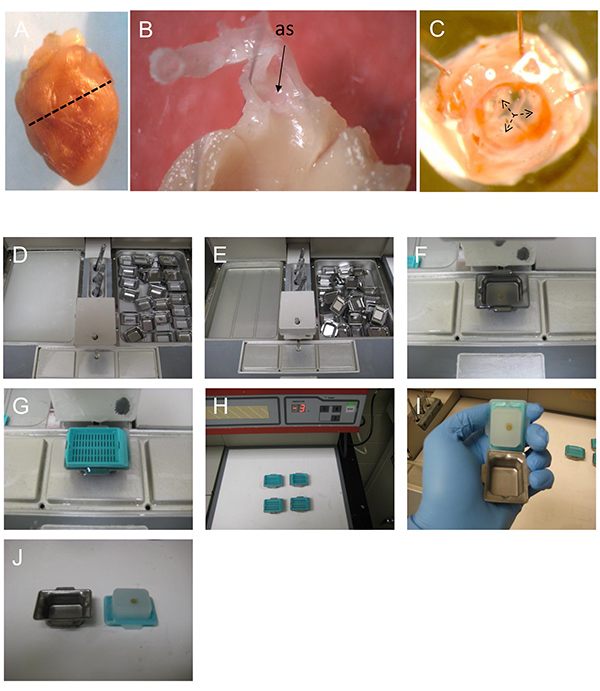
Figure 1. Preparing the heart and the aortic sinus for embedding and sectioning. A) The mouse heart is transversely cut along a straight line joining the lower tips of the right and left atria. The apical (top) part of the heart is processed to examine and quantify atherosclerosis in the aortic sinus. B) A cut away view showing the orientation of the ascending aorta and the aortic sinus (as) of a dissected heart. C) A view of the aortic sinus from inside the heart. The three aortic valve leaflets are identified (black arrows). D-E) paraffin wax is melted overnight and (F) poured into the mold containing the tissue. G) The mold is covered with a labeled plastic cassette and (H) cooled on ice to set. I-J) The solid paraffin block is separated from the mold and is ready for sectioning.
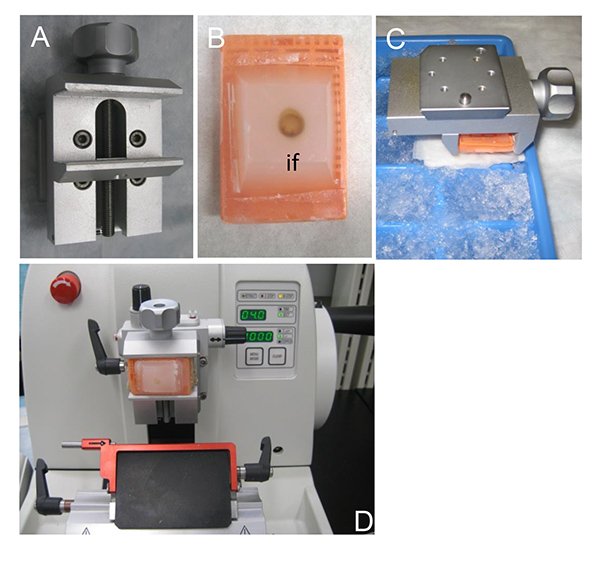
Figure 2. Tissue sectioning using a microtome. A) The specimen holder that allows cutting angle adjustments during sectioning. B) A paraffin block containing the dissected heart. The sectioning proceeds from the inner face (if) of the dissected heart which has to be completely exposed in the paraffin block. C) Cooling the specimen on ice just prior to sectioning. Cooling causes the paraffin block to contract and improves the quality of the resulting sections. D) The microtome set up. Sections 4-5 µm of thickness are ideal for staining and analysis.
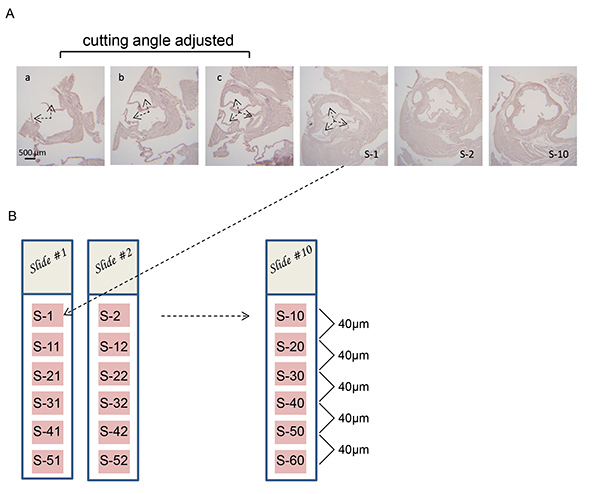
Figure 3. Adjusting the microtome cutting angle to obtain perpendicular cross sections of the aortic sinus. A) Series of cross sections of aortic sinus from an LDLR-/- mouse. Two partial valve leaflets are visible in section "a" (arrows). The cutting angle is adjusted "a-b" and "b-c" until all three valve leaflets are equally visible in each section ("c") (arrows). Under normal circumstances the cutting angle will be adjusted by viewing unstained sections under a light microscope. The sections shown have been stained to increase clarity. B) 10 glass slides are labeled from Slide #1 to Slide #10 and 4 µm thick sections (S-1 to S-10) are collected successively onto the top portion of each slide. Then, the next series of 10 subsequent sections are collected following the same pattern: S-11 to S-20; S-21 to S-30; S-31 to S-40 until the atherosclerotic lesions are no longer observed. Hematoxylin and eosin staining is carried out to visualize the atherosclerotic lesions on each section of the slide being analyzed.
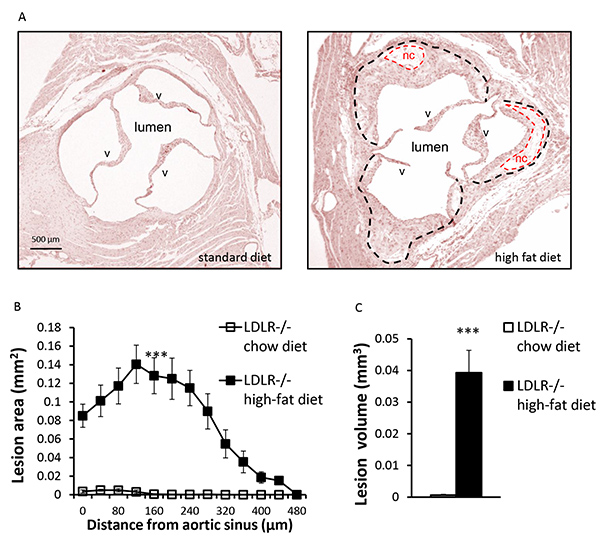
Figure 4. Quantification of atherosclerotic lesions. A) Representative hematoxylin and eosin stained cross sections of aortic sinus from a 15-week-old LDLR-/- mouse fed a standard or high-fat diet, as indicated. Atherosclerotic lesions (outlined with black dashes) and acellular necrotic core (nc) (outlined with red dashes) as well as the aortic valves (v), are indicated. B) Quantification of atherosclerotic lesion area through the aortic sinus and ascending aorta. Each point represents the mean lesion area (± SEM) determined at a specific distance from the aortic sinus. Atherosclerotic lesion area is measured using ImageJ software. C) The volume of the atherosclerotic lesions is estimated by calculating the area under the curve for each condition. n=5 mice per group, *** p<0.001.
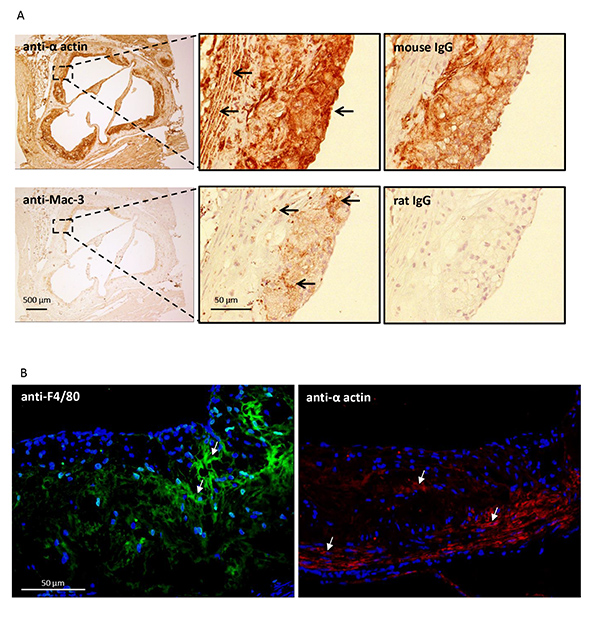
Figure 5. Characterization of the atherosclerotic lesion. Cross sections of the aortic sinus were prepared from 15 week old LDLR-/- mice fed a high fat diet. A) Sections were immunostained for macrophage/foam cells (Mac-3) or vascular smooth muscle cells (anti-alpha actin) using a standard immunohistochemical technique (see protocol 5). Positively stained cells are indicated by the arrows. Serial sections were stained with preimmune IgG as a control. B) Similar sections were immunostained for macrophage/foam cells (F4/80) or vascular smooth muscle cells (anti-alpha actin) using an immunofluorescence technique (see protocol 6). Positively stained cells are indicated by the arrows.
Atherosclerosis is a complex chronic disease of the large muscle arteries that is a major underlying cause of myocardial infarction and stroke. Disease progression involves the interplay of many different cell types within the artery wall, with circulating blood cells, lipoprotein particles and other blood-borne factors that we are just beginning to understand. Much of our current knowledge regarding the development and progression of atherosclerosis has come from studies carried out in specially designed atherosclerosis-prone mouse model systems.
It is important to remember that mouse models of atherosclerosis have some significant limitations. Obviously, compared to human subjects, mice have significant differences in vessel size and surface area as well as blood flow, pulse rate, blood pressure, and shear stress. Lesion rupture and arterial thrombosis, the direct cause of most myocardial infarcts in humans, are not observed in the majority of atherosclerosis-prone mouse models. Furthermore, the general lack of genetic diversity in these strains, decreases variability in experimental outcomes, but also introduces artificial constraints upon pathologies that are difficult to account for. Thus, care must be taken in the interpretation and extrapolation of data collected from these mouse models with respect to human cardiovascular disease. Despite these limitations, model refinements facilitated by Cre-lox, and other genetic strategies, together with the technical advances that are continuously improving small animal imagining systems, make it likely that mouse models will continue to be at the forefront of research into cellular and molecular mechanisms of cardiovascular disease for the years to come.
It is well established, in humans, mice and other animals, that specific regions of the vasculature are more susceptible to atherosclerosis than others22,23. Thus, when quantifying, characterizing and comparing atherosclerotic lesion development between individuals, the location of the analysis within the vasculature is very important. Most previous described methods used to quantify atherosclerosis in the aortic root rely upon the comparison of lesion area at a specific site; for example, at the sinus or at a specific distance from the sinus4,6,8,15. Because of the focus on a single predetermined region, these methods will not detect potential differences in lesion shape that may be important in some models. By examining cross sections of the entire lesion, and through the calculation of the lesion volume, these site specific biases are minimized.
We describe a method that can be used to accurately quantify the extent (area and volume) of atherosclerotic lesion development in a mouse. The data obtained using this method can be used to compare lesion development from one mouse to another, and/or to compare mice from different treatment groups. This is possible, because the precise orientation of the sectioning at the aortic sinus facilitates the analyses of the exact same region of vasculature in each animal. Thus, the most critical, and most technically difficult, aspects of this procedure are; i) to properly orient the tissue sample when embedding, ii) to carefully begin sectioning the top of the heart so that the valve leaflets of the aortic sinus can be identified and, iii) to make fine adjustments to the cutting angle so that it is exactly perpendicular to the ascending aorta. Only a small number of the collected aortic sections are required for use in calculating atherosclerotic lesion area/volume. The remaining sections can be used for more specific analysis of the composition and characteristics of the atherosclerotic lesion. A wide variety of stains can be used, including elastic Van Gieson stain or a Masson's trichrome stain, which also are compatible to paraffin sections. Immunohistochemical and/or immunofluorescent analyses are also recommended, and the basic protocols for these procedures are described above. Generally, immunohistochemistry and immunofluorescence are compatible in paraffin sections and provide excellent results. The usage of one technique over the other will depend on several factors to be considered such as the antibody, the access to a fluorescence microscope, colocalization or morphologic studies, even storing times can be determinant. The thickness, texture and quality offered by these sections provide an important advantage when compared to frozen sections. However, it is important to mention that a significant limitation is the usage of organic solvents in the processing-sample steps which remove the lipid content of the lesions. Therefore, lipid staining with Oil Red O or Sudan IV are not feasible in formalin fixed sections.
It should be noted that the described procedure is labor intensive and does require a significant amount of practice to master specific aspects of the precision sectioning protocol.
Furthermore, by virtue of its dependence on the valve leaflets as a point of orientation, this procedure is limited to analysis of the aortic sinus, the proximal ascending aorta and nearby coronary arteries. However, different anatomical landmarks could be established to investigate other regions of the vasculature. For example, researchers have developed systems to quantitatively examine the development of atherosclerosis in the aortic arch and brachiocephalic arteries24. These regions are prone to the development of clinically relevant advanced lesions. Other methods, such as en face staining, can be used to examine the entire length of the aorta14. However, the disadvantage of these alternative strategies is the fact that experimental times of 6 months to a year are required before significant lesion development is observed in these regions of the vasculature.
Finally, recent advances in three dimensional imaging have led to the development of new techniques to analyze and quantify atherosclerotic lesions in mice. These include ex vivo high resolution magnetic resonance imaging25, microscopic computed tomography26, and optical projection tomography27. These methods can be applied to a variety of regions of the mouse vasculature, including the aortic sinus. It is likely that these, and other advanced technologies, represent the future of atherosclerosis research. However, for the time being, their reliance on expensive specialized instrumentation will likely limit their accessibility to most researchers.
The authors have nothing to disclose.
This research was funded by an operating grant from the Canadian Institutes of Health Sciences and the Canadian Diabetes Association. DEV is supported by a scholarship from the Comisión Nacional de Investigación Científica y Tecnológica (CONICYT, Chile).
LDLR-deficient mice (D2.129S7(B6)-Ldlrtm1Her/J) | The Jackson Laboratory | stock #002207 | |
Formalin | Sigma-Aldrich | HT5011 | |
Histology Molds | Ted Pella Inc | 27195 | |
Paraffin | Paramat | 19286-10 | |
Coated slides | Fisher | 12-550-15 | |
Solvent containers | Tissue Tek II | 4457 | |
Microtome | Leica | RM22S5 | |
Water bath | VWR | 80086-982 | |
Microscope | Olympus | BX41TF | |
Camera | Olympus | DP72 | |
ImageJ | NIH | www.rsbweb.nih.gov/ij/ | |
Processor | Sakura Finetek | VIP6-A1 | |
Processing cassettes | VWR | 18000-134 | |
Preassure Cooker | Nordic Ware | ||
Coverslip | Fisher | 12-545-M | |
PBS | Sigma-Aldrich | P3813 | |
Microtome blade | Thermo Scientific | 30-518-35 | |
Antifade mounting medium | Sigma-Aldrich | F-4680 | |
Xylene mounting medium | Sigma-Aldrich | 44581 | |
Aquous mounting medium | Sigma-Aldrich | I1161 | |
Mac-3 anbody | BD Pharmingen | 553322 | |
DAPI | Sigma-Aldrich | D9542 | |
F4/80 antibody | Abcam | Ab6640 | |
Alpha actin antibody | Santa Cruz Biotechnology | SC-32251 | |
Mayer’s Hematoxylin | Sigma-Aldrich | E4382 | |
Eosin Y | Sigma-Aldrich | MHS16 | |
DAB (3,3'-Diaminobenzidine) | Dako | K3468 |