This protocol explores the latest advancements in performing Western blot analyses. These novel modifications employ a Bis-Tris gel system with a 35 min electrophoresis run time, a 7 min dry blotting transfer system, and infrared fluorescent protein detection and imaging that generates higher resolution, quality, sensitivity, and improved accuracy of Western data.
The Western blot techniques that were originally established in the late 1970s are still actively utilized today. However, this traditional method of Western blotting has several drawbacks that include low quality resolution, spurious bands, decreased sensitivity, and poor protein integrity. Recent advances have drastically improved numerous aspects of the standard Western blot protocol to produce higher qualitative and quantitative data. The Bis-Tris gel system, an alternative to the conventional Laemmli system, generates better protein separation and resolution, maintains protein integrity, and reduces electrophoresis to a 35 min run time. Moreover, the iBlot dry blotting system, dramatically improves the efficacy and speed of protein transfer to the membrane in 7 min, which is in contrast to the traditional protein transfer methods that are often more inefficient with lengthy transfer times. In combination with these highly innovative modifications, protein detection using infrared fluorescent imaging results in higher-quality, more accurate and consistent data compared to the standard Western blotting technique of chemiluminescence. This technology can simultaneously detect two different antigens on the same membrane by utilizing two-color near-infrared dyes that are visualized in different fluorescent channels. Furthermore, the linearity and broad dynamic range of fluorescent imaging allows for the precise quantification of both strong and weak protein bands. Thus, this protocol describes the key improvements to the classic Western blotting method, in which these advancements significantly increase the quality of data while greatly reducing the performance time of this experiment.
The technique of Western blotting was first developed between 1977 and 1979 in order to create a better method for detecting proteins using antibodies1-3. This procedure utilized electrophoretic transfer of proteins to membranes from SDS-PAGE gels with target proteins visualized using secondary antibodies and detected by autoradiography, UV light, or a peroxidase reaction product3. Thus, these same basic principles are still widely used in today's Western blot protocols. However, this classic Western blotting technique does present many disadvantages, such as slow electrophoresis run times, low resolution and artificial protein bands, susceptibility to protein degradation, and limited sensitivity as well as poor data quality4. Therefore, this protocol describes significant advances and improvements to the standard Western blot procedure that generates more accurate qualitative and quantitative data.
The Laemmli system for separating a broad range of proteins using SDS-PAGE is the most widely used gel system for Western blotting5. Despite the popularity of this Western blotting system, this method can result in band distortion, loss of resolution, and spurious bands4. This may be a consequence of the deamination and alkylation of proteins due to the high pH (9.5) of the separating gel, reoxidation of reduced disulfide bonds due to the varying redox state of the gel, and cleavage of aspartyl-prolyl peptide bonds due to heating the protein in Laemmli buffer (pH 5.2)4,6. The Bis-Tris gel system, which operates at a neutral pH (7.0), provides significant benefits over the Lamemmli system. This system improves protein stability, minimizes protein modifications, maintains proteins in their reduced states, prevents aspartyl-prolyl cleavage during electrophoresis, and more importantly, the electrophoresis run time is 35 min4,6,7. In addition, the Bis-Tris gel system also produces sharper bands, higher resolution and separation, and increased sensitivity resulting in more reliable data4.
In conjunction with the Bis-Tris gel system, the iBlot dry blotting system uses high field strength and currents to significantly reduce the transfer time of proteins from gels onto membranes within 7 min8. This transfer system is based on the dry blotting method that generates a more efficient and reliable transfer of proteins8. For a detailed comparison of the efficacy of the iBlot transfer system to the conventional transfer systems please refer to the following website: http://www.invitrogen.com/site/us/en/home/Products-and-Services/Applications/Protein-Expression-and-Analysis/Western-Blotting/Western-Blot-Transfer/iBlot-Dry-Blotting-System/iBlot-Dry-Blotting-Comparison-to-Semi-Dry-and-Wet.html. It utilizes an anode and cathode stack, which are comprised of a gel matrix that contains the appropriate transfer buffers, that act as ion reservoirs8. During the transfer, water electrolysis helps to prevent the generation of oxygen from the copper anode resulting in a more consistent protein transfer without causing band distortion8. Moreover, this transfer system also increases the transfer speed by reducing the distance between the electrodes8.
Although chemiluminescence is the most common and traditional technique for protein detection of Western blot analyses, two-color infrared fluorescent detection greatly improves the sensitivity, quality, and accuracy of Western blot data. This detection method uses infrared laser excitation in two optimal wavelengths, 700 nm and 800 nm, to generate a clear data image with the greatest signal-to-noise ratio and highest sensitivity9. Thus, two target proteins can be visualized simultaneously on the same membrane using the 700 nm and 800 nm fluorescent detection channels. More importantly, the linearity and dynamic range of infrared fluorescence allows for precise quantitative analysis of both strong and weak protein bands9. Furthermore, this protocol provides tremendous advantages and improvements over the classic Western blotting technique by decreasing the electrophoresis and transfer times of this experiment without compromising the efficacy of these processes and utilizing infrared fluorescent protein detection to produce greater qualitative and quantitative Western blot data.
1. Preparation of Whole Cell Lysates from Cell Culture
2. Sample Preparation and Electrophoresis
REAGENT | REDUCED SAMPLE |
Protein Sample | X μl |
4x LDS Sample Buffer | 6 μl |
500 nM DTT Reducing Agent | 2.4 μl |
Deionized Water | Up to 15.6 μl |
Total Volume | 24 μl |
3. Protein Transfer Using the iBlot Dry Blotting System
4. Infrared Fluorescent Protein Detection
Two-color infrared fluorescence detects both strong and weak bands on the same membrane with enhanced sensitivity and the highest signal-to-noise ratio to produce clear Western blot images. Typical results generated by two-color Western blot detection visualized in both the 700 nm and 800 nm fluorescent channels are exemplified in Figures 1 and 2. The uppermost Western blot in Figure 1 shows the concurrent (overlay) detection of total ERK1/2 in the 800 nm channel (green) and β-Actin in the 700 nm channel (red) of two-fold serial dilutions of lysates from the human-derived melanoma cell line, WM793. In addition, this membrane has also been cut into sections based on the molecular weights of the desired protein targets in order to allow for more than two antibodies to be examined on the same blot. For instance, the membrane analyzed in Figure 1 was cut in half in order to probe the lower portion of the membrane with a third antibody, total BIM (700 nm channel-red) without inferring with the detection of both total ERK1/2 and β-Actin. The first panel of Figure 2 further demonstrates the two-color Western blot fluorescent detection of phospho-ERK1/2 (800 nm channel-green) and total ERK1/2 (700 nm channel-red) with overlapping phospho-ERK and total ERK signals displayed in yellow of WM793 melanoma cells treated in the presence and absence of the MEK1/2 inhibitor, PD0325901 (MEKi), which suppresses the ERK1/2 MAP kinase signaling pathway. Moreover, the 700 nm and 800 nm fluorescent images can also be converted to the standard black and white Western blot images for each antibody (Figures 1 and 2). In general, the majority of Western blot images produced by this protocol will result in high-quality images as exhibited in Figures 1 and 2. However, depending on the selectivity, specificity, and quality of the primary antibody, less than optimal images can result in a small portion of blots analyzed by this methodology. For example, as observed in the bottom two panels of Figure 2, the subpar quality of the phospho-BIM antibody in the WM793 melanoma cells treated with and without MEK inhibition resulted in a Western blot image with faint protein bands and extremely high membrane background.
Simultaneous infrared fluorescent imaging of two targets can also provide the opportunity for quantitative analysis of Western blots over a broad, linear dynamic range by efficiently and accurately detecting both strong and weak bands on the same membrane. Quantification of protein bands are calculated as an integrated intensity, which is proportional to the amount of fluorescent-labeled antibodies on the membrane and is independent of both size of the shape drawn around the band and resolution. This is based on the following criteria: 1) area of the shape; 2) number of pixels enclosed in the shape; 3) average intensity of the pixels selected as the background and; 4) total intensity of the pixels enclosed in the given shape10. Figure 3A shows the protein quantification of the Western blots illustrated in Figure 1. Quantification of total ERK1/2, β-Actin, and total BIM exhibit a linear relationship between an increase in the integrated intensity of the fluorescent signal and the increase in protein concentration (Figure 3A). Moreover, Figure 3B is another example of how to quantify protein levels from fluorescent Western blots, which shows the protein quantification of phospho-ERK1/2 normalized to total ERK1/2 protein levels of WM793 melanoma cells treated with and without MEK inhibition from Figure 2. From this quantification, the phosphorylated ERK1/2 levels can be calculated as a percent of the control levels. In this case, phospho-ERK levels of melanoma cells treated with the MEK inhibitor were 0.6% of the control.
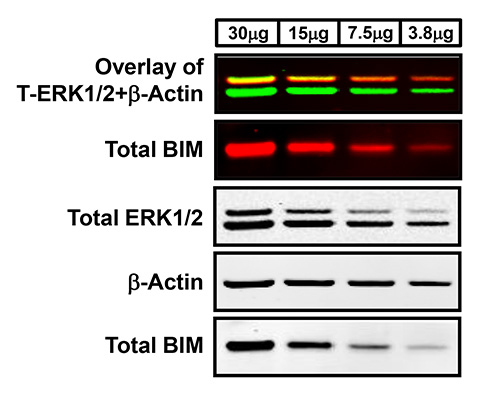
Figure 1. Western blot analysis using two-color infrared fluorescent protein detection. Lysates of two-fold serial dilutions of WM793 human-derived melanoma protein were separated using a NuPAGE Novex Bis-Tris gel with protein transferred onto PVDF membrane using the iBlot transfer apparatus. Membranes were blocked in Odyssey Blocking Buffer and probed with the following primary antibodies: rabbit anti-total ERK1/2, rabbit anti-total BIM, and mouse anti-β-Actin. Antigen-antibody complexes were detected using fluorescent goat anti-rabbit IRDye 800 (green) or 680 (red) and goat anti-mouse IRDye 680 (red) secondary antibodies, respectively, and visualized with the LI-COR Odyssey Classic Infrared Imaging System. The first Western blot panel is the overlay of the simultaneous detection of total ERK1/2 (800 nm channel-green) and β-Actin (700 nm channel-red) fluorescent signals. The second panel is the single-channel fluorescent detection of total BIM on the same membrane that was separated using a razor blade based on the molecular weights of these target proteins. The lower three Western blot panels are the black and white images of the separated single-channel fluorescent images.
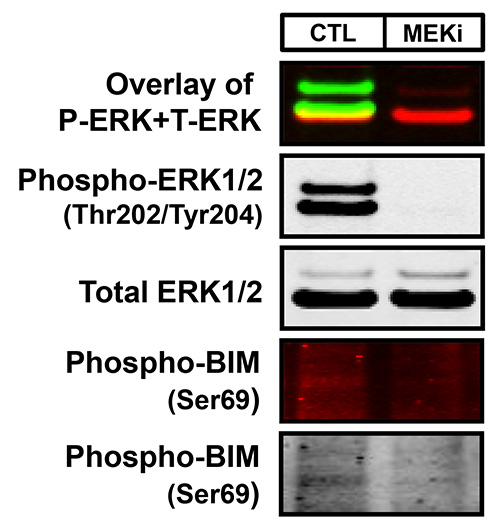
Figure 2. An example of both a high- and poor-quality Western blot image using infrared fluorescence. WM793 melanoma cells treated with either DMSO (CTL) or 2 μM of the MEK inhibitor, PD0325901 (MEKi), for 18 hr were analyzed as described in Figure 1. The membrane was probed with rabbit anti-phospho-ERK1/2 (Thr202/Tyr204), mouse anti-total ERK1/2, and mouse anti-phospho-BIM (Ser69) with antigen-antibody complexes detected with goat anti-rabbit IRDye 800 (green) and goat anti-mouse IRDye 680 (red). The first Western blot panel is the overlay of the simultaneous detection of both phospho-ERK1/2 (800 nm channel-green) and total ERK1/2 (700 nm channel-red) fluorescent signals. The second and third panels are the black and white images of the single-channel fluorescent images of phospho and total ERK1/2. The bottom two panels are the fluorescent and black and white images of phospho-BIM. These images represent an example of a subpar Western blot that can result with this method due to the substandard quality of the primary antibody.
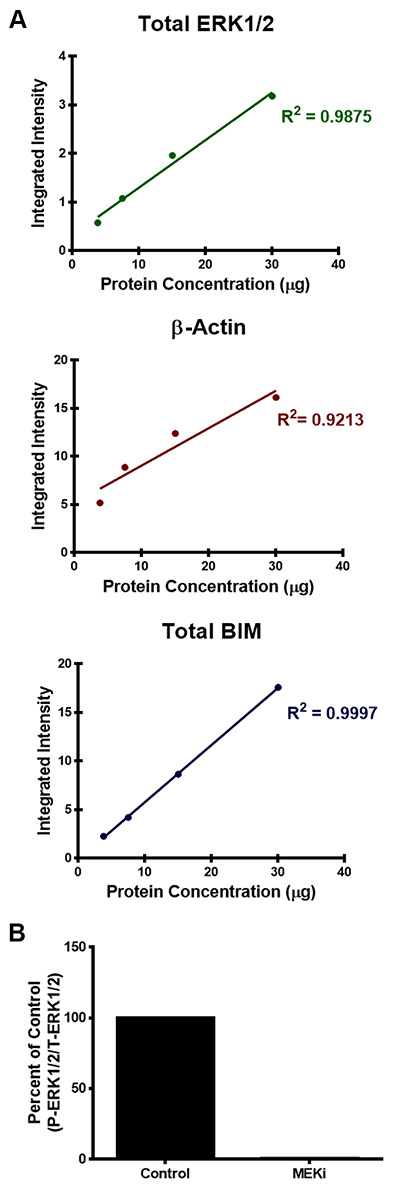
Figure 3. Examples of protein quantification of the infrared fluorescent Western blots. A) Quantification of total ERK1/2, β-Actin, and total BIM protein levels was determined by calculating the integrated intensity of each protein band. The integrated intensity is proportional to the amount of fluorescent-labeled secondary antibodies on the membrane. R-squared values were also used to evaluate the linear regression for each of the antibodies analyzed in Figure 1. B) Quantification of phospho-ERK1/2 normalized to total ERK1/2 protein levels from Figure 2 was calculated using the integrated intensity of the fluorescent signal and data is presented as a percent of the DMSO-control.
The critical steps in generating high-quality, quantitative Western blots according to this protocol are the following: 1) measuring protein concentrations; 2) sample preparation; 3) blocking the membrane and; 4) quality and caliber of the primary antibody.
The accuracy of measuring total protein concentrations can have a major impact on quantifying protein bands since the exceptional sensitivity of infrared fluorescent detection will amplify any slight differences found in the protein concentration of the samples. To avoid discrepancies in determining the protein concentration, generating a standard curve with a linear regression line or R-squared value as close to 1 as possible (R2≥0.99 or better) is important in the precise calculation of the protein concentration of each sample. For instance, if the R2 value falls below 0.99, preparing fresh BSA standards with ultrapure water and carefully repeating the protein quantification assay may help to increase the R2 value. It is also best to avoid using a multichannel pipettor as this will generate inconsistencies in pipetting that may contribute to reduced R2 values and inaccuracies in the protein concentrations of the samples.
Sample preparation plays a significant role in determining the quality of the protein bands, which can also have a direct affect on the quantification of these bands. When using the Bis-Tris gel system, it is highly recommended that samples are prepared with LDS Sample Buffer because the slightly alkaline pH (8.5) of this buffer provides the optimal condition for the reduction of disulfide bonds and denaturation4. This sample buffer also contains a Coomassie G250 tracking dye that produces a sharp dye front that migrates with the moving ion front, which helps to ensure that small peptides do not run off the gel4. More importantly, the LDS Sample Buffer minimizes the cleavage of aspartyl-prolyl peptide bonds when samples are heated at 70 °C due to the pH of the buffer changing from 8.5-8.04. This results in an ideal environment for the reduction and alkylation of proteins while also preserving the integrity of the protein. However, if a Tris-Glycine SDS Sample Buffer is used instead of the LDS Sample Buffer, this will lead to the cleavage of the aspartyl-prolyl bonds, a decrease in the sharpness of the protein bands, and an increase protein fragmentation4. It is also pertinent to add the Antioxidant to the Upper Buffer Chamber of the Mini-Cell electrophoresis unit. Since the Antioxidant is able to comigrate with the samples at neutral pH in the Bis-Tris gel system, this can help maintain proteins in a reduced state and protect disulfide bonds as well as sensitive amino acids against oxidation, whereas the absence of the Antioxidant can lead to diffused protein bands4. Lastly, it is highly recommended to use either MES or MOPS Running Buffer with Bis-Tris gels as opposed to using Tris-Glycine SDS Running Buffer with these types of gels. The combination of Tris-Glycine SDS Running Buffer and Bis-Tris gels results in the slow migration of glycine ions causing a dramatic increase in the electrophoresis run time with bands appearing more compressed and cup-shaped4.
The blocking step is also crucial for producing high-quality Western blot images using fluorescent detection as many of the various blocking agents can generate high membrane background. For infrared fluorescent detection, it is best to use the Odyssey Blocking Buffer because this specific blocking agent increases the sensitivity of protein detection while maintaining low background. Although nonfat dry milk, casein, or BSA could also be used as alternative blocking agents, these types of solutions can cause higher membrane background and in some cases a decrease in the binding affinity of the primary antibody10. In addition, milk-based blockers may contain IgG that can cross-react with phospho-epitopes and anti-goat antibodies, which could interfere with the accuracy of protein detection and proper antibody binding9,11. However, if a Western blot image is plagued by high background, nonspecific bands, or weak/no signal, then utilizing one of these alternative blocking agents may help to improve the quality of the image. Moreover, it is also recommended to avoid adding detergent to the blocking step and long blocking incubations as this may lead to an increase in background and/or loss of the target protein from the membrane9,12 .
Simultaneously detecting two different antigens on the same blot using infrared antibodies labeled with a 700 nm and 800 nm channel dye requires prudent selection of both the primary and secondary antibodies. The two primary antibodies must be derived from different host species. For instance, if one primary antibody is derived from rabbit, then the second primary antibody needs to be derived from a different species other than rabbit, such as mouse. Similarly, the infrared secondary antibodies also need to be derived from the same host species as each of the primary antibodies and labeled with different fluorophores. For example, a goat anti-rabbit in the 800 nm channel can be combined with a goat anti-mouse in the 700nm channel in order to accurately observe the protein signal from two different primary antibodies that are derived from rabbit and mouse.
Primary antibodies vary considerably in their quality, affinity, and sensitivity for their antigen. This can result in a significant reduction in signal or an increase in the nonspecific binding of proteins to the membrane thereby creating difficulties in accurately visualizing the target protein. Thus, by using an alternative blocking solution, such as nonfat dry milk or casein dissolved in PBS, may help to improve the protein detection with poor-quality primary antibodies10. In addition, the detergent concentration can also affect the binding of the primary antibody to the target antigen and precaution should be considered when determining the concentration of detergent in order to avoid washing away the antibody. A low concentration of SDS (0.01-0.02%) can reduce background and nonspecific binding when added to the diluted secondary antibody, especially when using PVDF membrane10. However, SDS can also disrupt antigen-antibody binding leading to a severe reduction in signal strength.
Furthermore, the novel modifications described in this protocol exemplifies a modern approach to the traditional Western blotting technique. These cutting-edge advancements drastically improve the efficacy, consistency, and sensitivity of Western data and allows for the accurate quantification of multiple target proteins on the same membrane regardless of their signal strength. More importantly, these valuable alterations also significantly reduce the experimental time of performing a Western blot while producing high qualitative and quantitative data.
The authors have nothing to disclose.
We would like to thank all the members of the McMahon laboratory for their assistance and support. This research was supported by grants from an NIH/NCI R01 CA176839-01 (to MM) and an Institutional Research and Academic Career Development Award (IRACDA to JS).
BCA Protein Assay Kit | Thermo Scientific/Pierce | 23225 |
4x NuPAGE® LDS Sample Buffer | Invitrogen/Life Technologies | NP0007 |
10x NuPAGE® Sample Reducing Agent | Invitrogen/Life Technologies | NP0004 |
20x NuPAGE® MES SDS Running Buffer | Invitrogen/Life Technologies | NP0002 |
20x NuPAGE® MOPS SDS Running Buffer | Invitrogen/Life Technologies | NP0001 |
NuPAGE® Antioxidant | Invitrogen/Life Technologies | NP0005 |
NuPAGE® Novex® 4-12% Bis-Tris Gel 1.5 mm, 10 well | Invitrogen/Life Technologies | NP0335BOX |
NuPAGE® Novex® 4-12% Bis-Tris Gel 1.5 mm, 15 well | Invitrogen/Life Technologies | NP0336BOX |
SeeBlue® Plus2 Pre-Stained Standard | Invitrogen/Life Technologies | LC5925 |
XCell SureLock® Mini-Cell | Invitrogen/Life Technologies | EI0001 |
iBlot® Transfer Stack, PVDF Regular | Invitrogen/Life Technologies | IB4010-01 |
iBlot®Transfer Stack, PVDF Mini | Invitrogen/Life Technologies | IB4010-02 |
iBlot® Transfer Stack, Nitrocellulose Regular | Invitrogen/Life Technologies | IB3010-01 |
iBlot®Transfer Stack, Nitrocellulose Mini | Invitrogen/Life Technologies | IB3010-02 |
iBlot® Gel Transfer Device | Invitrogen/Life Technologies | IB1001 |
β-Actin | Sigma | A2228 |
Phospho-BIM (S69) | BD Biosciences | N/A |
Total BIM | Epitomics | 1036-1 |
Phospho-ERK1/2 (T202/Y204) | Cell Signaling Technology | 4370 |
Total ERK1/2 | Cell Signaling Technology | 9107 |
Odyssey® Blocking Buffer | LI-COR Biosciences | 927-40000 |
IRDye 800CW Goat anti-Rabbit IgG | LI-COR Biosciences | 926-32211 |
IRDye 680LT Goat anti-Mouse IgG | LI-COR Biosciences | 926-68020 |
Western Incubation Box, Medium | LI-COR Biosciences | 929-97205 |
Odyssey® Classic Imaging System | LI-COR Biosciences | N/A |
Odyssey® Application Software V3.0.30 | LI-COR Biosciences | N/A |