1. EML Cell Culture and Separation of Lin-CD34+ and Lin-CD34- Cells Using Magnetic Cell Sorting System and Fluorescence-activated Cell Sorting Method
- Preparation of baby hamster kidney (BHK) cell culture medium for stem cell factor collection:
- Culture BHK cells in DMEM medium containing 10% FBS in 25 cm2 flask (Table 1) at 37 °C, 5% CO2 in a cell culture incubator.
- When cells grow to 80 – 90% confluence, wash cells once with 10 ml of PBS. Add 5 ml of 0.25% trypsin-EDTA solution to the monolayer and incubate the cells for 1-5 min at room temperature (RT) until the cells are detached.
- Pipet the solution up and down gently to break up clumps of cells. Add 5 ml of complete DMEM to the flask to stop trypsin activity. Collect cells by centrifugation at 200 x g for 5 min at RT.
- Remove the medium and resuspend the cell pellet in 10 ml of fresh BHK cell culture medium.
- Transfer 2 ml of the cell suspension from the step 1.1.4 to a new 75 cm2 flask and add 48 ml of fresh BHK cell culture medium to the flask.
- Culture the BHK cells for two days and collect the culture medium. Passage the medium through a 0.45 μm filter. Store the medium in -20 °C until further use.
- EML cell culture:
- Culture EML cells (in suspension) in EML basic medium containing BHK cell culture medium (Table 1) at 37 °C, 5% CO2 in a cell culture incubator.
- Maintain the EML cells at low cell density (0.5-5 x 10⁵ cells/ml) with the peak density less than 6 x 10⁵ cells/ml. Split the cells every 2-3 days at the ratio of 1:5. Passage EML cells gently and discard the culture after passaging for 10 generations.
- Depletion of lineage positive cells:
- Harvest the EML cells by centrifugation at 200 x g for 5 min and wash the cells once with PBS. Collect the cells by centrifugation at 200 x g for 5 min.
- Resuspend the cells with PBS and count the cells with a hemocytometer. Determine the antibody concentration in the subsequent cell separation step according to the number of the cells (please refer to the instructions offered by the provider of the cell isolation system).
- Isolate the lineage negative (Lin-) cells using lineage antibody cocktail (cocktail of biotin-conjugated monoclonal antibodies CD5, CD45R (B220), CD11b, Anti-Gr-1(Ly-6G/C), 7-4 and Ter-119) and a magnetic activated cell sorting system according to manufacturer’s instructions.
- Separation of Lin-CD34+ and Lin-CD34- cells:
- Spin down the Lin- cells from the step 1.3.3 at 200 x g for 5 min. Resuspend the cell pellet with PBS and count the cells with a hemocytometer.
- Wash the cells twice with FACS buffer and pellet the cells at 200 x g for 5 min.
- Label five 1.5 ml microcentrifuge tubes with the number 1, 2, 3, 4, 5 respectively. Resuspend the cells with 100 µl FACS buffer per 106 cells (106 cells per tube).
- Add 1 µg of Anti-Mouse CD34 FITC antibody to tube 1 and tube 2 and mix the tubes gently.
- Incubate all tubes at 4 °C for 1 hr in the dark.
- Add 0.25 µg of PE-conjugated Anti-Sca1 antibody and 20 µl of APC-conjugated Lineage Cocktail antibodies to tube 1, 0.25 µg of PE-conjugated Anti-Sca1 antibody to tube 3, and 20 µl of APC-conjugated Lineage Cocktail antibodies to tube 4.
- Mix all the tubes gently and incubate the cells at 4 °C for an additional 30 min in the dark.
- Add 300 µl of FACS buffer to the cells and spin down the cells at 200 x g for 5 min.
- Wash the cells with 500 µl of FACS buffer for three times.
- Resuspend the cell pellet in 500 µl of FACS buffer.
- Use the cells in tubes 2, 3, 4, and 5 for setting up compensation. Isolate Lin-SCA+CD34+ and Lin-SCA-CD34- cells in tube 1 using FACS Aria.
2. RNA Preparation and Library Construction for High-throughput Sequencing
- Isolation, quality analysis and quantification of RNA:
- Extract total RNA from Lin-CD34+ and Lin-CD34- cells respectively using TRIzol following the manufactures’ protocol.
- Remove the contaminated DNA using deoxyribonuclease I (DNase I) following the manufacture’s protocol. Optionally, store the RNA at -80 °C at this step for further use.
- Assess the quality of total RNA using Bioanalyzer according to the instructions offered by the supplier. Use RNA sample with RNA Integrity Number (RIN) lager than 9.
- Library Construction and high-throughput sequencing:
NOTE: This protocol describes RNA-Seq using Illumina platform. For other sequencing platforms, different library preparation methods are required.- Use 0.1-4 µg of high quality total RNA per sample for library preparation. Normally 2 µg of total RNA can be extracted from 105 EML cells.
- Use a RNA-sequencing sample preparation system for RNA purification and fragmentation, first and second strand cDNA synthesis, end repair, 3’ ends adenylation, adapter ligation and PCR amplification, following the detailed standard procedures from the provider’s instructions.
- Positively select PolyA mRNA using oligo-dT magnetic beads and fragment the mRNA.
- Perform reverse transcription using random primers to obtain the cDNA and subsequently synthesize the second strand of cDNA to generate double stranded cDNA.
- Remove the 3' overhangs and fill the 5' overhangs by DNA polymerase. Adenylate 3' ends to prevent cDNA fragments from ligating to one another.
- Add multiplex indexing adapters to both ends of the dscDNA. Perform PCR for the enrichment of DNA fragments.
- Measure the A260/A280 to obtain information about the concentration of library using a spectrophotometer.
- Assess the library quality and measure the size range of DNA fragments using a Bioanalyzer.
3. Data Analysis
For reference of software used in this part, please see (Table 2).
- Data file processing for downstream analysis:
- Convert .bcl (base call file) file to .fastq file using CASAVA software (Illumina, version 1.8.2).
- Fire up the ‘Terminal’ in Linux system. Go to the data folder that contains the data file from an Illumina HiSeq2000 sequencing machine. Suppose the result folder is ‘NASboy1/JiaqianLabData/HiSeq_RUN/2013_07_11/130627_SN860_0309_A_2013-166_H0PW9ADXX/’, type in the command in Figure S1A, and enter the data folder.
- Install CASAVA 1.8.2 in the Linux system. Suppose the outputfolder is ‘Unaligned’, use the command in Figure S1B to prepare the configuration file for converting. Use the option –fastq-cluster-count 0 to ensure only one .fastq file is created for each sample. The generated .fastq file is in .gz format. Unzip it for downstream analysis (Figure S1B).
- After the ‘Unaligned’ folder has been generated, go to the ‘Unaligned’ folder (Figure S1C).
- Use the command in Figure S1D to begin the converting process. The ‘-j’ parameter supplies the cpu number that will be used.
- After the system finished the converting process, go to the result folder under ‘Unaligned’ folder (Figure S1E).
- Use the command in Figure S1F to decompress the .fastq.gz file into .fastq file under each sample folder.
- Convert .bcl (base call file) file to .fastq file using CASAVA software (Illumina, version 1.8.2).
- Detect novel transcripts and evaluate the expression level using Tuxedo Suite26:
- Map the paired-end RNA-Seq reads to the mouse reference genome (UCSC version mm9, obtained from http://cufflinks.cbcb.umd.edu/igenomes.html) using Tophat software (version 1.3.3)27, which uses the Bowtie read mapper (version 0.12.7)28. Tophat is supplied with “-no-novel-juncs” option to improve estimation accuracy of expression level.
- Put the .fastq files in a folder where the mapping process will be implemented. Suppose there are 2 .fastq files (rename to Example1.read1, Example1.read2) for a paired-end sequencing sample, use the command in Figure S2 to do the mapping (adjust the parameters according to the system setting). The “-p” parameter supplies the cpu number that will be used. The “–r” and “–mate-std-dev” parameters can be obtained from library QC or inferred from a subset of aligned reads (Figure S2).
- Assemble the mapped reads into RNA transcripts using the Cufflinks software (version 1.3.0)29. Run Cufflinks using the annotation file of known genes (same .gtf file used by Tophat) and .bam file produced by Tophat.
- After Tophat finished running, in the same folder, use the command in Figure S3A to run cufflinks to construct transcriptome and estimate transcript expression level. The ‘mm9_repeatMasker.gtf’ and genome sequence files in the ‘GenomeSeqMM9’ folder can be obtained from UCSC Genome Browser.
- The resulting genes.expr and transcripts.expr files contain the expression value of genes and transcripts (isoforms). Copy and paste the file contents to an Excel file and manipulate with spreadsheet application (Figure S3B).
- Use the command in Figure S3C to compare the resulting ‘transcripts.gtf’ file to the reference ‘mm9_genes.gtf’ file in order to identify novel transcripts.
- The resulting .tmap file contains the comparison result. Copy and paste the file contents to an Excel file and manipulate with spreadsheet application. Transcripts with class code ‘u’ can be considered as ‘novel’ compared to the reference .gtf file provided (Figure S3D).
NOTE: For downstream analysis convenience, set the FPKM values to 0.1 if the values are under 0.1.
NOTE: Step 3.2.3 – 3.2.6 is optional for those who wish to improve accuracy of novel transcripts’ expression estimation. This will take a much longer time, because mapping and transcriptome construction need to be run more than once.
- Run Tophat using default parameters and then run cufflinks to generated .gtf file using the command in Figure S3E.
- Compare the resulting .gtf file to the reference genome .gtf file using the command in Figure S3F.
- Parse the resulted .tmap file as described in the step 3.2.2.4. Copy and paste the file contents to an Excel file and manipulate with spreadsheet application. Transcripts with class code ‘u’ can be considered as ‘novel’ compared to the reference .gtf file provided.
- After the step 3.2.5, there is a .combined.gtf file in the folder which can be used as the reference .gtf file. A second run of Tophat and cufflinks can be performed as described in the step 3.2.1 and 3.2.2 to obtain a more accurate FPKM estimation of novel transcripts.
- Map the paired-end RNA-Seq reads to the mouse reference genome (UCSC version mm9, obtained from http://cufflinks.cbcb.umd.edu/igenomes.html) using Tophat software (version 1.3.3)27, which uses the Bowtie read mapper (version 0.12.7)28. Tophat is supplied with “-no-novel-juncs” option to improve estimation accuracy of expression level.
- Detect differentially expressed genes using DESeq package30.
- The input of DESeq is a raw read counts table. To obtain such a table, use the htseq-count script distributed with the HTSeq Python package which can be downloaded from HTSeq website (http://www-huber.embl.de/users/anders/HTSeq/doc/count.html).
- Ensure that samtools, python, and htseq-count programsare installed in the system. Obtain raw read count numbers from tophat output by using the command in Figure S4A.
- Prepare ‘Raw_Count_Table.txt’, ‘ExperimentDesign.txt’ files using Excel. Copy and save the content in .txt format for the DESeq R package (Figure S4B).
- Install R program in the system. In the terminal, type ‘R’ and press ENTER.A screen message will appearas showed in Figure S4C.
- Read ‘Raw_Count_Table.txt’, ‘ExperimentDesign.txt’ into R using the command in Figure S4D.
- Load DESeq package using the command in Figure S4E.
- Factorize conditions in R (Figure S4F).
- Use the command in Figure S4G to run negative binominal test on the normalized count table.
- Use the command in Figure S4H to output significant differential expressed genes in a .csv file.
- The input of DESeq is a raw read counts table. To obtain such a table, use the htseq-count script distributed with the HTSeq Python package which can be downloaded from HTSeq website (http://www-huber.embl.de/users/anders/HTSeq/doc/count.html).
- Lookup transcription factors’ (TFs) FPKM values across samples using Excel. Intersect DE gene table and TFs table. Genes belong to both table are differentially expressed transcription factors.
- Go to the website http://www.bioguo.org/AnimalTFDB/download.php and download the transcription factors. Then lookup the DE transcription factors in the Excel (Figure S5).
- Generating .bigwig file for UCSC genome browser visualization.
- Download ‘bedtools’ software package from the website https://github.com/arq5x/bedtools2 and install the software in the system31. Download the UCSC tools ‘bedGraphToBigWig’ from the website http://hgdownload.cse.ucsc.edu/admin/exe/ and install the software in the system.
- In the folder containing the .bam file, use the command in Figure S6A to convert .bam file generated by tophat into .bed file.
- After the .bed file is produced, use the command in Figure S6B to generate .bigwig file. The file ‘ChromInfo.txt’ can be obtained from following url: http://hgdownload.cse.ucsc.edu/goldenPath/mm9/database/chromInfo.txt.gz.
- Observe a custom track on UCSC Genome Browser. Refer to the website http://genome.ucsc.edu/goldenPath/help/customTrack.html on how to display a custom track using UCSC genome browser.

Figure S1: Converting .bcl file to .fastq file using CASAVA software.

Figure S2: Mapping reads to reference genome using Tophat.

Figure S3: Detection of novel transcripts and expression level estimation.
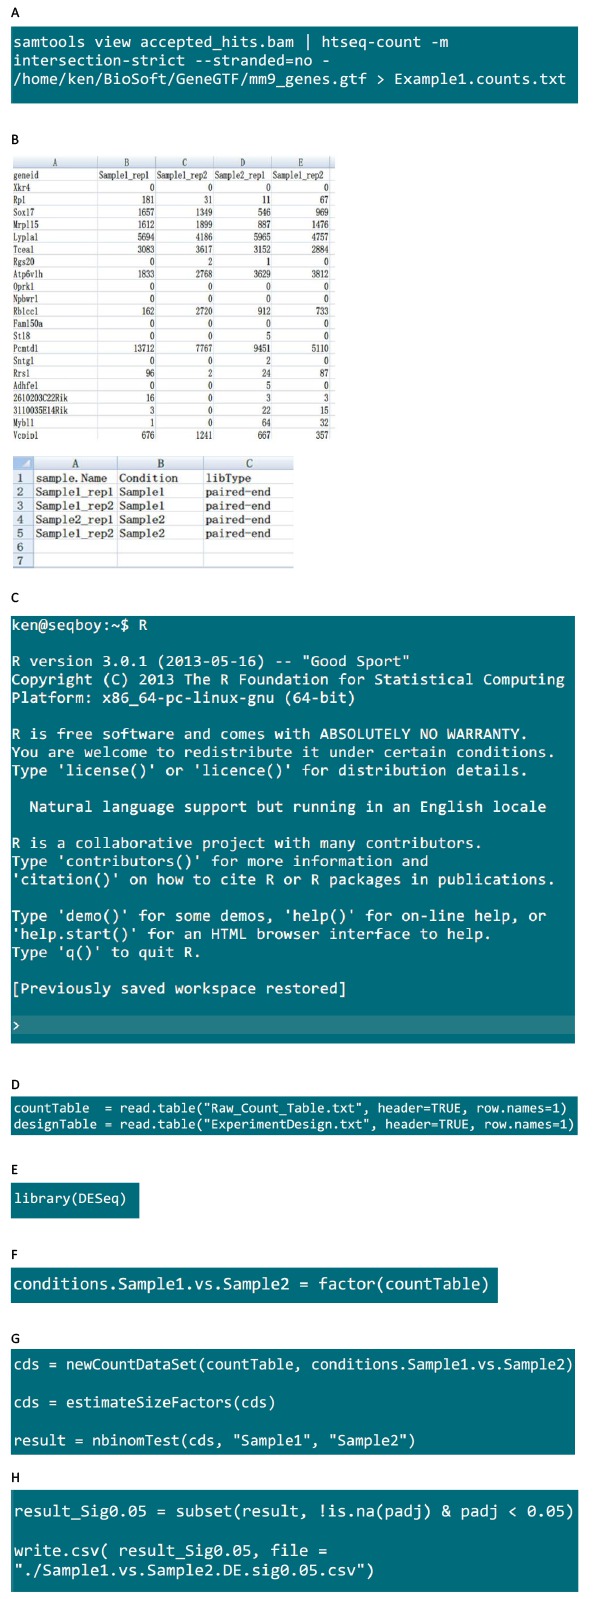
Figure S4: Calling differential expressed gene using DESeq package.

Figure S5: Identification of differentially expressed transcription factors.

Figure S6: Converting mapping result for data visualization.
In order to analyze differentially expressed genes in Lin-CD34+ and Lin-CD34- EML cells, we used RNA-Seq technology. Figure 1 shows the workflow of the procedures. After isolation of lineage negative cells by magnetic cell sorting, we separated Lin-SCA+CD34+ and Lin-SCA-CD34- cells using FACS Aria. Lin-enriched EML cells were stained with anti-CD34, anti-Sca1 and lineage cocktail antibodies. Only Lin- cells were gated for analysis of Sca1 and CD34 expression. Two populations (SCA+CD34+ and SCA-CD34- EML cells) could be observed by FACS analysis (Figure 2)6.
After cell separation, we extracted total RNA from CD34+ and CD34- cells respectively and analyzed the quality of RNA. The accuracy of RNA-Seq data largely relies on the quality of RNA-Seq library and the quality of total RNA is vital for preparing a high quality library. High quality RNA sample should have an OD 260/280 value between 1.8 and 2.0. In addition to using the spectrophotometer, RNA quality was further assessed with greater accuracy by Bioanalyzer. Figure 3 shows a result of a high quality RNA sample with the RIN equal to 9.4. Only high quality total RNA sample with RIN value greater than 9 was used for mRNA extraction and subsequent library construction procedures.
Ribosomal RNA is the most abundant type of RNA in cell. Currently two main strategies, depletion of rRNA or positively selection of polyadenylated mRNA (poly-A mRNA), are used for enrichment of target RNA before library construction. Non polyadenylated RNA species are lost during the selection of poly-A mRNA. In contrast, rRNA depletion methods such as RiboMinus could preserve non polyadenylated RNA species. The purpose of our study is to look for differentially expressed coding genes in two cell types, thus we used the poly-A mRNA selection method for enrichment of target RNAs before library construction. When library construction was finished, the size of DNA fragments in the library was checked before sequencing using Bioanalyzer. Figure 4 shows a good quality library with the fragment size peaks at about 300 bp.
In the subsequent step, the library was subjected to high-throughput sequencing. In principle, longer read length will be helpful for read mapping. It can reduce the probability that the read is mapped to multiple locations due to similarity among duplicate genes or gene family members. As the pair-end sequencing sequences are from both ends of the fragments, the read length chosen should be less than half of the average fragments length. If the main goal of the experiment is to measure the expression level instead of constructing transcript structure, single-end read (75 or 100 bp) can reduce the cost without losing too much information. Paired-end sequencing is more useful for transcript structure construction and shorter read length can be used to reduce cost. Certainly, when sufficient funding is available, longer read length is preferred.
For differential expression analysis, there are many alternative algorithms other than DESeq. There is also one included in cufflinks package named cuffdiff32. DESeq is one of the most widely used count based DE gene analysis algorithms. DESeq method is based on a well characterized statistics model — negative binomial distribution. In our experience, DESeq is more stable compare to cuffdiff. Early versions of cuffdiff often give significantly different numbers of DE genes. Therefore we used DESeq for DE analysis here.
Because transcription factors are crucial for cell fate determination, we focused on the significantly differentially expressed transcription factors33. The TFs changed >1.5 fold between Lin-CD34+ and Lin-CD34- were found and are shown on the heatmap (Figure 5)2. Notably, the relative expression level of Tcf7 in Lin-CD34+ cells is more than 100 fold higher than that in Lin-CD34- cells. Thus Tcf7 was chosen for further ChIP-Sequencing (Chromatin Immunoprecipitation and sequencing) analysis and functional test to confirm Tcf7’s function in regulation of EML cell self-renewal and differentiation2.

Figure 1: Workflow of the procedures. Lin-CD34+ and Lin-CD34- cells were separated by magnetic cell separation system and fluorescence-activated cell sorting method. Total RNA was extracted followed by mRNA purification and library construction. After analysis of library quality, samples were subjected to high throughput sequencing. Data were analyzed and differentially expressed transcription factors were identified.

Figure 2: Separation of Lin-CD34+ and Lin-CD34- EML cells6. Lin- EML cells were enriched by magnetic cell sorting. Lin- cells were stained with anti-CD34, anti-Sca1 and lineage mixture antibodies. Lin- cells were gated for expression of CD34 and Sca1. Lin-CD34+SCA+ and Lin-CD34-SCA- EML cell populations were sorted.

Figure 3: A representative of high-quality total RNA sample. The quality of total RNA was assessed by Bioanalyzer. The RNA Integrity Number is 9.4 (FU, Fluorescence Units).

Figure 4: Fragments size range of Paired-End library. The DNA size distribution of the library was analyzed using Bioanalyzer. Most fragments are within the size range of 250-500 bp.

Figure 5: Differentially expressed transcription factors (>1.5 fold) between Lin-CD34+ cells and Lin-CD34- cells2. For each cell type, two independent experiments were performed. Up-regulated genes are indicated as red color and down-regulated genes are indicated as green color.
| BHK medium | |
| 100x Antibiotic-Antimycotic | 10 ml |
| 200 mM L-Glutamine | 10 ml |
| FBS | 100 ml |
| DMEM | 880 ml |
| Total volume | 1,000 ml |
| EML Basic medium | |
| IMDM | 390 ml |
| HI horse serum | 100 ml |
| 100 x Penicillin-Streptomycin | 5 ml |
| 200 mM L-Glutamine | 5 ml |
| BHK medium | 75 ml |
| Total Volume | 575 ml |
| Filtrate through 0.45 μM filter | |
| FACS buffer | |
| BSA | 0.50% |
| EDTA | 1 mM |
| Dissolved in PBS and filtrate through 0.45 μM filter | |
Table 1: Buffers and Cell culture mediums.
| Software | Usage | Reference |
| Bowtie 1.2.7 | Used by Tophat for mapping | [28] |
| Tophat 1.3.3 | Mapping reads back to reference genome | [27] |
| Cufflinks 1.3.0 | Transcripts construction and expression level estimation | [29] |
| DESeq 1.16.0 | Differential expression analysis | [30] |
| Bedtools 2.18 | Convert .bam file into .bed file | [31] |
| bedGraphToBigWig | Convert .bed file to .bigwig file | http://genome.ucsc.edu/ |
Table 2: List of software for data analysis.
