Microglia activation and microgliosis are key responses to chronic neurodegeneration. Here, we present methods for in vivo, long-term visualization of retinal CX3CR1-GFP+ microglial cells by confocal ophthalmoscopy, and for threshold and morphometric analyses to identify and quantify their activation. We monitor microglial changes during early stages of age-related glaucoma.
Microglia, which are CNS-resident neuroimmune cells, transform their morphology and size in response to CNS damage, switching to an activated state with distinct functions and gene expression profiles. The roles of microglial activation in health, injury and disease remain incompletely understood due to their dynamic and complex regulation in response to changes in their microenvironment. Thus, it is critical to non-invasively monitor and analyze changes in microglial activation over time in the intact organism. In vivo studies of microglial activation have been delayed by technical limitations to tracking microglial behavior without altering the CNS environment. This has been particularly challenging during chronic neurodegeneration, where long-term changes must be tracked. The retina, a CNS organ amenable to non-invasive live imaging, offers a powerful system to visualize and characterize the dynamics of microglia activation during chronic disorders.
This protocol outlines methods for long-term, in vivo imaging of retinal microglia, using confocal ophthalmoscopy (cSLO) and CX3CR1GFP/+ reporter mice, to visualize microglia with cellular resolution. Also, we describe methods to quantify monthly changes in cell activation and density in large cell subsets (200-300 cells per retina). We confirm the use of somal area as a useful metric for live tracking of microglial activation in the retina by applying automated threshold-based morphometric analysis of in vivo images. We use these live image acquisition and analyses strategies to monitor the dynamic changes in microglial activation and microgliosis during early stages of retinal neurodegeneration in a mouse model of chronic glaucoma. This approach should be useful to investigate the contributions of microglia to neuronal and axonal decline in chronic CNS disorders that affect the retina and optic nerve.
Microglia are neuroimmune cells that exclusively reside in the central nervous system (CNS) since early embryonic development and throughout adulthood. Equipped with a complex repertoire of receptors, microglial activity and regional heterogeneity are regulated by their bidirectional interplay with neighboring neurons, glia, blood-brain barrier and infiltrating neuroinflammatory cells1,2. Basal microglial functions contribute to physiological maintenance and repair, as they sample their territory for perturbations in homeostasis3,4. During CNS injury or disease, microglia are the first responders to neuronal signals that then trigger their transition to a reactive phenotype, termed “activated microglia2,5-7. Microglia activation involves an intricate cycle of gene and protein expression, which are coupled to cell soma and process resizing and remodeling6-9. Microglia activation, as well as cell redistribution and clustering, can be accompanied the local overall increase in the number of cells (termed microgliosis). This can result from cell proliferation and self-renewal, with or without recruitment of blood-derived monocytes3,4,7,10-14. In a broad range of age-dependent, chronic CNS diseases, sustained microgliosis and microglia activation parallel disease progression15-19. How microglia impact neurodegeneration remains unclear, mainly because they play both neuroprotective and deleterious roles that may have diverse contributions to disease onset and progression. Live imaging studies aimed at understanding chronic CNS disease have monitored microglial behavior in the damaged CNS of animal models and humans, and demonstrated that microglial alterations are detectable beginning at early disease stages15-17,19,20. Thus, it is critical to develop approaches to detect and monitor microglial activation in vivo.
Non-invasive detection of regional changes in brain microglia activation was established as an important in vivo indicator of neurodegenerative disease progression, using molecular imaging or bioluminescence and positron emission tomography or magnetic resonance imaging18,21,22. These highly quantitative and non-invasive molecular and nuclear imaging methods detect gliosis with regional resolution. Alternatively, two-photon confocal imaging in CX3CR1GFP/+ mice has allowed the observation of brain microglia with cellular resolution3,4,9,20,23-28. However, this approach limits long-term and repeated observation of chronic microglial alterations, given the potential risk of disturbing their behavior by even minimally invasive brain imaging procedures29. Alternatively, the retina offers optimal conditions for direct, in vivo visualization and repeated monitoring of microglia in their intact CNS niche throughout aging, following acute injury, and potentially during chronic neurodegenerative diseases. Thus, recent studies have proved the feasibility of high-resolution imaging of retinal microglia expressing GFP by adapting the confocal scanning laser ophthalmoscopy (cSLO) to image live CX3CR1GFP/+ mice. This has been used to track weekly changes in GFP+ cell numbers in individual mice for up to 10 weeks following acutely induced injury or ocular hypertension30-36.
We have extended this approach to perform long-term imaging over several months, and quantitatively track changes in microglia activation based on soma size using morphometric analysis. Somal size was defined as a useful metric of microglia activation in live imaging studies using two-photon confocal microscopy in cortical slices to perform in vivo imaging of CX3CR1-GFP+ microglia9. These and other studies also demonstrated the correlation between somal size and levels of Iba1 protein expression, which also increases with activation9,37. Thus, activated microglia can be identified in live mice, and their numbers and distribution monitored over time during CNS health and disease.
This protocol describes methods for cSLO live image acquisition and analysis to monitor microglial cell numbers, distribution and morphological activation during retinal ganglion cell (RGC) degeneration (Figure 1). Thus, this study uses: 1) a mouse model of inherited glaucoma (DBA/2J) that undergoes age-dependent optic nerve and retinal neurodegeneration and shows remarkable variability in disease progression between 5 and 10 months of age38,39, 2) monthly cSLO in vivo imaging for long-term visualization of GFP+ cells in the retina and unmyelinated optic nerve of heterozygous Cx3cr1GFP/+ DBA/2J mice aged 3-5 months, 3) live imaging analysis by segmentation and thresholding to isolate cell somata and measure their area. These strategies are applied to assess the kinetics of retinal microglial activation states during early stages of chronic glaucoma.
In vivo imaging is performed in pathogen-free facilities using protocols approved by the Institutional Animal Care and Use Committee at the University of Utah.
NOTE: This imaging protocol is used for reporter mice in which retinal microglia and infiltrating monocytes/macrophages express green-fluorescent protein (GFP) under the control of the fractalkine receptor locus (CX3CR1).
1. In Vivo Imaging of Retinal GFP+ Microglia by Confocal Scanning Laser Ophthalmoscopy (cSLO)
2. Live Image Processing and Analysis
Our recent in vivo studies used these live image acquisition and analysis methods to visualize and track the kinetics and patterns of ONH and retinal microglial changes during early stages of chronic glaucoma and their relationship to late neurodegeneration59. Here we illustrate a cSLO image acquisition protocol to visualize microglial cells across a large area of the central retina in individual young heterozygous Cx3CR1-GFP DBA/2J retinas (Figure 5). Based on the high cell resolution, we apply live image thresholding and morphometric analyses that allow the automatic segmentation of individual GFP+ cells and somata (Figure 6).
To monitor the development of local microgliosis and/or microglia activation at ages preceding detectable neurodegeneration in this model of chronic glaucoma, we measured monthly variations of total microglia cell density in individual young heterozygous Cx3CR1-GFP DBA/2J retinas (n = 10) between 3-5 months of age (Figure 7A). Consistent with the variable progression of neurodegeneration in individual eyes41-44, our analysis reveals variable levels of retinal microglia activation and microgliosis across eyes at each age (Figure 7B), and detects dynamic changes in the density of total and activated microglia within individual retinas (Figure 7C). Noticeably, numbers of activated microglia are uncoupled from concurrent changes in total GFP+ cell density. These in vivo findings confirm previous ex vivo analysis of microglial changes in DBA/2J mice45. Thus cSLO live detection and measurement of retinal microglial activation may serve as indicators of early disease progression within individual eyes, and may potentially be linked to initiating events of glaucoma pathogenesis.
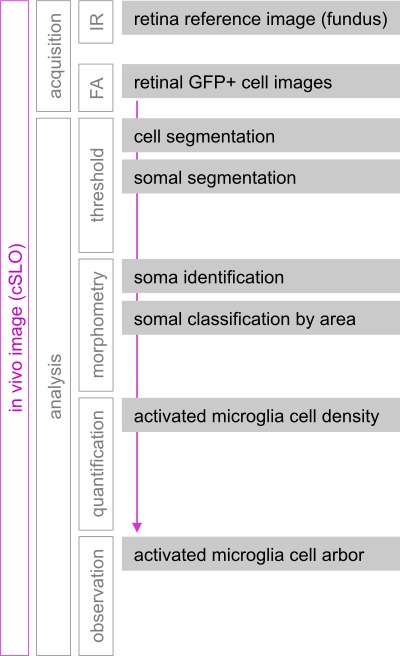
Figure 1: Live image acquisition, processing and analysis workflow. cSLO was used to image hundreds of GFP+ microglial/peripheral monocyte cells localized to the central ~1.7 mm2 of the mouse inner retina. Fluorescence images (FA) were acquired monthly for the same mice, and aligned using infrared (IR) fundus images of the retinal vasculature and vitreal surface as reference. Segmentation of GFP+ cells and somata resulted from applying two separate steps of intensity-thresholding to FA retinal images. Morphometric analysis of the binary representing cell somata allowed measurement of individual somal areas. GFP+ cells with somal area above 50 µm2 were classified as activated. Density of total and activated GFP+ cells was measured for individual retinal FA images, and examination of arbor extension and branching complexity was performed by direct observation of FA images.
Figure 2: Live image acquisition controls in cSLO Spectralis. (A) Manual touch screen panel display on initiation. (B) cSLO software imaging window, showing the head of a live mouse. (C) Settings selected for infrared imaging (lit in blue). (D) Fundus image of the retina during real time acquisition (left panel) and average (right panel). Normalization command indicated with black circle. Arteries and veins radiating from the optic nerve head are visible (between brackets), as are the optic axonal bundles (arrows) in between the blood vessels. (E) Settings selected for fluorescence imaging within a single xy point. (F) Single-point fluorescence (FA, 488 nm) imaging during acquisition (averaging). The smaller image (left) shows an individual scan, the larger image (right) shows the progress of intensity averaging. (G) Settings selected for acquisition of a multipoint (composite), fluorescence image. (H) Multipoint fluorescence imaging acquisition, showing the scan in progress, which the software identifies with a green circle (or red when acquisition is not possible). Scale bars represent ~5 mm (B) or 250 µm (D-H) Please click here to view a larger version of this figure..
Figure 3: Key ocular defects and imaging errors that can prevent correct cSLO imaging of microglial cells. (A–C) Ocular damage or defects, as well as image acquisition errors can prevent reliable imaging of GFP+ cells localized to the innermost planes of the retina. (A) Some gross eye defects are readily detectable in fundus images, including corneal or lens opacity, or injury and deepening of the optic disc area, all of which prevent clear imaging of GFP+ cells. (B) Focusing either above (the walls of the vessels become indistinguishable from the lumen) or below the inner surface of the retina (the vessels are barely visible) reduces the detectability of GFP fluorescence emission from cells located at the nerve fiber and ganglion cell layers. (C) Saturation levels incorrectly or unevenly set can result in bright but oversaturated images (with cells lacking resolution) or images with obscured areas. Scale bar represents 250 µm. Please click here to view a larger version of this figure.
Figure 4: Binary thresholding-based quantification of microglial cell counts and somal area. (A–D) Steps of cell segmentation in FluoRender. (A) Navigation window with rendered view of a representative single-point fluorescence image of microglia within the central retina (top panel); corresponding rendering properties (lower panel). (B) The same image during a cell segmentation routine, viewed as RGB, with corresponding threshold settings (lower panels). Thresholded cells are represented by white pixels and overlaid to their processes in cyan. (C) Image of cell masks obtained after cell segmentation. (D) Previous mask with inverted greyscale values for further image processing. (E–H) Steps of somal thresholding and quantification. (E) Use of intensity threshold to segment microglia somata based on their previous cell segmentation. The RGB intensity histogram (left) allows thresholding by direct selection of the lower 50-60% range of intensities (0 to 127-153). This segmentation creates a quantifiable mask that isolates individual microglial somata (blue). Images are rescaled using the spline function (oval at right). (F) Automatic threshold-based measurements of individual ROI/somata (top panel) and ROI silhouettes (Object Catalog, bottom panel) used to correct overlapping ROIs using Binary Tools (right panel) for manual separation or erosion. (G) Classification of individual somal areas by Area Restriction (top left panel). Segmented somata are classified as ROIs smaller and larger than 50-60 µm2, and the binary layers for each class of somata are assigned different color pixels (green and magenta, respectively). (H) Overlay of the segmented somata (green) on the original image (with increased contrast) used for direct observation of process complexity in individual activated cells (left panel). Magnified view of cell arbors. Scale bars represent 250 µm (A-H) or 50 µm (H, inset). Please click here to view a larger version of this figure.
Figure 5: High-resolution visualization of CX3CR1-GFP+ microglia/monocytes localized to the inner mouse retina by live confocal scanning laser imaging. (A) Single xy-point cSLO image showing GFP+ cells within the central retina in a 2 month old DBA/2J mouse (left). Magnified view (right) showing the ONH area (circle), blood vessels (lines) lined with perivascular microglia/macrophages, and parenchymal microglia tiling the central retina. (B) Multipoint image, collected immediately after the single point to visualize microglia across a wider retinal area (⅓ of the retina). (C, D) Identical images, shown with inverted greyscale for optimal observation of cell morphology and complexity (minimally adjusted for contrast and resolution). Somal size and shape can be resolved in most cells (left). Arbor extension and cell branching can be resolved in the cells with large somata (right, and 3 individual cells). (E) Infrared fundus image of the vasculature and optic disc used for xy-plane alignment of sequential images. Scale bars represent 250 µm (A, B and E), and 25 µm (C, far right). Please click here to view a larger version of this figure.
Figure 6: Segmentation of microglial cell and somata. (A) GFP+ cells rendered by segmentation in 2D using FluoRender. (B) Corresponding cell somata, detected by thresholding using confocal image analysis software. (C) Binary mask of cell somata amenable to quantitative analysis. (D) Classification of segmented cell somata by area to discriminate activated microglial cells (>50-60 µm2, magenta), and non-activated cells (<50 µm2, green). Dim and small cells (<10-20 µm2, yellow asterisk) are identified manually in the original image with inverted greyscale (Figure 3C). Scale bars represent 250 µm. Please click here to view a larger version of this figure.
Figure 7: Longitudinal tracking of microglial cell density and activation in young DBA/2J retinas. (A) Live cSLO fundus and FA images of the same eye, acquired from 3-5 months of age. Sequential FA images were used to quantify changes over time in total numbers of CX3CR1-GFP+ cells localized within the central ~1.7 mm2 of retina. Counts included parenchymal and perivascular microglia, but excluded cells clustered at the ONH (position indicated with white circle). (B) Timecourse analysis of retinal microglia cell density and activation at ages preceding neurodegeneration in DBA/2J chronic glaucoma (n = 10 retinas per age). Numbers of total GFP+ cells and of activated microglial cells (somal area >50 µm2) per mm2 of central retina. Each data point represents a single retina, and means for each age are represented with a horizontal line. (C) Monthly tracking of numbers of total GFP+ cells and of activated microglial cells in a single retina. There are parallel but quantitatively different changes in total and activated cell density, with more dynamic variation in the density of morphologically activated cells. Scale bar represents 250 µm (A). Please click here to view a larger version of this figure.
Live monitoring of microglial cell number and morphological activation during a neurodegenerative disease requires the use of non-invasive imaging methods that allow the detailed visualization of cell features. After imaging, microglial cells must be isolated (segmented) for morphometric analysis by use of multiple threshold steps to assess somal size and/or process complexity as readouts for microglia activation. In this protocol, we describe methods for live image acquisition using cSLO, and quantitative analysis of microglial activation based on sequential cell and soma segmentation. We apply these strategies to assess the kinetics of retinal microglia activation and microgliosis over 2 months in the context of a chronic neurodegenerative disease of the retina.
Reporter mice and microglia/peripheral monocytes cell types
The use of mice that express GFP under the control of the fractalkine receptor (CX3CR1) locus46 allows reliable identification of resident microglia, and robust GFP expression permits remarkable in vivo visualization30-32,34,36. Here, we use a substrain of DBA/2J mice, derived by backcrossing C57BL/6.129P-Cx3cr1 tm1Litt/J mice46 into the DBA/2J genetic background59. Peripheral monocytes and macrophages, which can invade the CNS during disease or injury, also express the GFP tag15,46,47.
Live imaging studies of microglia in the neurodegenerative retina
Our in vivo tracking of CX3CR1-GFP/+ retinal cells using cSLO builds on previous studies that monitored changes in retinal GFP+ cell numbers following acute injury for up to 10 weeks30-32,34,48. Here, we visualize CX3CR1-GFP/+ microglia/peripheral monocytes with cellular resolution, by monthly cSLO imaging of the retina during the early progression of chronic glaucoma. Additionally, we use live image automated threshold-based analysis to detect and quantify cell resizing and remodeling with enough spatial and temporal resolution to monitor changes in activated and total microglia counts within individual eyes and across individuals.
Technical limitations of cSLO imaging of GFP+ microglia in the retina
We found imaging quality to be consistent and reproducible, as illustrated by a comparison of single versus multi-xy point images obtained in a single session (Figure 5). However, consistent and reproducible GFP+ cell imaging acquisition, in a single session and over time, is critically depend on the selection of stable parameters for fundus and fluorescence cSLO imaging. Alignment of the eye and optic disc to the cSLO objective determines the uniformity of saturation levels and the focus on the confocal plane of interest49. Inaccurate and/or non-uniform specification of saturation levels can generate artifactual variations in GFP detection, autofluorescence background, and cell and arbor resolution. To correctly focus on microglia localized to the nerve fiber and ganglion cell layers, it is critical to align and focus on the retinal blood vessels and on axonal bundles at the vitreal surface by IR fundus imaging. This provides a reference plane to locate the GFP+ cells by FA. The required refocusing needed for switching from IR to FA can be guided by the acquisition of multiple FA images at slightly different depths (55-60 D) in each experimental session. This can also help compensate for anatomical differences due to age, pupil dilation and pathology (optic disc excavation). Since image resolution and cell detail depends on the optimal specification of saturation levels throughout the fundus, and careful alignment of the eye relative to the camera49, image sequences acquired over time for the same eye must show fundus IR images with consistent and comparable focus, illumination, resolution and retinal field span. Manual counts of total GFP+ cell numbers in images acquired in a single session (1.5-1.7 mm2 of retina, n = 13 retinas, aged 3-5 months) confirmed consistent and reproducible quantification of cellularity (3-4% variation; data not shown). This is necessary for images to be amenable for GFP+ cell segmentation via threshold analysis based on a similar intensity range, and comparison of changes over time.
Threshold and morphometric analyses of retinal microglia in live cSLO images
Only recently, in vivo visualization of brain microglia with high cellular resolution by two-photon confocal microscopy has enabled the quantitative analysis of microglial soma and process parameters, and the discrimination of morphologically activated microglia9,50. As shown by these authors, somal size is the most conspicuous morphological parameter detectable over time by live two-photon confocal imaging of brain microglia, using iterative intensity-based thresholding to reduce signal-to-noise variations9. Furthermore, somal size changes correlate with upregulation of Iba1 expression in activated cells9. Here, we use cSLO live images and apply comparable sequential segmentation of microglial cells and somata, followed by morphometric analysis to quantify numbers of total and activated CX3CR1-GFP+ cells localized to the retina.
We use specialized confocal rendering software (FluoRender) to segment GFP+ cells in the central retina. These images, are further thresholded using a commercially available confocal image analysis package, to ultimately allow the automatic segmentation and threshold-based quantification of somal area. Our live image analyses confirmed the use of soma size as a morphological metric of microglial activation in live image analysis9. Somal threshold-based counts allowed the characterization of patterns and increases in retinal microgliosis, as previously demonstrated by ex vivo image analysis50. We find that cSLO detects GFP+ microglia with best resolution and detail within the mouse central retina (<2 mm2), where cells can be imaged at the same confocal plane. Towards the retina periphery, the fluorescence signal shows variability and distortions that prevent identical imaging processing and threshold analysis as for GFP+ cells detected in the flatter central retina. Finally, our protocol shows that cSLO in vivo image analysis of retinal microglia offers a relatively high throughput. The number of parenchymal microglial that could be visually isolated and quantified within the central retina varied between ~200-300 total cells, and ~10-180 activated cells. Thus, the mouse retinal microglia offers an optimal population to study in vivo their transformation and roles during the pathogenesis of neurodegeneration.
Application to other CNS chronic diseases
The in vivo image analysis methods described here should be applicable to assess acute or chronic microglial changes in other mouse retinal diseases and injury models. Furthermore, this protocol may serve to evaluate retinal microglia/peripheral monocyte changes resulting from chronic CNS pathologies, such as Alzheimer's, Parkinson’s and multiple sclerosis, given that the retina and optic nerve are targeted for neurodegeneration in these diseases51-56. In line with this, the use of live detection of retina and ONH pathology for early Alzheimer’s disease management is under intense study54,57,58.
In conclusion, our findings suggest that live, longitudinal tracking and quantification of changes in retinal microglia numbers and morphological activation, may serve as reliable neuroimaging biomarkers to detect disease onset and early progression. These in vivo imaging and analysis methodology apply to age-related glaucoma, and potentially to other neurodegenerative diseases that impact the retina and optic nerve.
The authors have nothing to disclose.
We thank the Scientific Computing and Imaging Institute of the University of Utah for use of FluoRender software (R01GM09815). This work was supported by grants from the Glaucoma Research Foundation, Melsa M. and Frank Theodore Barr Foundation and the US National Institute of Health, (R01EY020878 and R01EY023621) to M.L.V., and (R01EY017182 and R01EY017950) to B.K.A.
Name | Company | Catalog Number | Comments |
DBA/2J and CX3CR1-GFP/+ mice |
The Jackson Laboratory, Bar Harbor, ME | 000671 and 00582 | Mice are breed in-house, introducing new breeders every 3 to 4 generations to prevent genetic drift. |
301/2G needle and 1 ml tuberculin slip-tip syringe | BD, East Rutherford, NJ | 305106 and 309659 | |
2,2,2-tribromoethanol, tert-Amyl alcohol 99% and phosphate buffer saline tablets | Sigma-Aldrich, St. Louis, MO | T48402, 152463 and P4417 | Avertin solution (pH 7.3, sterile filtered) must be freshly made solution or stored at 4ºC for up to 1 week. |
Heat therapy T/Pump | Gaymar Industries, Orchard Park, NY | TP-650 | |
Cotton-tipped applicators | Fisher Scientific, Pittsburgh, PA | 23-400-100 | |
Tropicamide 1% | Bausch & Lomb, Rochester, NY | NDC 24208-585-64 | |
PMMA contact lenses, 1.70-base curve, 3.2 mm total diameter, 0.40 mm-thick center | Cantor & Nissel Ltd., Northamptonshire, UK | G003709 | Lenses are rinsed with sterile PBS and stored in polypropylene boxes. |
HRA/Spectralis confocal scanning laser ophthalmoscope and Eye Explorer software | Heidelberg Engineering GmbH, Carlsbad, CA | Version 1.7.1.0 | |
PowerPoint | Microsoft, Redmond, WA | Version 14.4.3 | |
Adobe Photoshop | Adobe, San Jose, CA | Version CS3 | |
FluoRender | Scientific Computing and Imaging Institute, University of Utah | Version 2.13 | Freeware. http://www.sci.utah.edu/software/13-software/127-fluorender.html |
NIS-Elements C | Nikon, Melville, NY | Version 4.30.01 |