We present a protocol to measure [14C]-iodoantipyrine (IAP) uptake and assess the activation of neural substrates that are involved in central post-stroke pain (CPSP) in a rodent model.
Approximately 8% of stroke patients present symptoms of central post-stroke pain (CPSP). CPSP is associated with allodynia and hypersensitivity to nociceptive stimuli. Although some studies have shown that neuropathic pain may involve the dorsolateral prefrontal cortex, rostral anterior cingulate cortex, amygdala, hippocampus, periaqueductal gray, rostral ventromedial medulla, and medial thalamus, the neural substrates and their connections that mediate CPSP remain unclear. [14C]-Iodoantipyrine (IAP) uptake can be measured to evaluate spontaneously active pain. It can be used to assess the activation of neural substrates that may be involved in CPSP in an animal model. The [14C]-IAP method in rats is less expensive to perform compared with other brain mapping techniques. The present [14C]-IAP protocol is used to measure the activation of neural substrates that are involved in CPSP that is induced by lesions of the ventral basal nucleus (VB) of the thalamus in a rodent model.
Stroke hemorrhage has been shown to occur in more than 8% of patients who suffer from neuropathic pain, referred to as central post-stroke pain (CPSP).1-3 CPSP can result from somatosensory dysfunction, thereby inducing hypersensitivity and allodynia.4 However, the pathophysiological mechanisms of somatosensory dysfunction in CPSP remain uncertain. For example, the loss of somatic sensations results from neuronal deafferentation in the hemorrhagic brain area. Hyperalgesia may be caused by the hyperexcitability of central nociceptive neurons or central disinhibition,5, 6 but the neural substrates that are involved in CPSP symptoms remain unknown. Some studies have suggested that the dorsolateral prefrontal cortex (dPFC), rostral anterior cingulate cortex (ACC), amygdala, hippocampus, periaqueductal gray (PAG), rostral ventromedial medulla, and their connections with each other mediate nociceptive processing.7 Additionally, medial prefrontal cortex (mPFC)-amygdala circuits were shown to be involved in pain-related perception.8 Data on the pathophysiological mechanisms of CPSP are diverse, and the activation of neural substrates in CPSP needs further scrutiny.
[14C]-Iodoantipyrine (IAP) uptake is used to indirectly observe regional cerebral blood flow (rCBF), assuming a relationship between brain activity and CBF. Although [14C]-IAP cannot assess brain activity in real time, such as with functional magnetic resonance imaging (fMRI), it has several advantages. For example, [14C]-IAP is suitable for measuring spontaneously occurring brain events during pathological states.9 Moreover, [14C]-IAP uptake is measured without anesthesia. It also costs less than other imaging methods, including fMRI and positron emission tomography (PET). The [14C]-IAP method has been suggested to be appropriate for measuring spontaneous pain (e.g., CPSP) that is induced by lesions of the ventral basal nucleus (VB) of the thalamus.9
The present protocol describes how to perform the [14C]-IAP method to assess the involvement of neural substrates of CPSP that is induced by lesions of the VB of the thalamus in an animal model. The technique offers a way of determining the pathophysiological mechanisms that underlie CPSP symptoms at the behavioral and neuronal levels.
The protocol in the present study received approval from the Academia Sinica Institutional Animal Care and Utilization Committee in Taiwan.
1. Animal Preparations
2. Experimental Procedure
3. Data Analysis
Figure 1A depicts the experimental timeline. Rats were assigned to the sham and CPSP groups for the behavioral tests (i.e., von Frey test and plantar test). The first day of the experiment served as baseline, and tests were repeated at weeks 1 – 5. PE-50 catheterization was performed in the external jugular vein at week 4. Heparin (20 U/ml, 0.1 ml/day) was injected during weeks 4 and 5. Five minutes after the heparin injection, [14C]-IAP was injected, followed 10 sec later by an overdose of anesthetic for sacrifice. One minute later, the rats were decapitated, and OCT-embedded brain slices were made. Figure 1B depicts the rats in a surgical stereotaxic device, cannula implantation sites, and histological map of the brain slices based on a rat brain atlas. Figure 1C shows the right hole of the external jugular vein in red, the location of the PE- 50 tubing, and final experimental setup.
Figure 2A shows brain slices that were exposed in the cassettes. The phosphor screen was analyzed using a variable-mode imager. Sample and standard data for the brain slices were then analyzed. Figure 2B shows the standard autoradiographic curves. The left panel shows the relationship between image intensity (pixel/mm2) and radioactivity counts per minute (CPM), thus yielding the following predicted linear equation: Y = 44.542X + 196.24. The right panel shows that the resolution (pixel/mm2) was enhanced as the exposure time increased (in days). The optimal resolution was observed on Day 4.
Figure 3A shows the experimental setup for the plantar test, which assesses thermal pain. The CPSP group exhibited a significant decrease in the paw withdrawal threshold (i.e., less heat tolerance) compared with the sham group at baseline and weeks 1 – 5 (all p < 0.05). Figure 3B shows the experimental setup for the von Frey test, which assesses mechanical pain. The CPSP group exhibited a significant decrease in mechanical force (gw) at baseline and weeks 1 – 5 (all p < 0.05).
Figure 4A shows the ROIs in an anatomical atlas. The ROI analysis showed that activation of the infralimbic cortex (IL), prelimbic cortex (PrL), and cingulate cortex area 1 (Cg1) was significantly higher in the CPSP group in the right hemisphere, with the exception of the VB (Figure 4B).
Differences in inter-regional correlations of rCBF were observed between the CPSP and sham groups in the right hemisphere (Figure 4C). The matrix (Fisher's Z-statistics) of all of the regions was analyzed using Pearson's correlation. Figure 4C shows differences in inter-regional correlations of the involvement of neural substrates in the CPSP group. Pain-related neural substrates were determined by analyzing differences in inter-regional correlations of rCBF. The red lines in Figure 4D indicate significant positive correlations, and blue lines indicate significant negative correlations.
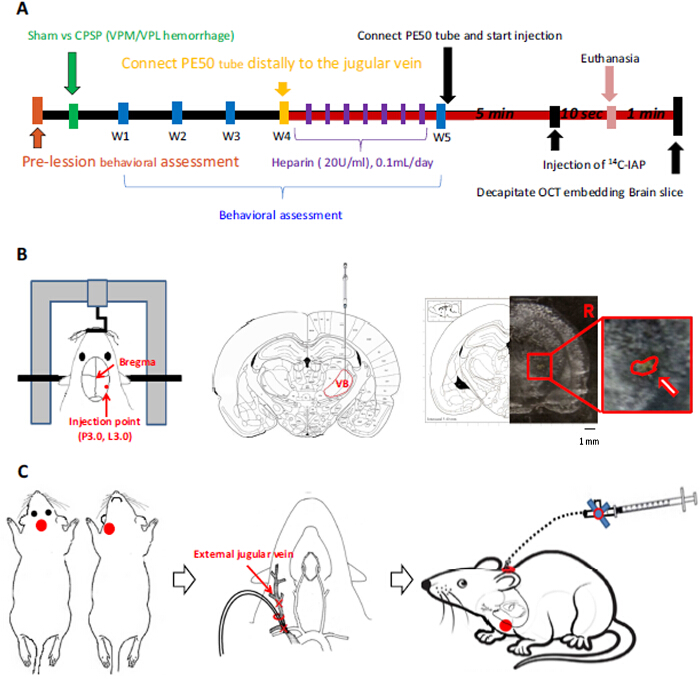
Figure 1. Experimental Timeline of Lesioning the Ventral Basal Nucleus (VB) of the Thalamus to Induce Central Post-Stroke Pain (CPSP) and Injecting [14C]-IAP. (A) Ventral basal nuclei lesions to induce CPSP for the behavioral assessments and injections of [14C]-IAP to measure the activation of neural substrates that are involved in CPSP. (B) Location of VB. (C) [14C]-IAP injections. Scale bar = 1 mm. Please click here to view a larger version of this figure.
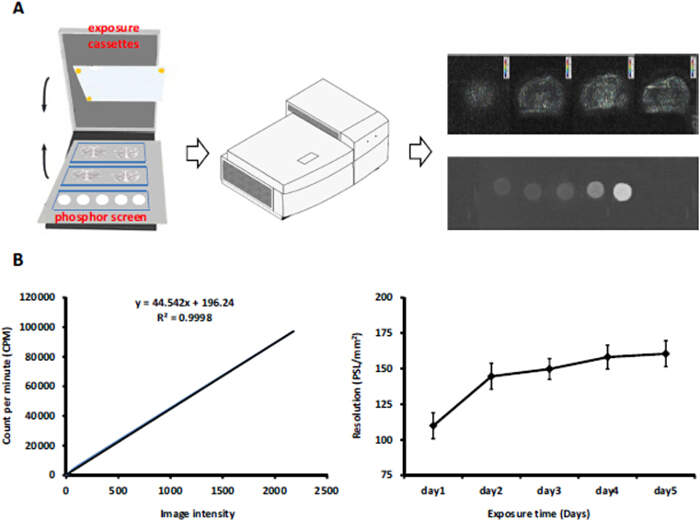
Figure 2. Standard Autoradiographic Curves. (A) Sample and standard curves were obtained for different exposure times and image resolutions. (B) Standard curve of image intensity and CPM and standard curve of exposure time and resolution. Please click here to view a larger version of this figure.
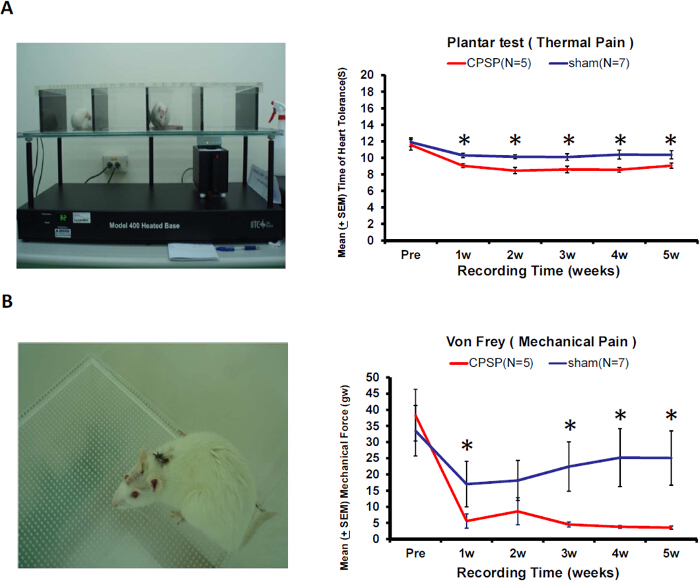
Figure 3. The Plantar Test (Thermal Pain) and von Frey Test (Mechanical Pain) were Conducted in the Sham and CPSP Groups at Baseline and Weeks 1 – 5. (A) CPSP rats exhibited a lower paw withdrawal threshold in the plantar test (i.e., less heat tolerance) compared with sham rats, indicating greater thermal pain. (B) CPSP rats exhibited a lower paw withdrawal threshold in the von Frey test compared with sham rats, indicating greater mechanical pain. SEM, standard error of the mean. Green asterisks (*) indicate a significant difference compared with the sham group. Please click here to view a larger version of this figure.
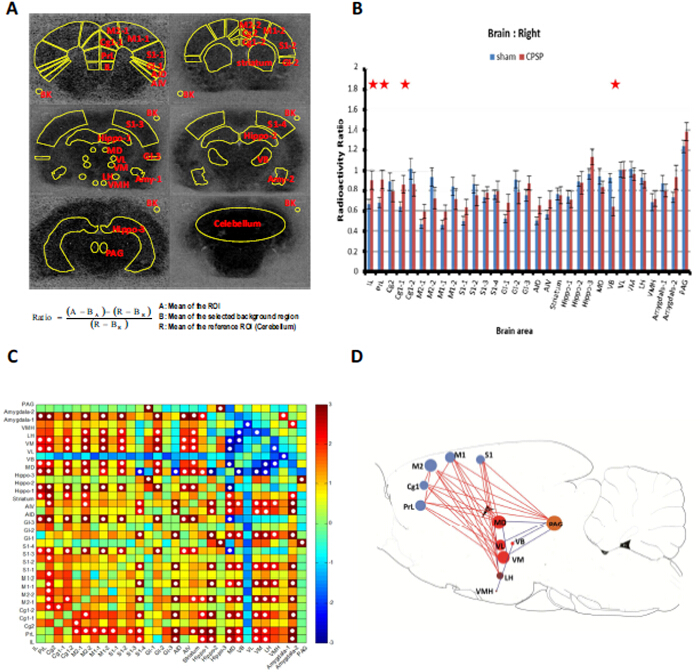
Figure 4. ROI Analysis and Relationship among Inter-Regional Correlations Between Neural Substrates Involved in CPSP. (A) Brain areas were determined and analyzed by the ratio formulation. (B) The ROIs in the IL, PrL, Cg1, and VB were significantly different in the right hemisphere. (C) Analysis of rCBF in the selected brain areas. (D) Inter-regional correlations between brain areas. Please click here to view a larger version of this figure.
In the behavioral tests, the CPSP group exhibited reductions of the paw withdrawal threshold in the thermal pain test and mechanical force in the von Frey test at baseline and weeks 1 – 5. The findings were consistent with a previous study.14
The [14C]-IAP method relies on the pixel intensity of brain images for the quantitative analysis of different brain slices. To evaluate the data in the brain images, the pixel signal intensity was defined. In the present study, the environmental background signal was defined as 25.811 – 46.979 CPM. The signal of the [14C]-IAP 0.001 µCi filter paper was defined as 42 CPM. The pixel signal intensity was < 0.001 µCi, serving as the background intensity. The pixel intensity of five filter papers was determined for 0.001, 0.01, 0.1, and 10 µCi, serving as the pixel gray scale for each of the brain images. [14C]-IAP radioactivity showed a positive correlation with pixel intensity and radioactivity count on a logarithmic scale. Therefore, the above procedure can be followed for the calibration of [14C]-IAP radioactivity to pixel intensity.
When performing the [14C]-IAP experimental protocol, some points need to be considered. For example, the external jugular vein can become blocked, and experimenters need to ensure the patency of the PE- 50 tubing with heparin every day. Additionally, the location of the lesion sites can sometimes be misplaced, resulting in nonsignificant CPSP symptoms. Before the injections, the accuracy of the injection sites and locations relative to bregma must be confirmed. The angle and volume of each injection must also be accurately determined.
Limitations of brain images also need to be considered. Distortions of the brain images can occur after exposing brain slices in the cassettes to a phosphor screen. The brain images need to be normalized to a standard brain atlas using an image analysis program to avoid potential distortions in the brain images. Furthermore, different isotopes can yield different results because of their different mechanisms and action. For example, the metabolite and mechanism of action of [18F]-fludeoxyglucose (FDG) are similar to glucose. Therefore, the [18F]-FDG images were shown to be similar to the pathway of glucose metabolism. Additionally, the half-life of [18F]-FDG is short; therefore, it must be combined with PET to generate the images. [201Tl] is suitable for assessing myocardial blood flow perfusion using single-photon emission computed tomography. Therefore, choosing a suitable isotope for assessing brain images is important.
The application of the [14C]-IAP method to assess brain activation in CPSP is less costly than other brain mapping techniques (e.g., PET and fMRI). The [14C]-IAP method is suitable for spontaneously occurring events, but it cannot be used for brain mapping in real time. The method is different from other brain mapping techniques, such as PET and fMRI. Furthermore, the present [14C]-IAP protocol can measure subtle changes in rCBF in any pathological condition.
The [14C]-IAP method can be used to test conventional pain pathways, such as the spinothalamic tract (STT), medial thalamus (MT)-ACC, and mPFC-amygdala neural circuits. The activation of each of these pathways impacts the others. The activation of these pathways in CPSP has been detailed in our previous paper.12
The authors have nothing to disclose.
The present study was supported by National Science Council grants to Dr. Bai-Chuang Shyu (NSC 99-2320-B-001-016-MY3, NSC 100-2311-B-001-003-MY3, and NSC 102-2320-B-001-026-MY3). This work was conducted at the Institute of Biomedical Sciences, which received funding from Academia Sinica.
Anesthetic: | |||
Isoflurane | Halocarbon Products Corporation | NDC 12164-002-25 | 4% |
Surgery | |||
homeothermic blanket system | Harvard Apparatus | Model 50–7079 | body temperature were maintained at 36.5-37.5°C. |
10µl micro syringe | Hamilton | 80008, Model 1701SN | injected with collagenase |
polyethylene-50 tubing | Becton, Dickinson and Company | 427411 | catheterized into external jugular vein |
1 c.c syringe | Terumo Medical Products | SS-01T | injected with 14C-IAP and saline. |
saline (Sodium Chloride 0.9gm) | Taiwan Biotech Co., LTD. | 100-130-0201 | To flush the tube |
Drugs: | |||
type 4 collagenase | Sigma | C5138-500MG | 0.125 U |
Gentamicin | Sigma | G1264-250MG | 6 mg/kg |
Heparin | Sigma | H9399 | 20 U/ml; 0.1 ml/day |
14C-iodoantipyrine (IAP) | PerkinElmer | NEC712 | 125 mCi/kg in 300 ml of 0.9% saline |
Potassium chloride | Merck | 1.04936.1000 | 3 M |
Behavior system: | |||
von Frey esthesiometer | Fabrication Enterprises, Inc. | Baseline Tactile Monofilaments 12-1666 | mechanical hyperalgesia was assessed by measuring the withdrawal response to a mechanical stimulus |
plantar test apparatus | IITC Life Science | IITC 390G Plantar Test | Thermal hyperalgesia was assessed by measuring the hind paw withdrawal latency in response to radiant heat. |
Brain slice: | |||
Optimal Cutting Temperature compound | Sakura Fintek Inc | 4583 | embedded the brain |
dry ice | frozen in dry ice/methylbutane (approximately −55°C) | ||
methylbutane | Sigma | M32631-1L | frozen in dry ice/methylbutane (approximately −55°C) |
Cryostat | Leica Biosystems Nussloch GmbH, Germany | Leica CM1850 | Coronal brain slice were sectioned on this machine. |
Data analyze | |||
exposure cassettes with a phosphor screen | Amersham Biosciences | 20 cm x 25 cm | The slices were dried on glass slides and placed alongside five standard filter papers with graded radioactivity. All of the slides were exposed to the cassettes at −20°C. |
γ-counter | Beckman Coulter | Beckman LS 6500 Liquid Scintillation Counter | To measure the radioactivity count of the filter papers. |
Typhoon 9410 Variable Mode Imager | GMI, Inc. | WS-S9410 | To read phosphor screen which was exposed by brain slice |
Statistical Parametric Mapping (SPM) | Wellcome Centre for Neuroimaging | version 8 | all of the brains were averaged to create the final brain template. To determine significant differences between the images in these two groups, the images were derived by subtracting the sham group from the CPSP group. |
ImageJ | http://imagej.nih.gov/ij | version 1.46 | Adjacent sections were aligned both manually and using Stack- Reg, an automated pixel-based registration algorithm in ImageJ software. All of the original three-dimensionally reconstructed brains were smoothed and normalized to the reference rat brain model. |
Matlab | MathWorks | version 2009b | used Pearson correlation coefficients to examine the relationships between the CPSP and sham groups. An inter-regional correlation matrix was calculated across animals from each group. |
Pajek | http://Pajek.imfm.si/ | version 3.06 | Graphical theoretical analysis was performed on networks defined by the above correlation matrices using Pajek software. |