Millions of people suffer from retinal degenerative diseases that result in irreversible blindness. A common element of many of these diseases is the loss of retinal ganglion cells (RGCs). This detailed protocol describes the isolation of primary murine RGCs by positive and negative selection with flow cytometry.
Neurodegenerative diseases often have a devastating impact on those affected. Retinal ganglion cell (RGC) loss is implicated in an array of diseases, including diabetic retinopathy and glaucoma, in addition to normal aging. Despite their importance, RGCs have been extremely difficult to study until now due in part to the fact that they comprise only a small percentage of the wide variety of cells in the retina. In addition, current isolation methods use intracellular markers to identify RGCs, which produce non-viable cells. These techniques also involve lengthy isolation protocols, so there is a lack of practical, standardized, and dependable methods to obtain and isolate RGCs. This work describes an efficient, comprehensive, and reliable method to isolate primary RGCs from mice retinae using a protocol based on both positive and negative selection criteria. The presented methods allow for the future study of RGCs, with the goal of better understanding the major decline in visual acuity that results from the loss of functional RGCs in neurodegenerative diseases.
RGCs are terminally differentiated neurons, and therefore, primary cells are required for experimentation. The development of a protocol for the isolation and enrichment of primary murine retinal ganglion cells (RGCs) is fundamental to revealing the mechanisms of RGC health and degeneration in vitro. This is especially important for studies that seek to generate potential therapies to promote RGC function and to minimize their death. The degeneration of RGCs is associated with retinal degenerative diseases, such as glaucoma, diabetic retinopathy, and normal aging. Although the specific cellular mechanisms underlying RGC loss are unclear, a series of risk factors have been identified. Lack of oxygenation at the optic nerve head1,2,3 causes RGC death4 and acts as the disturbance of the homeostasis between the activation of excitatory and inhibitory receptors within individual RGCs5,6. A series of challenges impede progress towards the use of these cells for in-depth studies. First, the number of RGCs present in a murine retina is small. RGCs account for less than 1% of total retinal cells7,8,9. Second, most RGC-specific markers are intracellular proteins10,11,12. Selection based upon these markers leaves the cells non-viable, which precludes downstream functional analyses. Finally, currently available protocols are lengthy and lack standardization13,14. Early RGC isolation protocols were based on immunopanning methods. Barres et al.15 adapted the classic immunopanning technique and added a second step, which excluded monocytes and endothelial cells from the bulk of retinal cells prior to positive selection based upon immunopositivity to anti-thymocyte antigen (aka Thy1), a cell-surface marker. Years later, Hong et al. combined magnetic bead isolation techniques with cell sorting strategies to isolate RGCs with higher purity16. The use of magnetic beads is still used in many scientific applications. Together, magnetic beads and flow cytometry protocols improved the purity of isolated cells. However, these purification systems have not yet been standardized for the isolation of murine RGCs from dissociated retinae.
Flow cytometry is a powerful analytical method that measures the optical and fluorescence characteristics of cell suspensions. Cells are analyzed both quantitatively and qualitatively with a high level of sensitivity, providing a multi-dimensional analysis of the cell population. Cellular discrimination is based upon two main physical properties: cell size or surface area and granularity or internal complexity17. A multi-dimensional analysis can be performed by combining antibodies tagged with fluorochromes that have similar excitation wavelengths and different emissions. Flow cytometry is fast, reproducible, and sensitive. Multitpe lasers permit even greater multi-dimensional analyses of single cells by flow cytometry. Thus, it is an attractive methodology for the study of cytological specimens. Fluorescence activated cell sorting (FACS) uses the multi-dimensional phenotypic differences identified by flow cytometry to sort individual cells into distinct subpopulations.
In the last decade, multiple surface and intracellular proteins have been identified as potential biomarkers for the selection of cells, including neurons. Initial studies that sought to isolate RGCs from rats used Thy1 as a ganglion cell marker. Unfortunately, Thy1, aka CD90, has multiple isoforms in other rodent species18,19,20 and is expressed by multiple retinal cell types19,20, making it a non-specific marker for RGCs. Another surface marker, CD48, is found on monocytic populations in the retina, including macrophages and microglia. Using these two surface markers, a modified RGC signature-Thy1+ and CD48neg cells-was developed15,16,21,22. Unfortunately, these two selection criteria are not sufficient to select for a highly enriched RGC population. To address this unmet need, a flow cytometry protocol was developed23 based on multi-layered positive and negative selection criteria using known cell surface markers to enrich and purify primary murine RGCs.
All procedures detailed in the following protocol were approved by the Institutional Animal Care and Use Committee (IACUC) review board at the University of Tennessee Health Science Center (UTHSC) and followed the Association for Research in Vision and Ophthalmology (ARVO) Statements for the Use of Animals in Ophthalmic and Vision Research, in addition to the guidelines for laboratory animal experiments (Institute of Laboratory Animal Resources, Public Health Service Policy on Humane Care and Use of Laboratory Animals).
1. Preparation of Instruments, Solutions, and Media
Note: All information about materials, reagents, tools, and instruments reported in the protocol are specified in the Table of Materials.
2. Enucleation
Note: A total of 10 young (5-7 weeks old) C57BL/6J mice were used in this experiment to isolate 1.0 x 10⁶ RGCs with the phenotype CD90.2+CD48negCD15negCD57neg.
3. Preparation of the Retinal Cell Suspension
4. Immunolabeling the Retinal Cells
5. Cell Sorting Strategy
Note: Specific instructions for instrument setup for FACS with 355 nm, UV; 405 nm, violet; 488 nm, blue; and 640 nm, red lasers with 2, 2, 5, and 3 fluorescence channel distribution, respectively. The operating software was DIVA version 8.0.1. Cell sorting was performed with a 70 μm nozzle, 70 psi sheath pressure, 87.5 frequency, 48.6 amplitude with first drop breakoff at 333, gap asetting of 6, sort precision set to four-way purity with default (32) purity mask, and drop delay adjusted to 42.98 using beads.
6. Confirmation on RGC Intracellular Markers
7. Validation of the Cell Sort by qPCR Analysis
Note: See Figure 4.
The in-depth study of RGCs is impeded by many factors, including their low frequency and the lack of a robust and standardized methodology for their isolation. Figure 1 shows the methodology used for retinae isolation. Variations in the enucleation procedure exist based on the type of analysis, such as if the enucleation is part of in vivo experimentation27. Enucleation in this protocol is performed on euthanized mice. As shown in Figure 1A-B, forceps are placed under the eye and pulled up to cause minimal bleeding and to remove an eye globe with an intact optic nerve.
Differences exist in the number of RGCs in different mouse strains, especially in genetically altered mice23,28,29,30. Awareness of these differences is important when determining the number of mice to be used. Retinae from old C57BL/6J mice have fewer live retinal cells than their younger counterparts23. Therefore, retinal dissection must be carefully performed to maximize the cell yield. A step-by-step procedure for retinal dissection is presented in Figure 1C-J. Retinal cells are fragile. Thus, dissected retinae are placed in nylon strainers and are macerated with either the back end of a syringe, as shown in Figure 2A, or with a pestle for cell strainers. The maceration of cells directly in the cell strainer is fast and reduces cell clumps. A representative image of the cell suspension is illustrated in Figure 2B. Multiple inner retinal cells can be visualized. At this point, the RGCs have lost their signature morphology due to axotomy during cell isolation and the preparation of the cell suspension.
The most labor-intensive step of this methodology is the cell sorting setup. This phase is a critical step during multicolor FACS, as it maximizes signal-to-noise resolution. Figure 3A shows the gating strategy used for the isolation of RGCs. This strategy targeted the removal of contaminant cells from the cell suspension, which included monocyte, glial, amacrine, and photoreceptor cells. As part of the methodology, additional surface markers were confirmed by immunohistochemical analysis before they were used as part of the exclusion strategy. Previous data demonstrated that a small percentage of CD90.2+ cells are CD48+. Exclusion of these cells removed monocytes and possibly microglia from the retinae cell pool. It has been previously shown that the classic Thy1+CD48neg surface phenotype is not sufficient to identify and isolate murine RGCs23, as these cells express genes associated with amacrine, Müller, bipolar, horizontal photoreceptor, and retinal pigment epithelial cells (Figure 4A). This is further addressed by investigating additional markers for cell exclusion. CD15 has been described as a marker of amacrine and bipolar cells31, prompting its use as an additional marker for negative selection. Work from Uusitalo et al.32 described CD57 as an identification marker for glial cells and photoreceptors. Therefore, this antibody was added to the cell sorting strategy.
Next, these cells were characterized to validate the methodology for the isolation of murine RGCs. The phenotypes of the CD90.2+CD48negCD15negCD57neg sorted cells (Figure 3B) were evaluated for the expression of the following intracellular markers associated with RGCs10,11,12,33: SNCG, BRN3A, TUJ1, and RBPMS. As shown in Figure 3C, the sorted cells expressed all four RGC-associated intracellular proteins. Next, imaging flow cytometry was used in Figure 3D to show the intracellular localization of RBPMS and the cell surface expression of CD90.2. These results were tested in multiple cytometer systems, confirming the reproducibility and standardization. As shown in Figure 3E, some of the sorted cells began showing the morphology associated to RGCs after in vitro cell culture.
Lastly, a comparison of cells prior to enrichment and post-cell analysis was performed by qPCR analysis. Comparison of the Thy1+CD48neg phenotype to the CD90.2+CD48negCD15negCD57neg sorted cells revealed that the Thy1+CD48neg phenotype expresses genes associated with RGCs, but also with other retinal cells. However, the highly enriched sorted cell population (Figure 4B) showed a many-fold increase in the genes coding for the RGC-specific intracellular markers Sncg (SNCG), Pouf4l (BRN3A), Tubb3 (TUJ1), and Rbpms (RBPMS). Collectively, the mRNA and protein assessments validated the methodology.
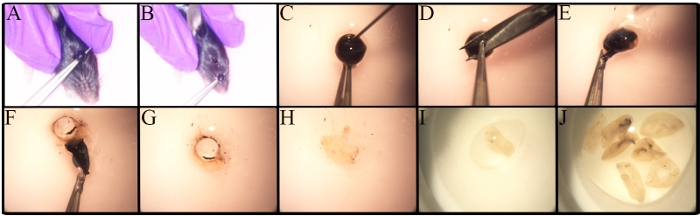
Figure 1. Enucleation and Ocular Dissection for Retinal Isolation. Young C57BL/6J mice were euthanized prior to eye globe removal with CO2 and cervical dislocation. A) Place forceps under the eye and pull up the eye in one movement. B) The eye is removed, including the optic nerve. C-J)Step-by-step guide to remove the retina. C) A puncture is performed using a 30G needle prior to corneal removal to allow the aqueous humor to exit the eye. D) The cornea is held with forceps to make a small incision. E-F) The use of forceps allows for peeling off the cornea, retinal pigment epithelium, choroid, and sclera. The retina is detached from the sclera, rolled, and removed. G) The lens is removed and discarded. H-J) The collected retinae are placed in a small dish containing PBS/1% FBS to keep them moist at all times. Please click here to view a larger version of this figure.
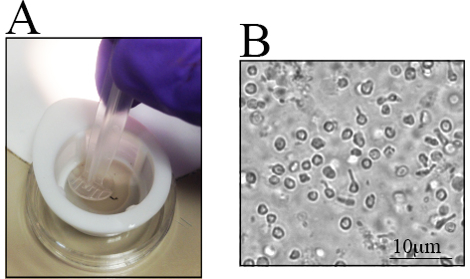
Figure 2. Retinal Cell Suspension after the Maceration of Collected Retinae. The collected retinae are placed in a small dish to isolate the cells. A) Retinae are placed in a 70-µm nylon strainer and macerated using the back-end of a syringe. B) Representative image of the cell suspension, where distinct retinal cells are observed. The scale bar is 10 µm.
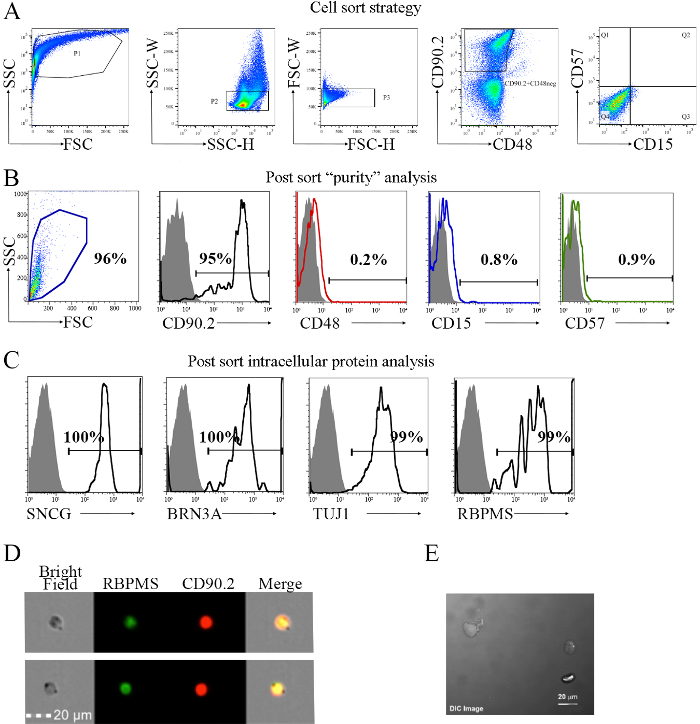
Figure 3. Sorting Strategy for the Isolation of Cells with the CD90.2+CD48negCD15negCD57neg Phenotype and Post-sorting Analysis. The sorting strategy is based on the inclusion of CD90.2 cells and the exclusion of CD48-, CD15-, and CD57-positive cells, which are contaminant cells. A) As a first step, plot size (FSC) and internal complexity (SSC) to obtain an overview of the cell population. Initial gated population (P1) is used to discriminate between single cells and clumped cells or aggregates using the SSC-height (H) versus width (W), P2. The selection of the single cells is used to choose the CD90.2+CD48neg cells. To confirm removal of all doublets, a plot of FSC-H versus FSC-W is performed, P3 (middle panel). Cells were labeled with AF700-conjugated anti-mouse CD90.2, PE-Cyanine7-conjugated anti-mouse CD48, PE-conjugated CD15, and anti-mouse CD57. As a secondary antibody to tag the anti-mouse CD57, anti-mouse BV421 was used. Population 3 (P3) was plotted in the fourth panel to select the CD90.2+CD48neg cells, removing the majority of contaminant cells. Next, a CD57 versus CD15 plot is generated using the selected CD90.2+CD48neg cells. Quadrant 4 (Q4) is selected, as it represents the CD90.2+CD48neg cells that are negative for both CD15 and CD57. The resulting phenotype of the gated population is CD90.2+CD48negCD15negCD57neg. B) Post-sort analysis of the surface markers used in A). Sorted cells are homogeneous in size, as shown in the first panel. The subsequent histograms show the percentage of each surface marker used in the sorting strategy detailed in A). A total of 95% of the cells are CD90.2+, as shown in the black line compared to the Ig control, represented by the solid histogram. These cells were gated to evaluate the percentages of CD48, CD15, and CD57, represented by the red, blue, and green lines, respectively. Results show minimal expression of these cell surface markers. C) Confirmation of the RGC phenotype by using the RGC-specific intracellular markers SNCG, BRN3A, TUJ1, and RBPMS. Black lines represent the percentage of cells expressing each intracellular marker. D) Representative images taken in an imaging cell sorter showing the intracellular localization of RBPMS, an RGC-specific intracellular marker, and the cell surface marker CD90.2. The scale bar is 20 µm. E) Representative image of sorted RGCs after 24 h in culture using a confocal microscope. The scale bar is 20 µm. Images B-E are adapted from previously published work with permission23. Images D-E were taken at 20X. Please click here to view a larger version of this figure.
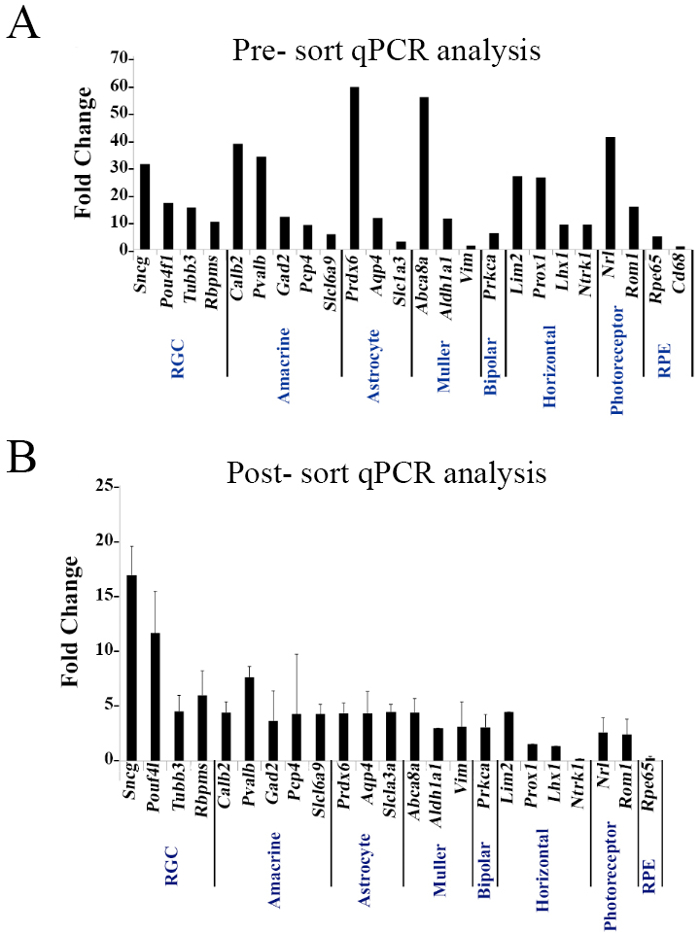
Figure 4. Pre- and Post-sorting mRNA Analysis. Thy1+CD48neg and sorted cells with the phenotype CD90.2+CD48negCD15negCD57neg were assessed by qPCR analysis using a panel of 25 genes expressed by retinal cells. Target gene expression levels are presented as a Log2-fold change using Hprt as a housekeeping gene and water as a negative control. The calculation was done based of the ΔCT method. Mean ± SEM; n = 3 biological replicates were performed in triplicate. Figures obtained from previously published work with permission23.
FACS is the technique of choice to purify cell populations. Other isolation methods include immunopanning, magnetic beads, and complement fixation depletion. The advantage of FACS over these other methodologies is based on the simultaneous identification of cell-surface markers with varying degrees of intensity. The fluorescent intensity of the molecule is proportional to the amount of protein expression. Until now, the isolation of RGCs was based solely on Thy1 (CD90) positivity and CD48 negativity15,16,22,34, regardless of the isolation method used. It has recently been shown that the Thy1+CD48neg phenotype is not sufficient to isolate a homogenous population of cells expressing RGC intracellular markers23. Identification of the RGC population is essential for their isolation, particularly because they comprise a small percentage of retinal cells7,8,9. The majority of RGCs are located in the innermost layer of the retina, while a small number are located in the inner plexiform layers (displaced RGCs35). Thus, tracing RGCs from the superior colliculi by stereotactic injections and tracing with hydroxystillbamidine (a retrograde tracer for outlining neurons) became attractive choices for many laboratories36,37,38. These systems require the injection of tracer, which, if not performed properly, may lead to some retinal regions left untraced. In addition, they are more technically demanding and, like other methodologies such as immunopanning, are lengthy. Immunopanning using the anti-Thy1 and -CD48 antibodies takes 48 h to complete and does not achieve more than 95% purity. This work describes a FACS-based methodology that offers a fast and reproducible protocol to isolate a homogeneous population of live RGCs with the CD90.2+CD48negCD15negCD57neg phenotype, without the use of any tracers, magnetic beads, or immunopanning techniques.
The following factors are required for the successful isolation of pure RGCs by FACS: 1) sort efficiency, which highly depends upon the equipment used; 2) optimal combination of antibody-tagged fluorochromes, to minimize noise; and 3) cell sorting setup. The sort efficiency is calculated by taking the number of target events selected for sorting divided by the number of target events detected, expressed as a percentage. The sort efficiency is a calculation provided by the equipment. This efficiency depends on the setup of the sorting system and the cell sorting mode. Choosing an optimal combination of fluorochromes is a complex process. Each fluorochrome has distinct properties and is characterized by its excitation and emission wavelengths. While the excitation is read with a laser, the emission is read by photomultiplier tubes, which are limited by the optical filters available in the FACS sorting equipment. Here, a combination of antibody-tagged fluorochromes PE, PE-Cyanine7, AF700, and BV421 is provided. This was determined after considering multiple fluorochrome combinations that provided the best resolution while reducing spectral overlap. Lastly, the sort setup is critical. In general, retinal cells are fragile. Thus, it is best to use a lower pressure to run the samples, to minimize the stress on the cells. It is critical to maintain the sample at 4 °C, because keeping murine RGCs for longer periods of time at room temperature can reduce the cell yield, especially when sorting large numbers of cells.
FACS-based sorting is an ideal methodology for the isolation of cells that make up a very small percentage of the cell suspension. The process, from retinal dissection to the completion of cell sorting, takes approximately 5 – 6 h, compared to immunopanning and tracer systems, which take days to complete. The multidimensional analysis of FACS and the ability of the equipment to collect several viable populations allows for further functional analyses of cells. The protocol described here is a powerful tool for the isolation of primary murine RGCs. Despite its multiple advantages, including its sensitivity, reproducibility, and the immediate identification of viable cells, there are some limitations. Firstly, it requires expensive instrumentation and a highly trained operator. Usually, the operator is an immunologist or a highly trained individual in the field, with whom is necessary to meet at the time of experiment setup. Nowadays, academic facilities have multiple core facilities, which may facilitate performing these types of experiments. Secondly, RGCs lose their typical morphology due to atoxomy, making them very small in size. At this time, it is not known if some of their genes may be modulated due to atoxomy.
The methodology presented here allows for the downstream analysis of RGC function in vitro and is a valuable tool to be used in the fields of visual and health sciences. Maintaining ganglion cell output to the brain is required for visual perception and is at risk in multiple diseases. These cells can be used for controlled in vitro experimentation, in both healthy and disease models. Electrophysiological, pharmacological, biochemical, and molecular studies can be performed on these cells, which is ideal for the development of future therapeutic targets.
The authors have nothing to disclose.
The authors would like to thank Mr. Tim Higgins, Senior Illustrator from the Department of Microbiology, Immunology and Biochemistry, for technical video assistance; Dr. Matthew W. Wilson for discussions and the members of the Jablonski and Morales-Tirado laboratories for their helpful comments. This work was supported by the Alcon Research Institute Young Investigator Award (VMM-T), the University of Tennessee Research Foundation (VMM-T), the National Eye Institute EY021200 (MMJ), the Gerwin Fellowship (VMM-T); the Gerwin Pre-doctoral Fellowship (ZKG), the Department of Defense Army Medical Research and Materiel Command (VMM-T), and the Unrestricted Grant from Research to Prevent Blindness.
Anti-mouse CD15 PE | BioLegend | 125606 | Clone MC-480 |
Anti-mouse CD48 PE-Cy7 | BioLegend | 103424 | Clone HM48-1 |
Anti-mouse CD57 | Sigma Aldrich | C6680-100TST | Clone VC1.1 |
Anti-mouse CD90.2 AF700 | BioLegend | 105320 | Clone 30-H12 |
Brilliant Violet 421 Goat Anti-mouse IgG | BioLegend | 405317 | Clone Poly4053 |
Purified Anti-mouse CD16/32 | BioLegend | 101302 | FcgRII/III block, Clone 93 |
Zombie Aqua | BioLegend | 423102 | Live cell/ Dead cell discrimination |
Fetal Bovine Serum | Hyclone | SH30071.03 | U.S. origin |
AbC Total Antibody Compensation Bead Kit | Thermo Fisher Scientific | A10497 | Multi-species Ig |
Neurobasal Medium | Thermo Fisher Scientific | 21103049 | Add serum to media prior to culture. |
Phosphate-Buffered Saline (PBS) | Thermo Fisher Scientific | 10010049 | Saline solution |
Dissection Microscope | Olympus | SZ-PT Model | Stereo Microscope |
Sorvall Centrifuge | Thermo Scientific | ST 16R | All centrifugation performed at RT |
Base Plate – Dissection Pan | Fisher Scientific | SB15233FIM | A wax plate can also be used |
Forceps | Aesculap | 5002-7 | 4 ½ inches |
Iris Scissors, Straight | Aesculap | 1360 | 5 ½ inches |
Falcon 15 mL conical tubes | Fisher Scientific | 352097 | Polypropylene tubes |
Falcon 50 mL conical tubes | Fisher Scientific | 352098 | Polypropylene tubes |
BD FACS Tubes | Fisher Scientific | 352003 | Polypropylene tubes |
40 mm dishes | MidSci | TP93040 | Tissue culture treated |
70 μm nylon strainer | MidSci | 70ICS | sterile |
40 μm nylon strainer | MidSci | 40ICS | sterile |
BD 10 mL syringe | Fisher Scientific | 301604 | Disposable Syringe without needle |
Pestles | MidSci | PEST | sterile |
Wheaton Vials | Fisher Scientific | 986734 | No Liner |
BD 30 G needle | Fisher Scientific | 305128 | 1 inch |
Hausser Scientific Bright-Line Glass Counting Chamber | Fisher Scientific | 0267151B | Hemocytometer |
Gibco Trypan blue 0.4% Solution | Fisher Scientific | 15250061 | Viability Dye |
Eppendorf tubes | Fisher Scientific | 05-402-25 | 1.5mL |
EVOS Floid Cell Imaging | Thermo Fisher Scientific | 447113 | Fluorescence Imaging with a 20x objective |
100% Ethanol | Fisher Scientific | 04-355-452 | Used to make 70% Ethanol |
Pipet-Lite LTS Pipette L-1000XLS+ | Rainin | 17014282 | LTS Pipette |
Pipet-Lite LTS Pipette L-200XLS+ | Rainin | 17014391 | LTS Pipette |
Pipet-Lite LTS Pipette L-20XLS+ | Rainin | 17014392 | LTS Pipette |
Rack LTS 1000 mL – GPS-L1000S | Rainin | 17005088 | Blue Rack Sterile Tips |
Rack LTS 250 mL – GPS-L250S | Rainin | 17005092 | Green Rack Sterile Tips |
Rack LTS 20 mL – GPS-L10S | Rainin | 17005090 | Red Rack Sterile Tips |
FACSAria II Cell Sorter | BD Biosciences | N/A | Custom order |
LSR II Cytometer | BD Biosciences | N/A | Custom order |
Abca8a | Thermo Fisher Scientific | Mm00462440_m1 | Müller cells |
Aldh1al | Thermo Fisher Scientific | Mm00657317_m1 | Müller cells |
Aqp4 | Thermo Fisher Scientific | Mm00802131_m1 | Astrocytes |
Calb2 | Thermo Fisher Scientific | Mm00801461_m1 | Amacrine, Horizontal |
Cd68 | Thermo Fisher Scientific | Mm03047340_m1 | Retinal Pigment Epithelial Cells |
Gad2 | Thermo Fisher Scientific | Mm00484623_m1 | Amacrine |
Hprt | Thermo Fisher Scientific | Mm01545399_m1 | House keeping gene |
Lhx1 | Thermo Fisher Scientific | Mm01297482_m1 | Horizontal |
Lim2 | Thermo Fisher Scientific | Mm00624623_m1 | Horizontal |
Nrl | Thermo Fisher Scientific | Mm00476550_m1 | Photoreceptors |
Ntrk1 | Thermo Fisher Scientific | Mm01219406_m1 | Horizontal |
Pcp4 | Thermo Fisher Scientific | Mm00500973_m1 | Bipolar, Amacrine |
Pou4f1 | Thermo Fisher Scientific | Mm02343791_m1 | Retinal Ganglion Cells |
Prdx6 | Thermo Fisher Scientific | Mm00725435_s1 | Astrocytes |
Prkca | Thermo Fisher Scientific | Mm00440858_m1 | Bipolar |
Prox1 | Thermo Fisher Scientific | Mm00435969_m1 | Horizontal |
Pvalb | Thermo Fisher Scientific | Mm00443100_m1 | Amacrine |
Rbpms | Thermo Fisher Scientific | Mm02343791_m1 | Retinal Ganglion Cells |
Rom1 | Thermo Fisher Scientific | Mm00436364_g1 | Photoreceptors |
Rpe65 | Thermo Fisher Scientific | Mm00504133_m1 | Retinal Pigment Epithelial cells |
Slc1a3 | Thermo Fisher Scientific | Mm00600697_m1 | Astrocytes |
Slc6a9 | Thermo Fisher Scientific | Mm00433662_m1 | Amacrine |
Sncg | Thermo Fisher Scientific | Mm00488345_m1 | Retinal Ganglion Cells |
Tubb3 | Thermo Fisher Scientific | Mm00727586_s1 | Retinal Ganglion Cells |
Vim | Thermo Fisher Scientific | Mm01333430_m1 | Müller cells |
Taqman Universal Master Mix | Thermo Fisher Scientific | 4440047 | qPCR Reagent |
miRNeasy Mini Kit | Qiagen | 217004 | RNA Isolation |
SuperScript VILO cDNA Synthesis Kit | Thermo Fisher Scientific | 11754250 | cDNA synthesis |
Taqman PreAmp Master Mix | Thermo Fisher Scientific | 4391128 | Pre-Amplification step |
BD Cytofix/ Cytoperm | BD Biosciences | 554714 | Fixation/ Permeabilization Buffer |
BD Perm/ Wash | BD Biosciences | 554723 | Permeabilization Solution |
RBPMS | Santa Cruz Biotechnology | sc-86815 | intracellular antibody |
SNCG | Gene Tex | GTX110483 | intracellular antibody |
BRN3A | Santa Cruz Biotechnology | sc-8429 | intracellular antibody |
TUJ1 | BioLegend | 801202 | intracellular antibody |