Here we demonstrate a novel approach to using high resolution spectral-domain optical coherence tomography (HR-SD-OCT) to assist delivery of gene therapy agents into the subretinal space, assess its areal coverage, and characterize photoreceptor vitality.
HR-SD-OCT is utilized to monitor the progression of photoreceptor degeneration in live mouse models, assess the delivery of therapeutic agents into the subretinal space, and to evaluate toxicity and efficacy in vivo. HR-SD-OCT uses near infrared light (800-880 nm) and has optics specifically designed for the unique optics of the mouse eye with sub-2-micron axial resolution. Transgenic mouse models of outer retinal (photoreceptor) degeneration and controls were imaged to assess the disease progression. Pulled glass microneedles were used to deliver sub retinal injections of adeno-associated virus (AAV) or nanoparticles (NP) via a trans-scleral and trans-choroidal approach. Careful positioning of the needle into the subretinal space was required prior to a calibrated pressure injection, which delivers fluid into the sub retinal space. Real time subretinal surgery was conducted on our retinal imaging system (RIS). HR-SD-OCT demonstrated progressive uniform retinal degeneration due to expression of a toxic mutant human mutant rhodopsin (P347S) (RHOP347S) transgene in mice. HR-SD-OCT allows rigorous quantification of all the retinal layers. Outer nuclear layer (ONL) thickness and photoreceptor outer segment length (OSL) measurements correlate with photoreceptor vitality, degeneration, or rescue. The RIS delivery system allows real-time visualization of subretinal injections in neonatal (~P10-14) or adult mice, and HR-SD-OCT immediately determines success of delivery and maps areal extent. HR-SD-OCT is a powerful tool that can evaluate the success of subretinal surgery in mice, in addition to measuring vitality of photoreceptors in vivo. HR-SD-OCT can also be used to identify uniform animal cohorts to evaluate the extent of retinal degeneration, toxicity, and therapeutic rescue in preclinical gene therapy research studies.
Researchers are developing gene therapies for a variety of retinal and retinal degenerative diseases with hopes of translating novel therapeutics into treatments for human disease1,2,3,4,5,6,7,8,9,10,11. Time domain or spectral domain optical coherence tomography (SD-OCT) has been used to investigate the aspects of outer retinal degeneration in specific mouse models of disease12,13,14. HR-SD-OCT has not, however, been extensively used in the context of optimizing evaluation of mouse models to determine the rate and spatial uniformity of retinal degeneration, or in the context of preclinical evaluation of gene based therapeutics, for example, to assess rescue, toxicity, or the spatial extent of vector delivery8,15,16. Once a mouse model is fully characterized, the HR-SD-OCT data can serve as an informative and reliable resource to measure the impact of therapeutics to exert rescue or toxicity in mouse models of retinal degeneration17. Many groups are using subretinal injection as a method of vector delivery due to its efficiency at transducing photoreceptors and retinal pigment epithelium (RPE) cells. However, this remains a difficult method to master, given that it is typically done by free-hand surgery from the corneal surface, and is often fraught with cataracts, bleeding, and unintended retinal detachments occurring simply by manipulation of the posterior vitreous. Many groups still attempt subretinal injections blindly and deliver the virus using manual injections with relatively large diameter stainless steel needles (34G)8,17,18,19,20,21,22, and a few uses optical coherence tomography (OCT) imaging to confirm proper delivery of vector to the retina8,17,20,22. Some improvements in the method have recently been described using microscale needles driven by a micromanipulator22.
We present an integrated approach which aids in the positioning of the needle, and the injections are facilitated by a custom directed stereo ophthalmoscope designed in the lab specifically for visualizing inside the small eye of the mouse17,23. The use of pulled glass micro needles in conjunction with the stereotaxic micromanipulator provide better control of needle placement with no surgical cut down required (i.e., through conjunctivae and connective tissue) prior to injection. The use of the pressure regulated micro injector helps deliver consistent injection volumes, and the injection can be done with much greater stability, precision, and much slower than manual injections performed by a hand-held syringe, thereby decreasing the occurrence of bubble injection into the eye. The smaller needle helps prevent leakage following needle withdrawal because the path is self-sealing. To assess the extent of injection/delivery, many investigative groups rely on finding and assessing the areal extent of enhanced green fluorescence protein (EGFP) expression in the retina (expression construct delivered by the vector) at the experimental end point (euthanasia) to confirm successful injections11,19,20,24. This approach (not utilizing OCT) to verify surgical success wastes an enormous amount of resources in surgical procedural time and animals, since all animals with (unknown) surgical failures need to be maintained, followed with repetitive measures until euthanasia and eye harvest (when EGFP is measured). Confirmation of the location of injection in the retina can be improved using HR-SD-OCT to demonstrate that the injection is located between the correct layers of the retina (i.e. the subretinal space). HR-SD-OCT can also be used to immediately delineate unsuccessful attempts (surgical failures) to identify relevant variables in real surgical time to improve upon the approach. We found that HR-SD-OCT provides numerous advantages in preclinical gene therapy studies by allowing rapid quantitative evaluation of outer retinal degeneration, allowing identification/culling of study animals which do not meet experimental criteria (e.g., incorrect subretinal injection), and to direct follow-up imaging to the region of the eye where vector was delivered (where preclinical effect is most likely) as well as control regions where vector was not delivered. Since its development, the use of SD-OCT has continued to be accepted and used by ophthalmology researchers and is now considered the standard of retinal imaging in retinal scientific studies in mouse or rodent models13,25. HR-SD-OCT and its software capabilities were utilized in unique integrated ways to further the goal of successful quantitative gene therapy in mouse models at every step in the process, including animal model selection, characterization of degeneration in chosen disease models, therapeutic delivery, mapping of vector delivery, and toxicity/efficacy evaluation. The use of HR-SD-OCT allows for more efficient drug discovery at every level of the process. Here we describe these approaches that are used in our RNA Drug Discovery program.
Animal protocols were reviewed and approved by the Institutional Animal Care and Use Committees of the VA WNY HCS and the University at Buffalo-SUNY. Animals were used according to the stipulations of the Association for Research in Vision and Ophthalmology (ARVO) and the Declaration of Helsinki.
1. Mouse Models
2. Mouse Eye Gel
3. HR-SD-OCT Imaging
4. Assessing the Presence, Rate, and Uniformity of Model Outer Retinal Degenerations
5. Intraocular Injections
NOTE: Details on use of the RIS are further elaborated in a recent study23.
Assessing the Presence, Rate and Uniformity of Model Outer Retinal Degeneration
Measurements of the ONL were recorded from the OPL to the ELM, defining the limits of the ONL using the caliper tool provided in the instrument software. The goal was to map the progression of outer retinal degeneration in a partially humanized adRP mouse model. Comparable images from a control C57BL/6(J) mouse and an hC1/hC1//mWT/mWT mouse model, expressing two copies of the mutant human rod opsin (RHOP347S) genes, were shown to exhibit both the control retinal findings and those of a severe and rapidly progressive retinal degenerative condition. The 3-week-old adRP (hC1 x BL/6(J)) animal, having only a single copy of the mutant human RHOP347S gene and two copies of the mouse WT RHO genes, had near normal ONL thickness. However, the follow-up HR-SD-OCT scans at 10 and 37 weeks demonstrated temporally progressive and spatially uniform retinal degeneration that resulted in approximately 60% loss of photoreceptors recognized as ONL thinning over this time frame. In the hC1 x BL/6(J) adRP model, the retinal degeneration has an approximate time constant (1/e) of 13 weeks. Homozygous hC1 animals, with two doses of the toxic mutant human transgene on the mouse WT RHO background, suffer a much more rapid degeneration as demonstrated by extensive retinal thinning and the essentially complete loss of all the photoreceptors by 3 weeks of age (Figure 2).
The ONL measure is only one component of outer retinal normality as an index of photoreceptor vitality. The OSL of the photoreceptors and the inner segment/outer segment (IS/OS) line or ellipsoid line provide evidence in support of both photoreceptor vitality and function. Comparisons in animals which have been bred to contain either one (N129R- x 129R-) or two (2HRho 1T1T) copies (doses) of the human WT RHO genes on the mouse WT RHO knockout background were measured for outer retina thickness. A statistically significant increase of ~8 µm in the ONL was observed in mice with two copies of the human WT RHO gene compared to mice with only one copy of the human gene. A statistically significant increase of ~5 µm in the OSL was observed in mice with two vs. one copy of the human WT RHO gene on the mouse WT RHO knockout background. An example of how ONL and OSL measurements were made is shown in Figure 3. The high resolution of the images captured with the HR-SD-OCT system allow accurate measurements of the ONL or OSL allowing discrimination of small differences with solid statistical reliability in the humanized WT RHO mouse models.
Range of Surgical Outcomes Detailed by OCT when Attempting Subretinal Injection
HR-SD-OCT evaluation of attempted subretinal injections yielded a variety of outcomes. First, the most common experience was confirmation that the injected fluid was successfully delivered within the sub-retinal space. The opening of the implicit subretinal space (which closes during development) created a bleb that could be clearly visualized both in the en face view of the HR-SD-OCT and in the b-scan images. The hypo-reflective fluid was bordered by the neural retina above, and the hyper-reflective RPE cell layer still opposed to BM, below (Figure 4). The extent of the subretinal injection could be determined if the animal was imaged by HR-SD-OCT immediately after injection (see below). Second, the injection could occur in the choroidal space (beneath BM) rather than into the subretinal space. This resulted in a hyper-reflective layer (RPE) bounding the dome of the fluid-displaced region of the retina, and no hyper-reflectivity at the posterior limits of the eye in the OCT b-scans. Third, another potential result that could occur while attempting subretinal injection was a retinal schisis (splitting) at the nerve fiber layer. This result yielded a normal outer retina anatomy, but the inner layer of the retina encapsulated the bleb, which may or may not have invaded the vitreous. In principle, such a schisis pattern could occur with injection anywhere within the laminations of the neural retina proper, but we have only seen nerve fiber layer schisis to date. Fourth,an intravitreal injection may also occur, which has no impact on the OCT. All of these failures result from the initial misplacement of the tip of the glass needle, or perhaps some small motion of the needle during injection, due to the pressure head of the switched flow injection device.
Characterizing the Location of Subretinal Injection
A critical factor in determining efficacy or toxicity of candidate therapies is the ability to compare retinal regions that have received vector vs those that have not. We directed significant efforts into developing a means to mark the region of the retina involved in the subretinal injections so that during follow-up examinations, we could identify the areal extent of the retina where therapies were applied, and hence where transduction was feasible. Gold NPs allowed a high level of confidence in identifying regions of the retina which were or were not injected. However, the specific particles or their formulation appeared to be toxic and resulted in a severe localized retinal degeneration at the site of subretinal injection by 24 hours post injection (data not shown). Therefore, we developed an alternative method of mapping the injection site directly from the HR-SD-OCT imaging data. A method for precisely identifying the injection site borders was developed using the measurement tools (calipers) in the software package of the instrument (Figure 5). We could identify the edge of the bleb precisely by examining the individual b-scans (from inferior to superior retina) used to create the fundus image. When placing a caliper at the point where the bleb intersects the attached retina, the position of the caliper is automatically mapped onto the corresponding b-scan of the en face fundus image at the precise position along the x-axis where the caliper was placed on the b-scan. Repeating this process allows one to trace the edge of the bleb onto an en face fundus image. The alignment process requires that similar regions of the retina are imaged every time, relative to the constant optic nerve head, and the images may need to be rotated to align the retinal blood vessels from the multiple images prior to data segregation. Following the alignment process of the post injection image and subsequent follow-up images, the injection region was superimposed over the data point grid to identify the position of the measurements within the region involved in the retinal detachment. This data could be plotted as a surface map, which provided a visual tool to identify data points inclusive of the injection site relative to regions outside of the injection site.
Mapping the ONL Thickness in 3D
Finally, we record measurements of the ONL, OSL, or other retinal layers from across the entire imaged region of the retina, and then plot the data using a surface plot (Figure 5). Superimposing the border map of the injection site allows the segregation of the two data sets, including the injected region and the region which was not detached during the injection process. Further processing and data analysis could then be performed on these two data sets to test hypotheses that specific therapeutic agents can rescue retinal degeneration or induce toxicity. This approach potentially allows for experimental and control data to be collected from a single eye, comparing injected vs non-injected regions of the same eye.
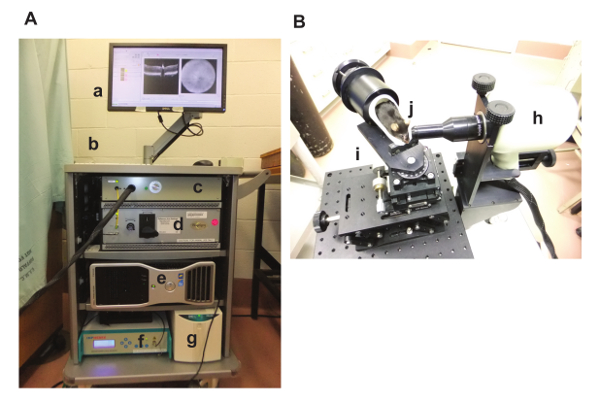
Figure 1: UHR-SD-OCT Device. The HR-SD-OCT device used is shown. The instrument rack (A) contains the computer monitor (a), the keyboard and mouse (b), the probe interface box (c), the OCT engine (d), the computer (e), the control device for the super luminescent emitting diodes (infrared) (f), and the uninterruptible power supply (g). The optical bench (B) contains the imaging probe optical head (for mouse retina) (h), the multi-axis (linear and rotational) manipulator (i), and a mouse subject (j). Please click here to view a larger version of this figure.
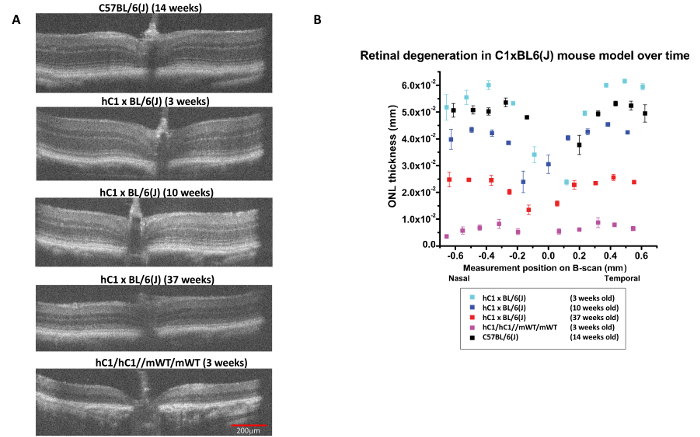
Figure 2: Progressive Outer Retinal Degeneration in partially humanized adRP model as measured by HR-SD-OCT. (A) HR-SD-OCT images of the retina were obtained for the adRP model (hC1 x BL/6 (J)) at different ages, the C57BL/6(J) control at 14 weeks, and the homozygous hC1 mutant line at 3 weeks. The outer retina had a normal appearance at 3 weeks in the adRP model, but there was evidence of progressive ONL thinning and disorganization at and beyond 10 weeks of age. By 37 weeks, the (hC1 x BL/6(J)) demonstrated extensive outer retinal degeneration. All OCT scans were in vicinity of optic nerve. (B) The ONL thickness (in mm) along the horizontal axis through the optic nerve was plotted for control (C57BL/6(J)), hC1, and adRP animals of differing ages. There was progressive loss of ONL thickness in the partially humanized adRP model. ONL loss was greater than 60% by 37 weeks of age. Error bars = standard error of the mean. Red scale bar = 200 µm and all the images are the same scale. Please click here to view a larger version of this figure.
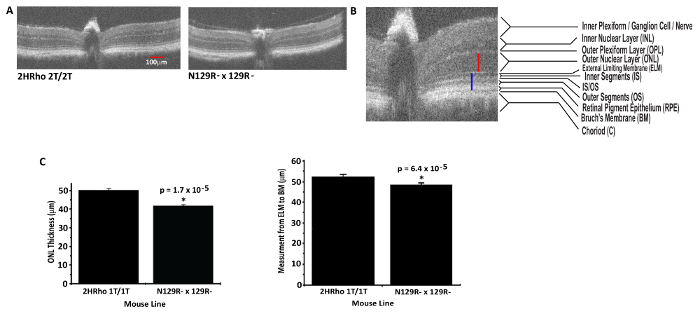
Figure 3: Quantitative measures of Outer Nuclear Layer and Outer segment length using HR-SD-OCT. (A) Mouse lines used to demonstrate ONL and OSL measures. Representative OCT images from 2HRho1T/1T (2 doses HRho) on mouse RHO knockout background) (Left panel) and N129R- x 129R- (one dose human RHO on mouse RHO knockout background)(Right panel). (B) An example of how calipers were placed to measure the ONL (red) and OSL (blue) is shown. (C) The data obtained from three animals of each line for ONL thickness was plotted in bar graph format showing comparison of 2HRho1T/1T line and N129R- x 129R- (Left panel). The 2HRho1T/1T line has ~8 µm thicker ONL. To demonstrate differences in OSL, multiple measurements (seven) were made from one b-scan from each mouse line from the ELM to the BM as in B (blue line) in 9-week-old animals (Right panel). This demonstrated a ~5 µm difference in the OSL between animals with 1 vs 2 copies of the HRho gene. Both ONL and the OSL measures were statistically significant, ONL p-value = 1.7e-5 and OSL p-value = 6.4e-5. Error bars = standard error of the mean. Red scale bar = 100 µm both the b-scans in 3A have the same scale, 3B is zoomed to improve clarity of the retinal layers and to provide a qualitative demonstration of how the measurements were acquired. Please click here to view a larger version of this figure.
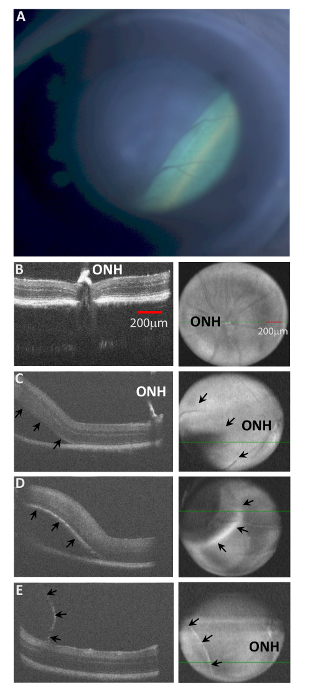
Figure 4: Types of intraocular Injections in mice identified by HR-SD-OCT. (A). A (hC1xBL/6(J)) mouse was injected with ~1 µL of fluid via Inferonasal transcleral transchoroidal injection. The resulting retinal detachment is seen as the green lower right region of the en face image, creating a sharp border at the leading edge of the bleb on the right side of the image. The OCT fundus image of an injection site only exhibits subtle differences depending upon the position of the fluid filled cavity, because the image is a compilation of all the b-scans from the entire retinal thickness. In addition, the injection bleb changes the distance of the retinal surface from the OCT headpiece, producing an unfocused region at the injection site. (B) The OCT b-scan of a non-injected retina is demonstrated. The ONH is labeled. (C) A subretinal injection is demonstrated. The ONH is labeled, and arrows in the en face image (right panels) show the posterior border of the detachment. (D) A choroidal injection is demonstrated with a clear elevation (upward displacement) of the RPE layer (hyper-reflective curve) of the lower border of the retina (arrows) and significant loss of hyper-reflectivity of the RPE and choroid layers below the injected fluid. Compare arrows in the images (C vs. D). (E) A retinal schisis is demonstrated near the nerve fiber layer. Observe the very thin hyper-reflective membrane encapsulating the injected fluid, while the retina remains attached to the RPE. Subtle differences between the three different detachments can also be visualized in the en face images (C, D, and E). The subretinal detachment has a border which is difficult to visualize (arrows in C), while the choroidal injection creates a blurred hyper reflective rim at the leading edge of the bleb, and the retinal schisis is evident by the sharp demarcation of its leading edge (E). Both red scale bars = 200 µm in 4B. All images 4B through 4E are scaled equally. Please click here to view a larger version of this figure.
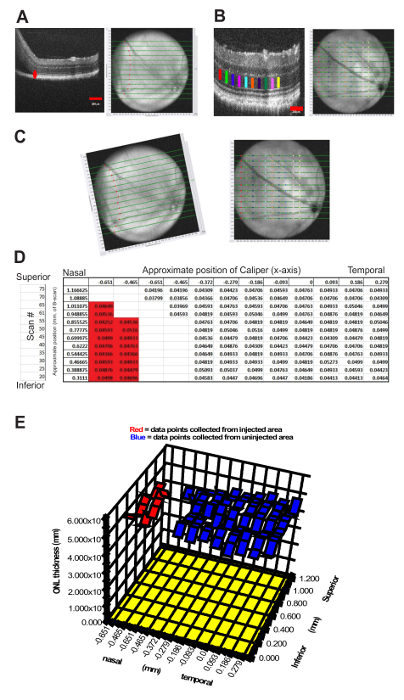
Figure 5: Mapping and Quantifying Outer Retinal Changes following Subretinal injection. A method was developed to identify regions of interest during follow-up examination of mice that had subretinal injection of vector, with 3D-plotting of ONL measurements from multiple OCT b-scans. A 2HRho1T/1T animal was injected with a self-complementary adeno-associated virus expressing both GFP and the lead candidate hammerhead ribozyme (scAAV-GFP ad6 hhRz 725) (OS eye) in a toxicity screen. (A) Imaged immediately following, the areal extent of the injection was mapped by placing calipers at the leading edge of the bleb at the point where the outer segments separate from the RPE in the b-scans (Left panel (red caliper)). The position of the caliper tool is automatically mapped to the fundus image, and this is repeated and compiled for as many b-scans as necessary, which depend upon the desired resolution (every 5th scan in (A) (right panel)). Subsequent OCT studies (every 2 weeks) imaged the same region of the retina to allow superimposition; the ONH and retinal blood vessels are landmarks to facilitate the Cartesian or rotational adjustments. The entire region of the retina was measured for ONL thickness provided the required boundaries (OPL and ELM) were visible. (B) To map the ONL length over the injected surface the caliper positions (color coded) are again mapped onto the fundus image and compiled into a composite image. Every 5th b-scan from the OCT images was measured with built-in calipers at up to ten points across the retina. (C) Pre- and post-compiled images are rotated, using imaging software to align retinal vasculature, which allows data points within the detached retinal region retina to be identified by image overlay and separated. (D) The data set is mapped into a table format, identical to the fundus image array, and divided into two groups (measurements within the bleb (red highlights) and those that are not). (E) Data is presented using a 3D surface plotting feature, which allows visualization of ONL thickness over the entire imaged region. This allows assessment of quantitative differences between injected and non-injected regions of the eye. The crevice in the 3D plot (E) provides a convenient way to segregate the data set of ONL measurements within the region of the detached retina from the region that remained attached immediately following injection. Please click here to view a larger version of this figure.
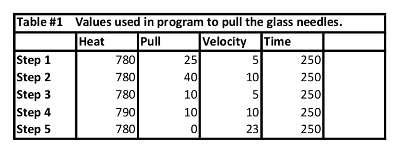
Table 1: Program used to pull the glass needles. Program parameters to achieve glass needles useful for subretinal by trans-scleral, transchoroidal approach.
HR-SD-OCT provides a simple method for characterization of potential animal models of human disease to determine their usefulness in testing potential therapeutics. The ability to quickly and reliably characterize a potential animal model of human disease is critical to the process of therapeutic drug discovery (e.g., replacement gene therapy, ribozyme or shRNA knockdown gene therapy, combined gene therapy). HR-SD-OCT provides a simple, quick, and non-invasive method for evaluating retinal health that can be used to characterize and monitor the progression of the retinal degeneration in almost any mouse model. The OCT images can be used to obtain measurements of any or all of the different layers of the retina, which may provide a detailed assessment of an outer retinal (photoreceptor) degeneration over time or the impact of therapeutic rescue attempts on the degeneration extent or kinetic timeline. HR-SD-OCT can also be used to assess toxicity of delivered vector or materials. The most significant impact on a photoreceptor retinal degeneration research program is the ability to make refined measurements of ONL over time in live animals. One can plot a retinal degeneration timeline to extract a time constant, which is a critical first step to evaluate the efficacy and toxicity of candidate therapeutics in the same models over a temporal window of therapeutic opportunity. This technology also allows for significant savings of precious resources (animals and time) relative to classical endpoint histology by allowing the researcher to identify abnormalities in the animal cohort prior to entering a study and eliminating animals that do not meet experimental criteria (e.g., successful subretinal delivery).
The need for precise delivery of certain therapeutics into the subretinal space of the mouse eye is challenging, and HR-SD-OCT provides an accurate visual confirmation of successful subretinal injections as a criterion for ongoing inclusion of animals in the pre-clinical study design. Extensive effort is required to frequently follow animals injected in gene therapy studies over time, since these models often simulate human retinal degenerative diseases where disease timelines emerge over decades. Numerous follow-up examinations are required to determine therapeutic efficacy or to assess toxicity. A solution to this critical challenge is to have the ability to identify and remove animals from study designs, which are surgical failures for delivery of the therapeutic vector. The ability to deliver a successful injection for a well-trained technician with years of experience has approached 90% if injecting one eye per animal, and approximately 80% success if injecting both eyes. With this efficiency level, removal from the study design of animals with unsuccessful injections is advantageous to hypothesis testing. This not only saves critical time but also allows for more consistent and predictable outcomes. Additionally, HR-SD-OCT allows one to decrease the number of animals required for any one experiment by allowing the same animals to be followed over time, which decreases the animal-to-animal variability in both experimental and control groups, and allows more robust statistical evaluation of hypotheses about the potential efficacy and toxicity of candidate therapeutics.
The extent of retinal coverage by a subretinal injection is typically not 100%, which may itself be toxic31,32,33,34. Hence, the ability to distinguish between transduced and non-transduced regions is critical to proper testing of hypotheses of rescue and toxicity for a given candidate therapeutic. The creative use of available software tools allows for precise mapping of subretinal injections in the mouse eye. The immediate imaging of the injected eye provides direction for follow-up imaging to regions of interest, and the ability to compare regions which have been transduced to regions which have not been treated within the same globe. Depending on the mapping precision desired, this process can be performed for each b-scan or periodically sampling from the ensemble of b-scans collected immediately post injection and compiling all the fundus images into a single image using graphics software so that the piecewise continuous border is carefully mapped onto the fundus image. Comparing the images from immediately after injection to follow-up images requires that the images be aligned so that measurement positions can be mapped onto the fundus image, and the data points can be segregated into injection site and non-injected regions of the retina. The mapping of the optic nerve head and the retinal blood vessels can also be accomplished using this same methodology, which aids in the orientation of the eye when attempting to align the post-injection images with subsequent follow-up images. This information can be used in subsequent imaging to identify the region of the retina where the injection had occurred. Of course, when the animals are euthanized, the location of EGFP expression, delivered by an AAV vector also containing a candidate therapeutic gene (e.g., ribozyme), can also be used to compare the location of transduction with the area determined by image mapping that relies on the location of blood vessels. This will allow the identification of diffusion of vector in the subsequently closed subretinal space beyond areas of anatomic detachment.
Our success with the use of gold NPs to label the subretinal bleb was limited due to toxicity induced by the materials used. We would encourage further investigation of such materials to label the extent of subretinal blebs, if alternative preparations (varying dimensions, surface modifications) can be found that do not induce toxicity.
The HR-SD-OCT provides an enormous amount of information with significantly less time and resources, and can be quantitated to provide more information about efficacy and toxicity of potential therapeutics compared to traditional methodologies like histology. The use of this technology enables the researcher to alleviate one of the severe bottlenecks in preclinical retinal drug discovery35. The mouse RIS and HR-SD-OCT are powerful tools to aid preclinical retinal gene therapy studies as a component of our RNA Drug Discovery program. These tools can be broadly applied.
The authors have nothing to disclose.
This material is based upon work supported, in part, by the Department of Veterans Affairs (VA), Veterans Health Administration, Office of Research and Development (Biomedical Laboratory Research and Development) (VA Merit Grant 1I01BX000669). JMS is employed, in part, as Staff Physician-Scientist, Ophthalmology, by VA WNY; MCB is employed, in part, by VA WNY. The study was conducted at, and supported in part by, the Veterans Administration Western New York Healthcare System (Buffalo, NY). Contents do not represent the views of the Department of Veterans Affairs or the United States Government. Also supported, in major part, by NIH/NEI R01 grant EY013433 (PI: JMS), NIH/NEI R24 grant EY016662 (UB Vision Infrastructure Center, PI: M Slaughter, Director- Biophotonics Module: JMS), an Unrestricted Grant to the Department of Ophthalmology/University at Buffalo from Research to Prevent Blindness (New York, NY), and a grant from the Oishei Foundation (Buffalo, NY). We acknowledge the gift of the hC1 transgenic RHOP347S line and the exon 1 mouse RHO knockout from Dr. Janis Lem (Tufts New England Medical Center, Boston, MA), and the gift of the NHR-E transgene model in the heterozygous state on the mouse exon 2 RHO knockout background from Drs. G. Jane Farrar and Peter Humphries (Trinity College, Dublin, IRE).
C57BL6 (J) | Jackson Laboratories | 664 | |
N129R- | N/A | N/A | |
2HRho 1T/1T | N/A | N/A | |
Envisu R-2200 Ocular Coherence Tomography Instrument (OCT) | Bioptigen | 90-R2200-U1-120. | |
Retinal Imaging System (RIS) | In-house | N/A | |
Stemi 2000C Microscope | Zeiss | 000000-1106-133 | |
P-97 Flaming/Brown micropipette puller | Sutter Instrument Co | p-97 | |
MMN-33 micro manipulator | Narishige USA | MMN-33 | |
PLI-100 micro injector | Harvard Apparatus | 64-1736 | |
Micropipette Holder (Rotating) | In-house | N/A | |
Micropipette Storage Receptacle | World Precision Instruments Inc. | E210 | |
Borosilicate glass capillary tubes 1.5-1.8 X 100mm, | Harvard Apparatus | 30-0053 | |
2,2,2-Tribromoethanol | SIGMA Aldrich | T48402-25G | |
Tert-amyl Alcohol | SIGMA Aldrich | 240486-100ML | |
Atropine Sulfate Ophthalmic Solution, USP 1% | Akorn Inc. | NDC 17478-215-05 | |
Goniovisc | BioVision Limited | NDC 17238-610-15 | |
Cyclopentolate Hydrochloride Ophthalmic Solution, USP 2% | Akorn Inc. | NDC 17478-097-10 | |
Gentamicin Sulfate Ointment USP, 0.1% | Perigo | NDC 45802-046-35 | |
Systane Ultra | Alcon Laboratories, Inc. | 9006619-1013 | |
Tetracaine Hydrochloride | Bausch and Lomb | NDC 24208-920-64 | |
Ophthalmic Solution, USP 0.5% | Bausch and Lomb | NDC 24208-920-64 | |
DPBS | Gibco Life Technologies | 14190-136 | |
Virus Preparations | ViGene /UNC | N/A | |
Gold nanorods | NANOPARTz | D12M-850-1.75 | |
Fluorescein Sulfate AK-FLUOR 25% | Akorn Inc. | NDC 17478-250-20 | |
Coverslips | Fisher Scientific | 12-548-A | |
Forceps | Milton | 18-825 | |
Needles 30 guage | Beckton Dickenson | W11604 | |
Syringes | Beckton Dickenson | 309659 | |
Bioptigen software Package | Bioptigen | N/A | |
Proparacaine Hydrochloride Ophthalmic Solution, USP 0.5% | Akorn Inc. | NDC 17478-263-12 | |
Windows Excel | Microsoft | N/A | |
Adobe Illustrator | Adobe | ||
Scale | Mettler | ||
Scissors | World Precision Instruments | ||
Ear punch | Nat’l band | ||
CL 100 Light source | Welch Allyn | CL100 | |
Nitrogen Gas | Jackson Welding Supply | N/A | |
Heated Water bath | Neslab | RTE-140 | |
Heating plate | In House | N/A | |
Heating mat | Cincinnatti Sub Zero | 273 | |
Clay mouse holder | Plast.i.clay American Art Clay Co. | N/A | |
Betadine | MedLine | NDC53329-938-06 | |
Cotton Tip Applicators | American Health Service | Ctag | |
EtOH 70% | Fisher Scientific | BP2818-100 | |
Gloves Nitrile | VWR | 89038-272 | |
Diagnosys ERG Color Dome instrument | Diagnosys Inc. | D125 | |
Contact lenses | In-house | N/A | |
Diagnosys Software | Diagnosys Inc. | N/A | |
Origin 6.1 software | OriginLab Corp. | N/A | |
Reference electrodes | Ocuscience | F-Thread Electrode (DTL) 24” |