Cancer Side Population Discrimination Assay: A Method to Isolate Cancer Stem-like Cells Using Hoechst Dye Efflux Assay
Abstract
Source: Gilormini, M. et al. Isolation and Characterization of a Head and Neck Squamous Cell Carcinoma Subpopulation Having Stem Cell Characteristics. J. Vis. Exp. (2016)
In this video, we describe the isolation of a subpopulation of cancer stem-like cells from head and neck squamous carcinoma cell lines using fluorescence-activated cell sorter or FACS. The isolated side population of cells can be used for further downstream analysis.
Protocol
1. Selection of a Side Population (SP) by the Hoechst Dye Efflux Assay
- Staining 50 million cells with Hoechst 33342 dye
- Prepare two 15 mL sterile tubes with a conical bottom: one tube labeled "Hoechst", and the other labeled "Hoechst and Verapamil". Prepare 10 mL of 5 mM Verapamil hydrochloride solution in sterile water. Prepare the culture medium (CM) for stem cells.
- To prepare CM for CSC (CM-CSC), combine the following: Dulbecco's modified Eagle medium (DMEM):F12 (1:3, v:v), 5% of fetal calf serum (FCS), 0.04 mg/L of hydrocortisone, 100 U/mL of penicillin, 0.1 g/L of streptomycin, and 20 µg/L of Epidermal Growth Factor (EGFR).
- Under a laminar flow hood, trypsinize cells. Remove media, wash with sterile phosphate buffered saline (PBS), and add 1 mL of trypsin-EDTA (0.5 g/L) for a 75 cm² flask. Incubate 3 min at 37 °C. Stop the reaction by adding a culture medium used for the parental cell line. Count the number of cells using a cell counter.
- To prepare CM for the parental cell line (CM-P), supplement DMEM with 10% FCS, 0.4 mg/L of hydrocortisone, 100 U/mL of penicillin, and 0.1 g/L of streptomycin).
- Dilute the cell suspension obtained in step 1.1.2 to obtain 107 cells/mL in CM-P. Split the cell suspension in the two tubes prepared: put 100 µL (106 cells) in the tube "Hoechst and Verapamil" and 4 mL (4 x 10⁷ cells) in the tube "Hoechst".
- In the sample "Hoechst and Verapamil", add 10 µL of 5 mM Verapamil hydrochloride solution (final concentration: 0.5 mM) and mix gently. Add 5 µL of 1 g/L Hoechst solution (final concentration: 0.1 g/L). In the sample "Hoechst", add 5 µL of 1 g/L Hoechst solution per 106 cells (200 µl total). Henceforth, keep samples protected from direct light exposure using aluminum foil.
- Incubate all tubes in a water bath at 37 °C for 1 h 30 min. Mix gently every 15 min to prevent cells from settling down.
- Centrifuge tubes at 250 x g for 5 min at 4 °C. Remove supernatant and resuspend each pellet with 2 mL of 1x PBS.
- Centrifuge tubes at 250 x g for 5 min at 4 °C. Remove supernatant. Resuspend the "Hoechst and Verapamil" pellet in 500 µL of 5 mg/L propidium iodide (PI) diluted in PBS buffer and "Hoechst" pellet in 4 mL of 5 mg/L PI diluted in PBS buffer.
- Transfer sample solutions through a 70 µm cell strainer to remove aggregates and collect single cells in tubes for sample uptake on the flow cytometer. Keep samples on ice and protect from direct light exposure using aluminum foil.
- Prepare two 15 mL sterile tubes with a conical bottom: one tube labeled "Hoechst", and the other labeled "Hoechst and Verapamil". Prepare 10 mL of 5 mM Verapamil hydrochloride solution in sterile water. Prepare the culture medium (CM) for stem cells.
2. Isolation of the Side Population Excluding Hoechst Dye by Cell Sorting
- Perform Hoechst negative cell separation on a flow cytometry sorter with the following parameters: UV laser (355 nm), two detectors on the UV laser path with blue Hoechst (450/50 BP) and red Hoechst (610/20 BP) filters, and two collectors.
- First, analyze the sample "Hoechst" that serves as a positive control for staining and flow cytometer set-up.
- Using the cytometer software, on the "Global Worksheet" window, click on "Dot Plot" (fifth top right picture) and create a chart on the global worksheet. On ordinate, with a right click, select FSC-A (forward scatter) and on abscissa, SSC-A (side scatter) (Figure 1A). In the same way, create an SSC-W versus SCC-H dot plot. On this second dot plot, to create a P1 region, click "Polygon gate" (fourteenth top right picture) (Figure 1B).
NOTE: The P1 region will encompass single cells and discriminate doublets. - Optional: Exclude PI positive cells by creating an FSC-A versus PI gated on P1. On this dot plot, select the PI negative population (P2) to exclude PI positive dead cells.
- Using the cytometer software, on the "Global Worksheet" window, click on "Dot Plot" and create a chart on the global worksheet. On ordinate, with a right click, select blue Hoechst-A and on abscissa, red Hoechst-A. With a right click on the population, select "Show population" and P1. On this dot plot, create a region (P2) to select the negative Hoechst dye side population (SP) cells that appear as a side arm on the left of the main population of cells (Figure 1C).
- Analyze the sample "Hoechst" and collect 10,000 events. To ensure that the gate P2, which represents the SP population, is well positioned, analyze the sample "Hoechst and Verapamil" (10,000 events) to observe the disappearance of the SP population (Figure 1D).
- Collect the SP Hoechst dye negative cells in a 15 mL tube containing 1 mL of CM-CSC prepared in step 1.1.1.
- At the end of the cell sorting, centrifuge the cell suspension at 250 x g for 5 min, remove the supernatant and resuspend the pellet with 1 mL of CM-CSC. Count the number of sorted cells using a cell counter and transfer an appropriate number of cells to a culture flask (see Table 1). Add CM-CSC and incubate at 37 °C and 5% CO2 atmosphere.
- Maintain cells in culture under the same conditions for a maximum of two passages until there is a minimum of 5 x 10⁷ cells.
Table 1: Culture flask type to use according to the number of cells sorted. Details of the culture flask size for an approximate number of cells sorted are given. The volume of trypsin and volume of medium required for the culture flask type are also provided.
| Number of cells sorted | Culture flask type | Trypsin Volume (mL) | Culture Medium Volume (mL) |
| 10,000-200,000 | 1 well of a 6-well plate or a 3.5 cm petri dish | 0.5 | 2 |
| 200,000-1,000,000 | 1 T25 culture flask | 1 | 4 |
| >1,000,000 | 1 T75 culture flask | 2 | 10 |
Representative Results
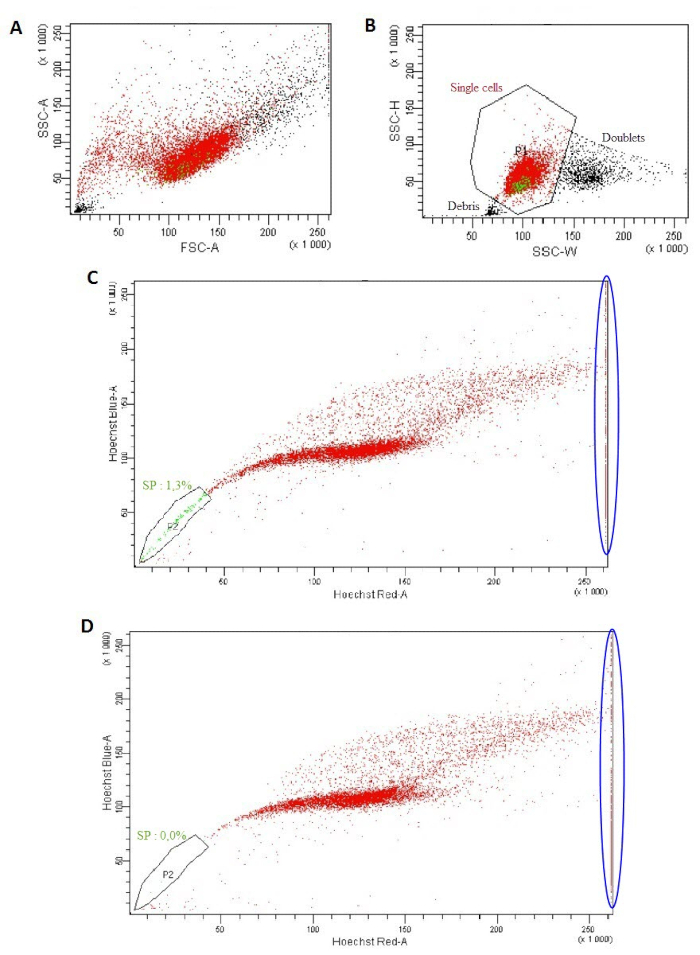
Figure 1: Isolation of a side population excluding the Hoechst dye. (A) FSC-A versus SSC-A dot plot. (B) SSC-W versus SSC-H dot plot. (C, D) Hoechst Red-A versus Hoechst Blue-A dot plot using the "Hoechst" tube (C) or with the "Hoechst and Verapamil" tube (D).
Disclosures
The authors have nothing to disclose.
Materials
| Fetal Calf Serum Gold | GE Healthcare | A15-151 | |
| Hydrocortisone water soluble | Sigma-Aldrich | H0396-100MG | |
| Penicillin/Streptomycin 100x | Dominique Dutscher | L0022-100 | |
| DMEM | Gibco | 61965-026 | |
| F12 Nut Mix (1x) + GlutaMAX-I | Gibco | 31765-027 | |
| EGF | Promega | G5021 | The solution must be prepared just before use because it is very unstable |
| Heparin | StemcellTM Technologies | 7980 | |
| B-27 Supplement (50x), minus vitamin A |
Gibco | 12587-010 | |
| Penicillin/Streptomycin 100x | Dominique Dutscher | L0022-100 | |
| DMEM | Gibco | 61965-026 | |
| B-27 Supplement (50x), minus vitamin A |
Gibco | 12587-010 | |
| Hoechst 33342 | Sigma-Aldrich | 14533 | Corrosive, acute toxicity (oral, dermal, inhalation) category 4 |
| Verapamil hydrochloride | Sigma-Aldrich | V-4629 | Acute toxicity (oral, dermal, inhalation) category 3 |
| Propidium Iodide | Sigma-Aldrich | P4170 | Acute toxicity (oral, dermal, inhalation) category 4 |
| SQ20B cell line | Gift from the John Little’s Laboratory |
– | |
| FaDu cell line | ATCC | HTB-43 | |
| BD FACSDiva software v8.0.1 | BD Biosciences | – |
