Enzymatic microelectrode biosensors enable real-time measurements of extracellular cell signaling in biologically-relevant concentrations. The following protocols extend the applications of biosensors to the ex vivo and in vivo detection of ATP and H2O2 in the kidney.
Enzymatic microelectrode biosensors have been widely used to measure extracellular signaling in real-time. Most of their use has been limited to brain slices and neuronal cell cultures. Recently, this technology has been applied to the whole organs. Advances in sensor design have made possible the measuring of cell signaling in blood-perfused in vivo kidneys. The present protocols list the steps needed to measure ATP and H2O2 signaling in the rat kidney interstitium. Two separate sensor designs are used for the ex vivo and in vivo protocols. Both types of sensor are coated with a thin enzymatic biolayer on top of a permselectivity layer to give fast responding, sensitive and selective biosensors. The permselectivity layer protects the signal from the interferents in biological tissue, and the enzymatic layer utilizes the sequential catalytic reaction of glycerol kinase and glycerol-3-phosphate oxidase in the presence of ATP to produce H2O2. The set of sensors used for the ex vivo studies further detected analyte by oxidation of H2O2 on a platinum/iridium (Pt-Ir) wire electrode. The sensors for the in vivo studies are instead based on the reduction of H2O2 on a mediator coated gold electrode designed for blood-perfused tissue. Final concentration changes are detected by real-time amperometry followed by calibration to known concentrations of analyte. Additionally, the specificity of the amperometric signal can be confirmed by the addition of enzymes such as catalase and apyrase that break down H2O2 and ATP correspondingly. These sensors also rely heavily on accurate calibrations before and after each experiment. The following two protocols establish the study of real-time detection of ATP and H2O2 in kidney tissues, and can be further modified to extend the described method for use in other biological preparations or whole organs.
Enzymatic microelectrode biosensors (also referenced as sensors in the present manuscript) have been a valuable tool for studying dynamic signaling processes in living cells and tissues. The sensors provide increased temporal and spatial resolution of cell signaling molecules in biologically relevant concentrations. Instead of sampling and analyzing extracellular fluids taken at intervals over long periods of time, these sensors respond as fast as their enzymes react to the analyte, thereby producing real-time measurements1,2. Fast detection of interstitial concentrations of autocrine and paracrine factors, like purines or hydrogen peroxide, and the dynamics of their release can be used to establish a profile for the effects of drugs in normal and pathological conditions 3. Currently, the majority of applications using sensors have been in brain tissue slices and cell cultures4-10. The protocols detailed in this manuscript aim to establish the means to accurately measure real-time concentrations of analytes in whole kidneys.
The following protocols were developed to study interstitial ATP and H2O2 signaling in kidneys. In the native environment of the kidney, extracellular ATP is rapidly catabolized by endogenous ectonucleotidases into its derivatives (ADP, AMP and adenosine). The sensors used here are highly selective to ATP over other purines or ATP degradation products11. This offers a great advantage as it allows accurate monitoring of the constant and dynamic concentrations of ATP release and its signaling function. Interstitial ATP concentration is measured using the combination of two microelectrodes, an ATP sensor and a Null sensor. The Null sensor in combination with catalase applications is able to detect interstitial H2O2 concentrations12. The following protocols use two different designs of sensors that have characteristics optimal for either ex vivo or in vivo applications.
Both designs are based on the sequential catalytic reaction of glycerol kinase and glycerol-3-phosphate oxidase contained in a sensor enzymatic layer and is driven by the presence of ATP. In the set of sensors used in the ex vivo studies, H2O2, the final enzymatic reaction product, is detected by oxidation on a platinum/iridium (Pt-Ir) wire electrode. Sensors for in vivo studies are instead based on H2O2 reduction on a mediator coated gold electrode designed for blood-perfused tissue. Shown in Figure 1 is a scheme of both protocols described in this manuscript. The Null sensor is identical to its corresponding ATP sensor except it lacks the bound enzymes. Therefore, in addition to the detection of H2O2 with the catalase enzyme, the Null sensor measures nonspecific interferences. ATP concentrations are calculated by subtracting the Null detected nonspecific interferences and background H2O2 from the ATP sensor signal. Several sensors are also commercially available to detect other analytes including adenosine, ionosine, hypoxanthine, acetylcholine, choline, glutamate, glucose, lactate, d-serine for ex vivo applications or adenosine, ionosine, and hypoxanthine for in vivo when paired with the corresponding Null sensor.
The ability of the sensor to accurately detect analytes depends on the proper pre- and post- calibrations13. This ensures that the analysis accounts for the drift in sensor sensitivity that occurs during use in biological tissues. The sensor holds a depot of glycerol that is used as a reagent in the sensor enzymatic reactions. If the sensor is not used in bath solutions containing glycerol, it will wash out over time. Shorter recording times are then necessary to minimize the sensor drift. Additionally sensor fouling by endogenous proteases and protein fragments can greatly diminish the sensitivity of the sensors14.
The present manuscript establishes the use of enzymatic microelectrode biosensors for ex vivo and in vivo kidney preparations. Real-time analyte quantification provides unprecedented detail of cellular signaling that may reveal novel insights into the mechanisms of kidney diseases and pharmacological agents.
The following animal procedures adhered to the NIH Guide for the Care and Use of Laboratory Animals. Prior approval was obtained from the Institutional Animal Care and Use Committee (IACUC).
NOTE: Review of the sensor manufacturer instructions should be done during the experiment design and prior to their use. Following these instructions will produce optimal results when using the sensors.
1. Sensor Calibration
2. Animal Surgery For Sensor Studies
3. Data Acquisition Setup
4. Data Analysis
The design of the enzymatic microelectrode biosensor allows the real-time detection of analytes in whole kidneys. The general experiment design for either ex vivo or in vivo studies is illustrated in Figure 1.The sensors used and the surgical procedures differ depending on whether the study is ex vivo or in vivo.
To obtain reproducible results, accurate pre- and post- calibrations are critical. Figure 6A shows a representative trace of the signal seen from the ex vivo ATP sensor during calibrations. Note that apyrase quickly eliminated the ATP signal. Catalase had no effect on the ATP signal and demonstrates its specificity to the H2O2 it creates (Figure 6B). The calibration procedure produces a linear fit that is used to calculate the dynamic changes of ATP (Figure 6A, right panel). In vivo sensor calibration produces a similar trace to that of the ex vivo sensor. However, this sensor detects reductive instead of oxidative currents and as such the current produced is negative. Calibration of these sensors also produces a linear fit in a 0.3 to 80 µM range (Figure 7A right panel). Specificity of in vivo sensor to ATP over other purine products is shown in Figure 7B.
The approach described here allows us to measure both basal levels of endogenous substances and acute changes in response to drug infusion12. Shown in Figure 11 are Ang II-induced changes of interstitial endogenous concentration of H2O2 in salt-resistant and salt-sensitive rats. For these experiments, freshly isolated kidneys from Sprague Dawley (SD) or Dahl salt-sensitive (SS) rats were perfused with 1 µM Ang II under constant laminar flow (650 µl/min). As shown in Figure 11, Ang II induces the acute release of H2O2 in kidneys from both SD and SS rats. However, the maximum amplitude of each response was significantly elevated in SS rats, especially when the animals were fed with a high salt diet12. Shown in Figure 12 is a representative application of the biosensors in vivo. The infusion of catalase (5 µg/ml) completely blocks the H2O2 signal detected by the biosensor. These experiments illustrate the use of specific enzymatic biosensors combined with the amperometric technique for the detection of basal levels of endogenous substances and real-time measurements of their release in response to pharmacological intervention. Further applications of this approach to study the role of purinergic signaling and hydrogen peroxide will improve our knowledge and understanding of renal pathologies like salt-sensitive hypertension, renal oxidative stress and chronic kidney disease.
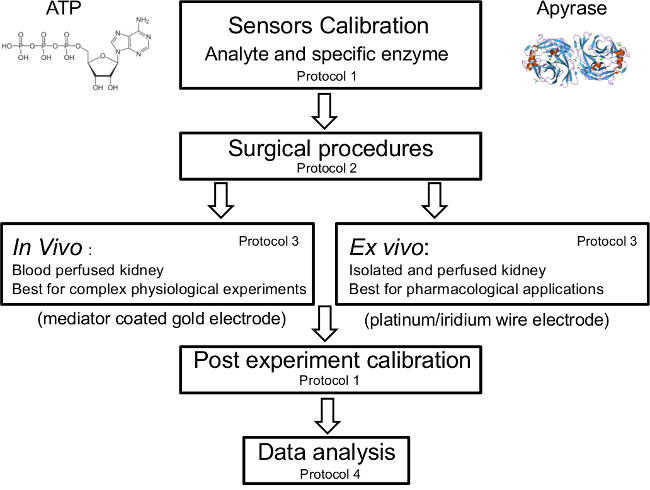
Figure 1. Schematic of the Protocols. Calibration with analyte of interest and testing its specificity is done immediately prior to the start of the experiments. The in vivo protocol should be followed for complex physiological experiments and ex vivo for pharmacological applications. Post experiment calibration should be done and taken into account during the data analysis. Please click here to view a larger version of this figure.
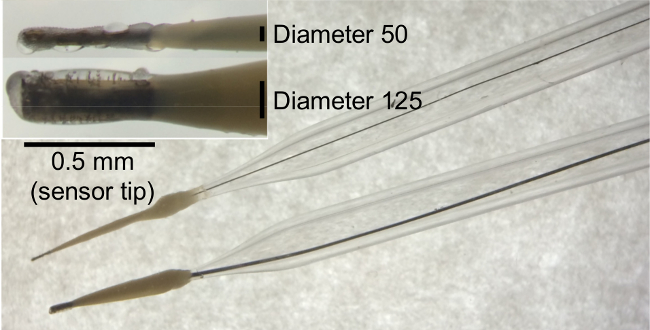
Figure 2. Enzymatic Microelectrode Sensor. The two sensor sizes used for ex vivo applications are shown, 50 µm and 125 µm diameters. Each sensor wire extends into a capillary tube to connect to a gold end connector (not shown). Inset shows a sensor tip coated with enzymes for ATP detection. Please click here to view a larger version of this figure.
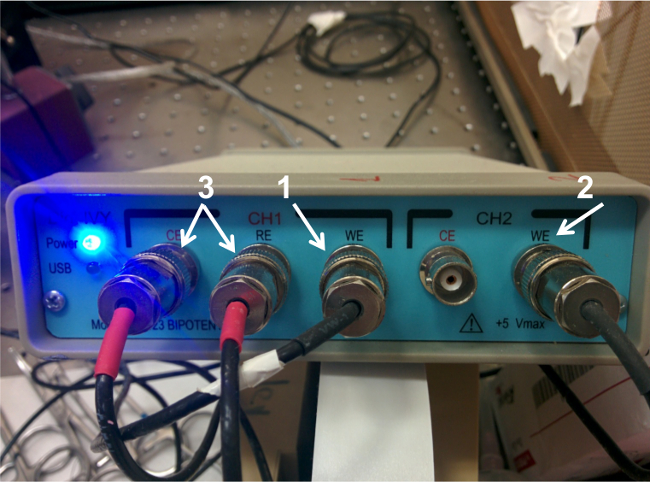
Figure 3. Dual Channel Potentiostat. The potentiostat channels labeled CH1 and CH2. 1) CH1 the ATP sensor connection and 2) CH2 the Null sensor connection 3) connections that are electrically coupled to the reference electrode. Please click here to view a larger version of this figure.
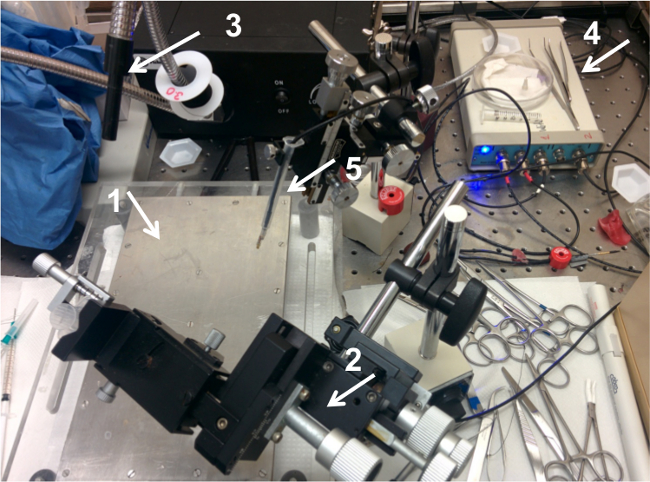
Figure 4. Sensor Setup. The data acquisition is performed in a Faraday cage to reduce electrical noise and on a high-performance lab table for a vibration-free working surface. 1) A temperature-controlled surgical table is used to maintain animal body temperature during physiological experiments 2) the micromanipulators are attached to magnetic mounting adaptors for flexible positioning of the sensors during experiment 3) A light source is needed for surgical procedures and sensor insertion 4) dual channel potentiostat 5) holder for the sensors. Please click here to view a larger version of this figure.
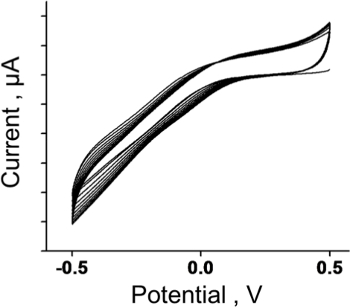
Figure 5. Cyclic Voltammetry. For ex vivo studies, sensor cyclic voltammetry is conducted for 10 cycles between -0.5 and 0.5 V prior to the calibration protocol. Please click here to view a larger version of this figure.
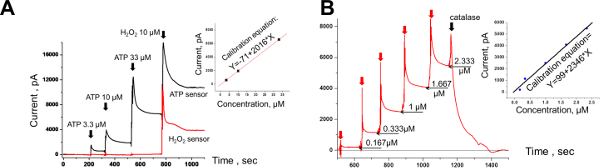
Figure 6. Amperometry Calibration for Ex Vivo. (A) Calibration uses the addition of known ATP concentrations to the bath solution. Corresponding amperometric values recorded at the asymptote level (black trace). The currents obtained create a calibration equation. An example is shown on the right panel. The red trace is the current of the Null sensor which responds to only the addition of H2O2. (B) The Null sensor is calibrated with the addition of known H2O2 concentrations (red arrows) to the bath solution and the asymptotes amperometric values are recorded (thin black arrows). Addition of catalase to the bath solution (thick black arrow) results in rapid current decay. The right panel shows the Null sensor calibration equation. Please click here to view a larger version of this figure. Please click here to view a larger version of this figure.
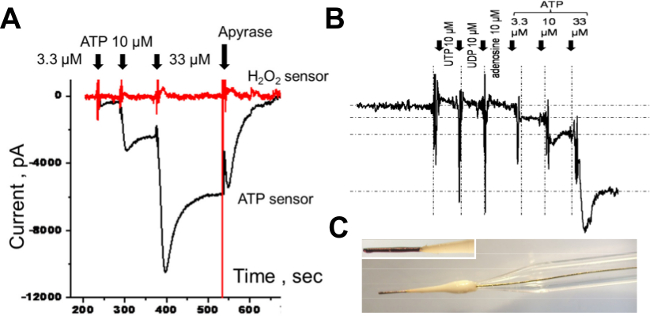
Figure 7. Amperometry Calibration for In Vivo. Calibration of the in vivo electrodes is performed in a similar fashion to that detailed in the ex vivo studies except reduction reactions cause a reverse current (polarity). (A) The addition of known ATP concentrations produces an amperometric current on the ATP sensor (black trace) but has no effect on the Null sensor (red trace). Addition of apyrase extinguishes the current of the ATP sensor. (B) The specificity of the ATP sensor is confirmed by the addition of 10 µM of different purinergic agents (UTP, UDP and adenosine). Further applications of ATP provide a stable detectable amperometric current. (C) Microphotograph of the in vivo sensors based on a mediator coated gold electrode. Please click here to view a larger version of this figure.
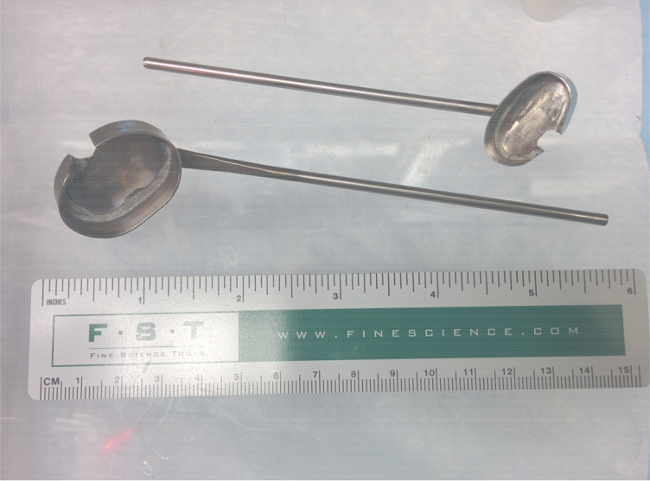
Figure 8. Kidney Cups. In the in vivo studies, kidneys are held still using the stainless steel kidney cups shown. Two sizes of cups are used to accommodate kidney size variation. These cups reduce the movement artifacts which are generated by the animal’s respiration. Please click here to view a larger version of this figure.
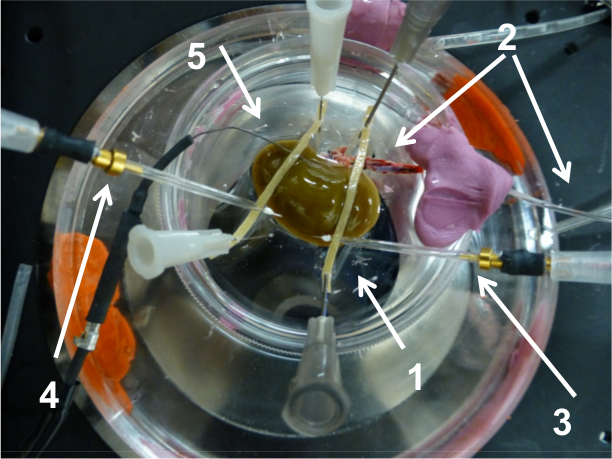
Figure 9. Ex Vivo Isolated and Perfused Kidney. The isolated kidney is placed into a 1) Petri dish coated with a thick silicone bottom for pin insertion 2) the renal artery is cannulated and attached to a syringe pump for constant perfusion during experiment 3) the ATP sensor, 4) and Null sensor are inserted into the kidney 5) the reference electrode is placed near the kidney submerged into the bath solution. Please click here to view a larger version of this figure.
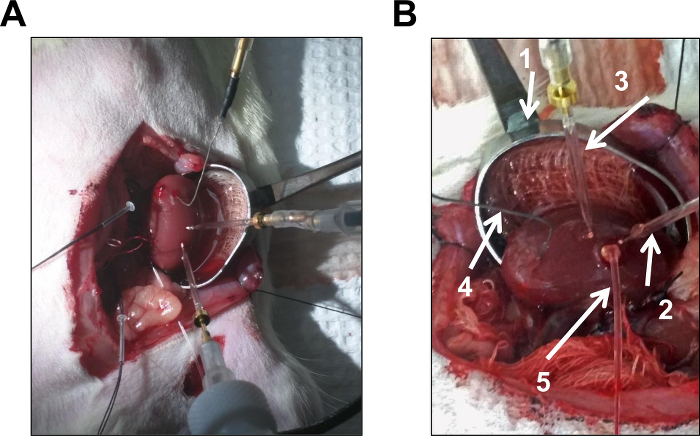
Figure 10. In Vivo Blood Perfused Kidney. (A) The left kidney is exposed and placed in a kidney cup, the right kidney remains intact inside the animal. Both sensors are inserted into the kidney. BSA:NaCl is infused via the catheterized jugular vein to counteract the fluid loss caused by the large mid-line incision (B) Example of the in vivo experiment with an implanted interstitial catheter for direct pharmacological applications 1) the kidney is held by a kidney cup 2) ATP sensor 3) Null sensor and 4) reference electrode are inserted into the ventral surface of the kidney 5) catheter implanted into the kidney and attached to a peristaltic pump for laminar pharmacological infusions. Please click here to view a larger version of this figure. Please click here to view a larger version of this figure.
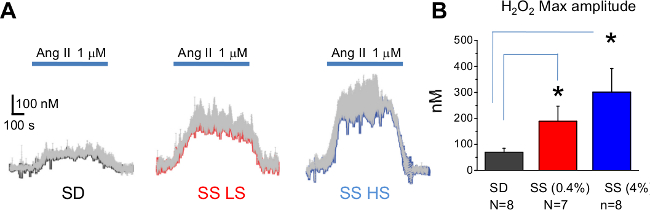
Figure 11. Ex Vivo Analysis of H2O2 in the kidney. Ang II perfusion causes H2O2 release in the rat kidney cortex. (A) Real time changes of the mean H2O2 concentration (gray bars show standard error) from a total of N = 8 applications (4 kidneys from 4 different rats). Bars on the top represent Ang II application. (B) The maximal H2O2 concentration amplitude values during Ang II perfusion for Sprague Dawley (SD) and Dahl salt-sensitive (SS) rats fed a low and high salt diets, respectively. * – P < 0.05 versus SD rats. The figure is adapted from reference12 with permission. Please click here to view a larger version of this figure.
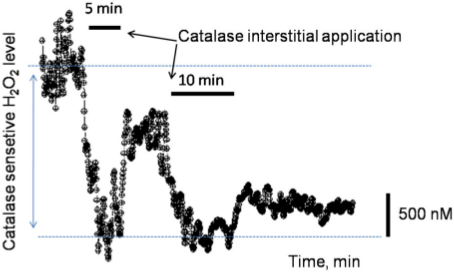
Figure 12. In Vivo Analysis of H2O2. Example of the in vivo assessment of interstitial H2O2 concentration in the medulla of a SS rat fed a low salt diet (as shown in Figure 10B). The interstitial application of catalase via an implanted catheter for the 5 min interval produced a complete blockade of the H2O2 signal in the renal medulla. Reduction of catalase, from washout by renal blood flow, resulted in a partial recovery of the signal, which was blocked again by an additional catalase application (10 min). Please click here to view a larger version of this figure.
The present protocols were developed to provide enhanced temporal and spatial resolution of ATP and H2O2 signaling for ex vivo isolated, perfused and in vivo blood-perfused kidneys. The differences between the protocols and the sensors used here provide optimal data acquisition for either pharmacological agents or physiological studies. The protocols consist of 1) sensor calibration, 2) surgical procedure, 3) data acquisition setup, and 4) data analysis. They enable the real-time measurements of analytes for numerous experimental conditions. This will lead to greater insights into kidney diseases and the development of more effective pharmacological treatments. Here we used the sensors to analyze ATP and H2O2. However, sensors for other substances are also available and can be used. The protocols described here were applied to study ATP and H2O2 in rat kidneys, but the same method can easily be adjusted for application in mice. Thus, this approach has a great potential considering the abundance of genetic rodent models.
The basic design of enzymatic microelectrode biosensors was developed in the 1960’s by Clark and Lyons2. Following the initial development of biosensors, advances have been made in both design17-19 and applications20. Llaudet et al.21,22 developed the principle design of the ATP sensors used in the present protocols while using methods from Cosneir et al.23 for the enzyme coating. These sensors have detected ATP signaling in a number of physiological processes including ATP release from brain astrocytes8, regulation of breathing4,24, and skeletal muscle arteriole regulation25. Recently the ex vivo protocol has been used to measure ATP signaling in kidneys12. The goal of this manuscript is to provide effective directions and insights for the detection of endogenous substances such as ATP in kidneys.
Enzymatic microelectrode biosensors have many advantages over existing means of measuring analytes in vivo. However, special precautions should be used for this approach as for any other new method. Validation with an established approach provides confidence in the obtained data. For instance, microdialysis measurements were made as described previously26,27. No significant difference was observed between the peak concentrations determined by the sensors and those obtained from the dialysis samples12. The limitation of microdialysis is that it only measures steady-state levels of analyte. As such, the assessment of dynamic changes in cell signaling can only be achieved with the use of the enzymatic microelectrode biosensors. The manufactory specifications of the sensor response times differ between sensor types. Ex vivo sensors have a response time of 5-10 sec and in vivo sensors of 30-35 sec for the signal rise from 10 to 90%. The calibration traces (Figures 6 and 7) demonstrate the time resolution of analyte addition/removal. For both the sensor and microdialysis approaches, the use of specific enzymes to block the signal produced by analytes is required to ensure specificity.
The described protocols have several challenges. As with any sensor insertion into tissue, tissue damage does occur. This could activate signaling pathways which may influence the measurements28. To minimize the cell damage, thinner sensors would be needed. However, it is difficult to penetrate the kidney capsule with the sensors so needles are used to make a small entry hole. Thin sensors are more likely to bend and disrupt their coating on insertion. Larger diameter sensors are more resistant bending and the resultant damage to their coating. Figure 3 shows a thin and thick sensor. In addition to the thick sensor’s resistance to bending, they contain a thicker layer of coating, providing increased protection for the enzymatic layer. The concern of tissue damage caused by using thick sensors was considerably less in kidneys than it would be in brain tissue. The insertion depth is approximated and final placement should be verified after measurements on the kidney are completed. Estimation between the cortex and medulla layers using the sensor tip length as an insertion guide and is sufficient as the sensor tip is 0.5 mm and the kidney cortex is 2-3 mm thick. Fouling of the sensor also occurs at a greater rate in blood, thus limiting the sensor use in long in vivo protocols to one experiment. Recording times of 1 to 1 ½ hr resulted in only a small sensor drift. The main criteria when assessing the reduced sensor performance is the low sensitivity to the analyte during calibration process. Increased electrical noise and instability of the baseline current can also indicate that the sensor tip is damaged. For accurate measurements of ATP, both sensors (ATP and Null) should have similar noise and stability characteristics for further subtraction of the signal. Otherwise, one of the sensors should be replaced. For low noise and detection of small concentrations of analyte, the use of new sensors for each animal is suggested.
Several steps are crucial for successful experimental outcomes. The sensors are very fragile and should be handled carefully to avoid damaging the sensor tip. Also, after rehydration, the sensors should not be exposed to the air for more than 20 sec. Low noise recordings are required for the successful detection of biological signals in tissues. For that purpose, a high-performance lab air table and proper electrical grounding is required. The addition of exact amounts of analyte during the calibration steps is necessary for accurate concentration determination in experiments. Achieving good clearing of the kidney in ex vivo kidney surgeries will result in successful recordings. The use of enzymes apyrase and catalase in calibrations and in experiments allows for the assessment of sensor nonspecific sensitivity and confirms the measurements.
These protocols provide greatly enhanced detail of extracellular signaling in kidneys. The improved sensitivity and temporal resolution afforded by the sensors may allow us to resolve changes in ATP signaling in disease states and following pharmacological manipulation that were previously undetectable. The in vivo protocol is well suited for complex physiological studies while ex vivo is optimal for the study of pharmacological applications on kidneys. The design of the in vivo sensor used here enables unprecedented resistance against interference in blood-perfused tissue. Taken together, these sensors offer a large amount of applications that were previously not possible with existing protocols and techniques.
The authors have nothing to disclose.
We appreciate Sarissa Biomedical for their work in developing the sensors used in the present manuscript. This research was supported by the National Heart, Lung, and Blood Institute grants HL108880 (A. Staruschenko), HL 116264 (A. Cowley) and HL 122662 (A. Staruschenko and A. Cowley), a project funded by the Medical College of Wisconsin Research Affairs Committee #9306830 (O. Palygin) and Advancing a Healthier Wisconsin Research and Education Program #9520217, and the Young Investigator Grant of the National Kidney Foundation (O. Palygin).
Sensor Kit | Sarissa Biomedical | SBK-ATP-05-125 | The kit includes storage bottle, rehydration chamber, electrode leads, and reference electrodes. Also included with the kit is the user's choice of sensors. |
Sarissaprobe ATP Biosensor 125 μm | Sarissa Biomedical | SBS-ATP-05-125 | store at 2-8 C before use |
Sarissagold ATP Biosensor 50 μm | Sarissa Biomedical | SGS-ATP-10-50 | store at 2-8 C before use |
Sarissaprobe null sensor 125μm | Sarissa Biomedical | SBS-NUL-20-125 | store at 2-8 C before use |
Sarissagold null sensor 50 μm | Sarissa Biomedical | SGS-NUL-10-50 | store at 2-8 C before use |
Sarissaprobe ATP Manual | Sarissa Biomedical | http://www.sarissa-biomedical.com/media/31563/instructions-atp.pdf | |
Faraday cage | TMC | ||
Dual channel potentiostat | Digi-Ivy | DY2021 | Type II Faraday cage |
Data acquisition program | Digi-Ivy | DY2000 | |
Perfusion pump | Razel Scientific Instruments | Model R99E | |
Fiber optic illuminator | Schott | ACE 1 | |
micromanipulator | Narishige | MM-3 | |
micromanipulator magnetic stand | Narishige | GJ-8 | |
air table | TMC | 63-500 | |
isoflurane ventilator | LEI Medical | M2000 | |
3 ml petri dish | Fisher Scientific | S3358OA | |
needle | Santa Cruz | 26-30 gauge | |
pins | Standard dissection pins | ||
catheter | Polyethylene tubing (PE50) | ||
catheter tissue glue | Vetbond | 1469SB | |
suture | Look | SP117 | |
rubber bands | any 2-4 mm wide rubber bands | ||
silicone | Momentive | RTV-615 Clear 1# | |
clamp | Fine Science Tools | 18052-03 | |
standard dissection kit | Kit should include scalpel and dissection sissors | ||
Kidney Cup | Of own design | ||
standard chemicals | Sigma-Aldrich | ||
ATP | Sigma-Aldrich | A6559-25UMO | 100 mM ATP solution |
hydrogen peroxide | Sigma-Aldrich | 216763 | |
glycerol | Sigma-Aldrich | G9012 | |
Apyrase | Sigma-Aldrich | A7646 | |
Catalase | Sigma-Aldrich | C40 | |
isoflurane | Clipper | 10250 | |
inactin | Sigma-Aldrich | T133 | |
ketamine | Clipper | 2010012 | |
Hanks Balanced Salt Solution | Gibco | 14025092 |