This paper presents a high-content microscopy workflow for simultaneous quantification of intracellular ROS levels, as well as mitochondrial membrane potential and morphology – jointly referred to as mitochondrial morphofunction – in living adherent cells using the cell-permeant fluorescent reporter molecules 5-(and-6)-chloromethyl-2',7'-dichlorodihydrofluorescein diacetate, acetyl ester (CM-H2DCFDA) and tetramethylrhodamine methylester (TMRM).
Reactive oxygen species (ROS) regulate essential cellular processes including gene expression, migration, differentiation and proliferation. However, excessive ROS levels induce a state of oxidative stress, which is accompanied by irreversible oxidative damage to DNA, lipids and proteins. Thus, quantification of ROS provides a direct proxy for cellular health condition. Since mitochondria are among the major cellular sources and targets of ROS, joint analysis of mitochondrial function and ROS production in the same cells is crucial for better understanding the interconnection in pathophysiological conditions. Therefore, a high-content microscopy-based strategy was developed for simultaneous quantification of intracellular ROS levels, mitochondrial membrane potential (ΔΨm) and mitochondrial morphology. It is based on automated widefield fluorescence microscopy and image analysis of living adherent cells, grown in multi-well plates, and stained with the cell-permeable fluorescent reporter molecules CM-H2DCFDA (ROS) and TMRM (ΔΨm and mitochondrial morphology). In contrast with fluorimetry or flow-cytometry, this strategy allows quantification of subcellular parameters at the level of the individual cell with high spatiotemporal resolution, both before and after experimental stimulation. Importantly, the image-based nature of the method allows extracting morphological parameters in addition to signal intensities. The combined feature set is used for explorative and statistical multivariate data analysis to detect differences between subpopulations, cell types and/or treatments. Here, a detailed description of the assay is provided, along with an example experiment that proves its potential for unambiguous discrimination between cellular states after chemical perturbation.
The concentration of intracellular ROS is meticulously regulated through a dynamic interplay between ROS producing and ROS defusing systems. Imbalance between the two provokes a state of oxidative stress. Among the major sources of ROS are mitochondria1. Given their role in cellular respiration, they are responsible for the bulk of intracellular superoxide (O2•-) molecules2. This mostly results from electron leakage to O2 at complex 1 of the electron transport chain under conditions of strong negative inner mitochondrial membrane potential (Δψm), i.e., mitochondrial hyperpolarization. On the other hand, mitochondrial depolarization has also been correlated with increased ROS production pointing to multiple modes of action3,4,5,6,7,8. Furthermore, through redox modifications in proteins of the fission-fusion machinery, ROS co-regulate mitochondrial morphology9.For example, fragmentation is correlated with increased ROS production and apoptosis10,11, while filamentous mitochondria have been linked to nutrient starvation and protection against mitophagy12. Given the intricate relationship between cellular ROS and mitochondrial morphofunction, both should ideally be quantified simultaneously in living cells. To do exactly this, a high-content imaging assay was developed based on automated widefield microscopy and image analysis of adherent cell cultures stained with the fluorescent probes CM-H2DCFDA (ROS) and TMRM (mitochondrial Δψm and morphology). High-content imaging refers to the extraction of spatiotemporally rich (i.e., large number of descriptive features) information about cellular phenotypes using multiple complementary markers and automated image analyses. When combined with automated microscopy many samples can be screened in parallel (i.e. high-throughput), thereby increasing the statistical power of the assay. Indeed, a main asset of the protocol is that it allows for simultaneous quantification of multiple parameters in the same cell, and this for a large number of cells and conditions.
The protocol is divided into 8 parts (described in detail in the protocol below): 1) Seeding cells in a 96-well plate; 2) Preparation of stock solutions, working solutions and imaging buffer; 3) Setting up of the microscope; 4) Loading of the cells with CM-H2DCFDA and TMRM; 5) First live imaging round to measure basal ROS levels and mitochondrial morphofunction; 6) Second live imaging round after addition of tert-butyl peroxide (TBHP) to measure induced ROS levels; 7) Automated image analysis; 8) Data Analysis, Quality Control and Visualization.
The assay was originally developed for normal human dermal fibroblasts (NHDF). Since these cells are large and flat, they are well suited for assessing mitochondrial morphology in 2D widefield images13,14. However, with minor modifications, this method is applicable to other adherent cell types. Moreover, next to the combination of CM-H2DCFDA and TMRM, the workflow complies with a variety of fluorescent dye pairs with different molecular specificities1,15.
The protocol below is described as performed for NHDF cells and with use of the multiwell plates specified in the materials file. See Figure 1 for a general overview of the workflow.
1. Preparation of Reagents
2. Setting Up of the Microscope and Acquisition Protocol ( ± 15 min)
NOTE: Image acquisition is performed with a wide-field microscope equipped with an automated stage and shutters, and a hardware based autofocus system using a 20X air Plan-corrected objective (NA = 0.75) and an EM-CCD camera. When setting up the assay for the first time, a test plate containing control cells, stained according to the protocol's instructions is used to calibrate the XY-stage and to optimize the acquisition settings. If the acquisition settings have already been determined, calibration can be done using an empty plate.
3. Seeding Cells in a 96-well Plate (45 – 90 min, Depending on the Number of Different Cell Lines)
4. Loading of the Cells with CM-H2DCFDA and TMRM ( ± 45 min)
NOTE: Handling of the cells on the day of the experiment can be carried out in a sterile environment (biosafety cabinet), but this is not mandatory because cells will be discarded or fixed directly after the assay.
5. First Live Imaging Round to Measure Basal ROS Levels and Mitochondrial Morphofunction (± 15 min)
6. Second Live Imaging Round after Addition of TBHP to Measure Induced ROS Levels (± 20 min)
7. Image Processing and Analysis (± 30 min per 96-well plate)
NOTE: All image processing is performed in FIJI (http://fiji.sc), a packaged version of ImageJ freeware. A dedicated script was written for automated analysis of intracellular ROS- and mitochondrial signals, as well as morphological parameters (RedoxMetrics.ijm, available upon request). The underlying algorithms are described in Sieprath et al.1.
8. Data Analysis, Quality Control (QC) and Visualization
Processing and analysis of the raw data is done using R statistical freeware (http://www.rproject.org – version 3.3.2) and RStudio (http://www.rstudio.com/ – version 1.0.44). To quickly obtain and visualize the results, an intuitive Shiny application17 (available upon request) has been conceived that integrates and visualizes the data in heatmaps and boxplots, and also performs statistical analyses. In general, the workflow comprises of two consecutive steps. First, data is processed and inspected per 96-well plate to detect aberrant data points. Secondly, curated data from all plates of a given experiment are combined and analyzed using non-parametric multivariate tests18 and a principal component analysis.
The assay has been benchmarked using several control experiments, the results of which are described in Sieprath et al.1. In brief, the fluorescence response of CM-H2DCFDA and TMRM to extraneously induced changes in intracellular ROS and Δψm, respectively has been quantified to determine the dynamic range. For CM-H2DCFDA, NHDF showed a linear increase in fluorescence signal when treated with increasing concentrations of TBHP between a range of 10 µM to 160 µM. Likewise, for TMRM, NHDF cells demonstrated a linear increase in mitochondrial fluorescence when treated with increasing concentrations of oligomycin (which induces Δψm hyperpolarization) within a 1 to 10 µg/µL range. Conversely, real-time addition of valinomycin, an antibiotic that induces Δψm depolarization, resulted in a gradual, quantifiable decrease of TMRM fluorescence.
The assay has also been used in a variety of experiments to reveal differences in redox status between cell types or treatments1,15. To illustrate this, the results are shown of an experiment in which NHDF were treated with the HIV protease inhibitor Saquinavir (SQV) (Figure 5). Using the described protocol, a significant increase was detected for both basal and induced ROS levels as compared to control cells treated with DMSO (Figure 5B). SQV treatment also significantly affected mitochondrial morphofunction. Morphologically, mitochondria acquired a highly fragmented pattern, which was also confirmed by a higher circularity and smaller average size of the individual mitochondria. Functionally, Δψm, measured as average TMRM signal per mitochondrial pixel was also significantly increased (Figure 5A). When combining the data of the 5 parameters described above, the two conditions (control and SQV) could be clearly separated from each other by principal component analysis. Data from three independent biological replicates is shown in a 2D-biplot displaying the first two principal components, which explain 81.4% of the total variance (Figure 5C). This proves the robustness of the assay and suggests that the combined readout may serve as a sensitive indicator of cellular health status.
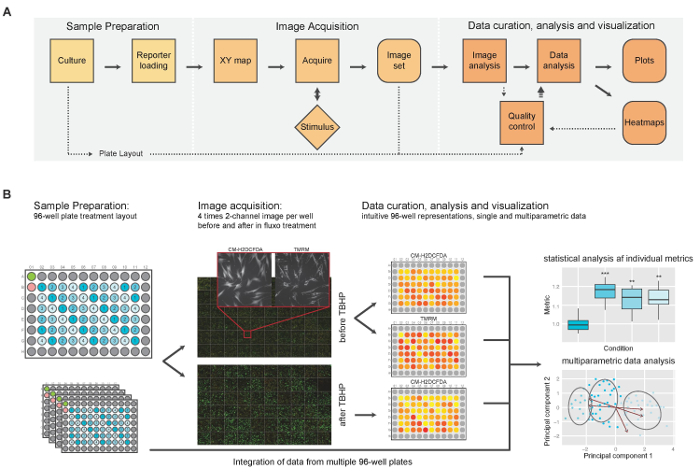
Figure 1: General Overview of the High-content Imaging Assay for Simultaneous Measurement of Intracellular Basal and Induced ROS Levels and Mitochondrial Morphofunction. (A) Schematic representation of the major operational blocks. (B) Illustrated example: cells are seeded in multiple identical 96-well plates. A standard well plate layout is shown in more detail in Figure 2A. After staining, 4 images are acquired per channel around the center of each well, both pre and post TBHP treatment, which is illustrated by the large montages with inset. After image analysis, intensity results are visualized using an intuitive heat-map projected onto the well-plate layout. This permits rapid detection of plate effects or aberrant wells. After curation of the complete experimental data sets, final data analysis is performed resulting in single- as well as multi-parameter output. (This figure was modified from reference1, with permission of Springer) Please click here to view a larger version of this figure.
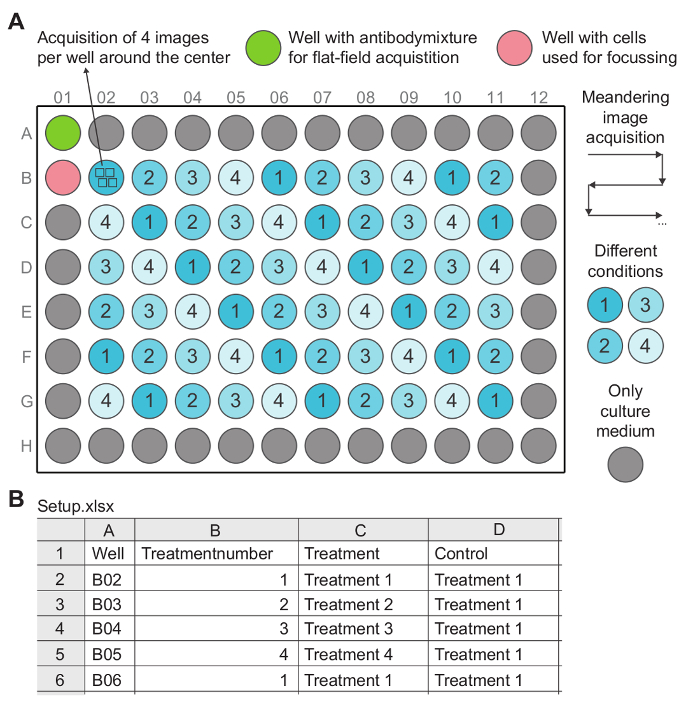
Figure 2: A Typical Experimental 96-well Layout and Corresponding 'Setup' File. (A) 4 different conditions are distributed homogeneously across the inner 60 wells of the plate. Well B01 also contains cells, but is only used to adjust the initial PFS offset just before imaging. The other outer wells are filled only with culture medium to minimize gradients (temperature, humidity, etc.) during cell culture. Image acquisition is performed in a meandering manner, i.e., first from left to right, from well B02 to B11, then back, from right to left, from well C11 to C02 and so on. After image acquisition flat field images are acquired in well A01, which is used for correcting spatial illumination heterogeneity during image analysis. (B) The corresponding setup file (Setup.xlsx) is a spreadsheet that contains information about the layout of the experiment. It specifies the locations of each treatment in the multiwell plate and their respective controls. Each row represents a well. Each treatment has its own unique treatment number, which is used to specify the order of the treatments on the X-axis of the generated plots during data analysis. The 'Control' column contains the treatment that should be used as a control for normalizing the data of the treatment specified in the same row. In the example, treatment 1 is the treatment that is used as control for normalizing the data from all the other treatments. Please click here to view a larger version of this figure.
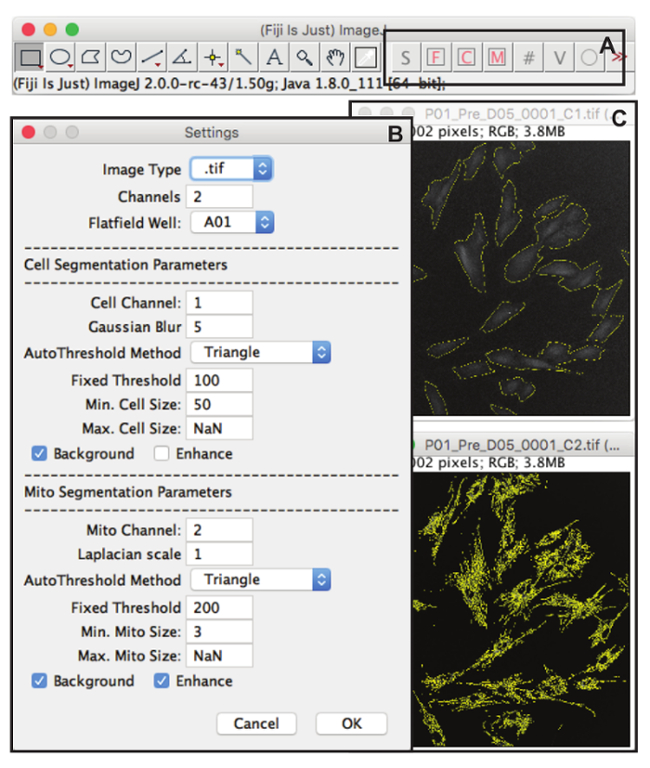
Figure 3: RedoxMetrics Macro-set, Layout and Setup Interface. (A) When the RedoxMetrics macro-set for FIJI is installed, a number of new macro commands as well as a set of action tools to test and optimize the analysis settings is created in the menu bar. 'S' invokes the setup interface. 'F' performs a flatfield correction on an open image. 'C' and 'M' perform a test segmentation for cellular regions ("Cell", CM-H2DCFDA channel) and mitochondrial regions ("Mito", TMRM channels), respectively on a single opened image using the analysis settings selected in the setup interface, returning an overlay of the segmented regions of interest (ROIs). '#' performs batch analysis on a folder of images using the settings specified in the setup interface (usually after verification on one or a few images). 'V' creates a verification hyperstack using the output data from the batch analysis. This hyperstack is a composite image of all raw images present in the folder and their respective regions of interest (drawn in a second channel). 'O' can be clicked to show or hide the overlay of the segmented region. (B) Setup interface. Here all analysis settings are selected, including general information such as the image type (extension), number of channels (wavelengths), and the well that was used for flatfield correction. Next there are settings specific to the image content type (Cell or Mito). In both cases, there are options (checkboxes) to include a background correction ("background") and local contrast enhancement ("contrast"). For cell segmentation, there is the option to define a Gaussian blur radius (sigma) for reducing noise. For mito segmentation there is the option to define the radius of a Laplacian operator for selective enhancement of the mitochondria. Subsequent segmentation is performed using an automatic (or fixed) thresholding method that can be defined per content type. When a fixed threshold is chosen, the upper threshold value can be provided manually. Finally, the analysis can be restricted to a selection of objects that falls within a minimum and max size. (C) An example of a segmentation result as run with the "C" (top) or "M" (bottom) command, displayed as the raw image in grey overlaid with the regions of interest in yellow. Please click here to view a larger version of this figure.
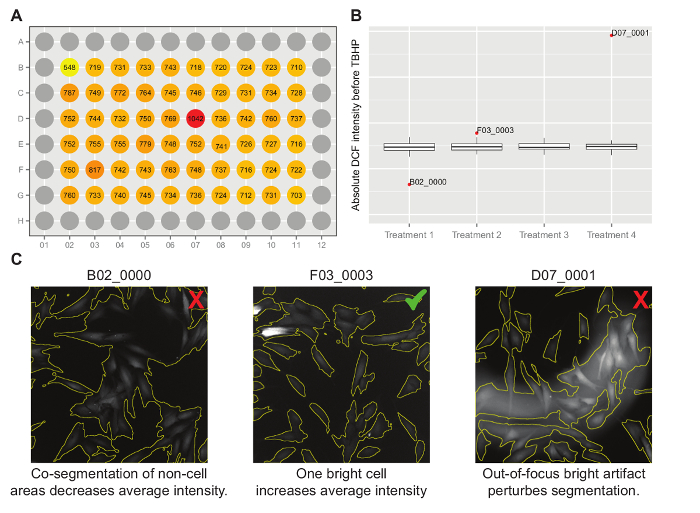
Figure 4: Illustrated Example of Intermediate Data Visualizations. (A) Multiwell plate visualization where wells B02 and D07 appear suspicious. (B) Boxplot representing the same data, with the outliers labeled with well name and image name. Together with F03_0003, images from B02 and D07 reappear as outliers. (C) Visual inspection of these images shows that B02_0000 and D07_0001 should be removed from further analysis because there are segmentation errors (illustrated by the red 'X'). F03_0003 should be kept because there is no apparent segmentation or technical error. (if no technical reason is found for the aberration, the data should not be removed). Please click here to view a larger version of this figure.
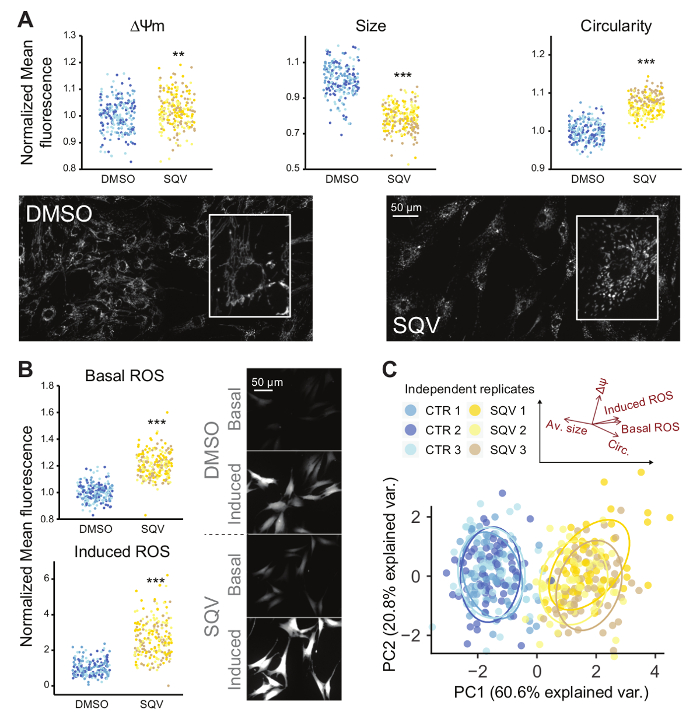
Figure 5: Effect of Saquinavir (SQV; 20 µM) on Primary Human Fibroblasts (control is DMSO). (A) Mitochondrial membrane potential (ΔΨm) and mitochondrial morphology (circularity and average size of individual mitochondria) as measured by TMRM (B) Increased Basal levels of intracellular ROS as measured by CM-H2DCFDA and response towards induced ROS, measured as relative gain in intensity after addition of 20µM TBHP addition. (C) 2D scatterplot of the first 2 principal components (PCs) from a PCA analysis on the 5 variables described above (basal and induced ROS levels, average mitochondrial size, circularity, and ΔΨm). The black arrows represent the directions of the original 5 variables with respect to the principal components. (Independent replicates are plotted with a different color; All data is normalized with respect to the DMSO-control; * = p value <0.05; ** = p value <0.01; *** = p value <0.001; the range of the Y -axes has been adjusted to optimally display the differences; This figure was modified from reference1, with permission of Springer) Please click here to view a larger version of this figure.
Problem | Potential reason | Possible solution |
Too few cells in the wells during imaging | Too few cells seeded | Seed more cells 24 h before imaging |
Poor cell growth | Check culture conditions (medium, temperature stability, CO2 control) | |
Too violent washing steps | Avoid washing cells away, pipette gently | |
Too many cells in the wells during imaging | Too many cells seeded | Seed less cells 24 h before imaging |
Weak signals or non-linear response of CM-H2DCFDA fluorescence to stimulus | Used too low/high dye concentration | If using other than NHDF cells, optimal loading concentrations have to be determined empirically |
Dye-loading is insufficient | Add 0.02% w/v of the surfactant Pluronic-127 to the loading solution to increase uptake. | |
CM-H2DCFDA signal visually increases during exposure time | Too high dye concentration | Reduce dye concentration |
Excitation intensity is too high | Reduce excitation intensity by using ND filters and/or reducing exposure time | |
CM-H2DCFDA intensity decreases during acquisition of the well plate | CM-H2DCFDA is leaking out of the cell. | Use 2 mM Probenicid (anion pump inhibitor). Add to the loading solution, as well as the imaging buffer to decrease leakage |
There is no increase in CM-H2DCFDA signal intensity after addition of TBHP | TBHP is not active | Use fresh TBHP |
CM-H2DCFDA is leaking out of the cell. | Use Probenicid as described above. | |
(Some of the) acquired images appear out-of-focus, while focus seems ok when checked. | The plate is mounted tilted causing the focus to extend beyond the PFS offset | Check the mounting of the plate and the stage level, Reposition the plate |
The bottom of the plate contains dust or irregularities | Clean the bottom of the plate with an ethanol-wetted lens paper | |
Cells die during imaging | Excitation intensity is too high | Reduce excitation intensity or acquire fewer images per well. |
Wrong imaging-buffer composition | Remake imaging-buffer | |
There are out of focus fluorescent spots in the images | Detached cells are floating out of focus | Wash more gently during the loading protocol |
One or more columns have an allover lower intensity than the other wells of the plate | One or more tips from the multichannel pipette were not firmly attached and therefore less reporter was added to these wells | Thoroughly check if all tips are filled perfectly whenever you use a multichannel pipette. |
Focus drifts dramatically during image acquisition | The polystyrene bottom of the plate can react with immersion oil when using an oil lens | Use a dry lens, or use a multiwell plate with a glass bottom |
TMRM signal intensity increases between imaging the first and last well | Reporter loading time was not long enough, TMRM is still equilibrating | Increase reporter loading time |
CM-H2DCFDA signal after TBHP treatment increases during acquisition of the well plate | The time between treatment with TBHP and the start of the second imaging round was not long enough, TBHP is still oxidizing CM-H2DCFDA. | Increase incubation time between the treatment with TBHP and the second imaging round. (start with at least 3 min) |
Flat field images are saturated | Antibody working solution is to concentrated | Use a lower concentration of antibody working solution |
Acquisition settings are not optimized (exposure time to high, ND-filter to low, …) | Optimize acquisition settings, signal has to be in dynamic range of the sensor | |
Flat field images are to dark | Antibody working solution is to diluted | Use a higher concentration of antibody working solution |
Acquisition settings are not optimized (exposure time to high, ND-filter to low, …) | Optimize acquisition settings, signal has to be in dynamic range of the sensor | |
Over/Undersegmentation artefacts | Threshold not set correctly | Adjust the threshold setting |
Size filters not adjusted properly | Adjust the min and max size criteria for image analysis | |
Cell confluency is too high | The correct level of confluency is very important for reliable image analysis. For other cell types than NHDF, the optimal seeding density has to be determined empirically | |
The shiny application does not work | Wrong directory selected | Choose the correct directory on the input page. |
Missing files in directory | Make sure all necessary files (output from imagej macro and setup file) are present in the selected directory | |
Missing packages | Normally the app checks for and installs all necessary packages, but when this fails, check manually for the following packages: devtools, ggbiplot, pacman, ggplot2, plyr, nparcomp, data.table, readxl, gplots, ggbiplot, shiny, shinyFiles, pbapply and shinyjs including all dependencies. |
Table 1: Typical pitfalls and potential solutions.
This paper describes a high-content microscopy method for the simultaneous quantification of intracellular ROS levels and mitochondrial morphofunction in NHDF. Its performance was demonstrated with a case study on SQV-treated NHDF. The results support earlier evidence from literature in which increased ROS levels or mitochondrial dysfunction have been observed after treatment with type 1 HIV protease inhibitors, albeit in separate experiments19,20,21,22,23,24,25. The important difference is that the described assay is able to measure these parameters simultaneously, in the same living cells, together with morphological data. The major advantage of this approach is its unambiguous determination of both factors together in space and time, which allows pinpointing causal relationships. A principal component analysis is performed which allows for generating a sensitive redox profile of specific perturbations. However, more advanced data mining techniques and (supervised) clustering algorithms can also be used on the extracted data to enable predictive redox profiling. This may be a valuable feature for diagnostic or prognostic classification tools in digital pathology, as well as in screening for therapeutic targets, e.g. once robust classification models are created, small molecule libraries can be screened to find therapeutic candidates to counteract oxidative stress, analogous to a recent screen for promising leads in therapy development for human mitochondrial disorders26.
The assay was conceived for NHDF, but can be adapted to other adherent cell types. This requires optimization of the staining protocol and reporter dye concentrations. The amount of reporter dye has to be minimized since overloading can cause nonlinear effects due to quenching or even become cytotoxic27. Extension of the assay to suspension cells is less obvious due to difficulties with mounting and observing such cells in a physiological manner. They can be cytospun on a coverslip or cultured in serum-free media to induce adhesion, but both of these processes interfere with physiological conditions28,29. However, these limitations could be overcome using micropatterned cell culture supports that keep individual cells (adherent or non-adherent) trapped in small micro wells while maintaining their viability30, or by the use of a thermo-reversible hydrogel to trap cells during imaging31. These methods have already been used for high-content screening of plasma membrane potential, or cellular oxygen in individual suspension cells32,33 or the imaging of intracellular markers in the living, highly motile parasites31. Adaptations would also have to be made to the imaging modality, since morphological analysis of the mitochondrial network in these cells would require rapid 3D-acquisition capabilities such as spinning disk confocal or Bessel beam light sheet microscopy34,35, as well as to the analysis pipeline, to include the Z-dimension while calculating morphological parameters.
The assay was optimized for 96-well plates, but it is obviously amenable to further upscaling, e.g. to 384-well plates. The major limiting factor is the plate acquisition time, i.e., the time it takes to acquire images of all the wells. The fluorescent signals have to remain stable during this timeframe so as to be able to confidently compare measurements between individual wells. But, because the staining is transient and the process under investigation is dynamic, this poses a challenge. Therefore, the fluorescent signals were measured in a set of replicated experiments and this showed that both CM-H2DCFDA and TMRM signals remain stable from 7 to at least 50 min after staining (coefficient of variation <2%). This gives a window of approximately 40 min. A 96-well plate typically takes around 10 min. Thus, an extrapolation to 384-well plates would keep the acquisition duration within the stable time slot. With an average of 50 cells per image (based on the use of a 20X objective and NHDF cells), this would result in data for approximately 30,000 cells per hour of screening, greatly adding to the statistical power of the assay. Another factor influencing fluorescent signal stability is the temperature. To avoid vacuolization of CM-H2DCFDA (i.e. dye accumulation in intracellular vesicles), which would give rise to heterogeneous staining and non-linear effects, the incubation takes place at room temperature instead of 37 °C. Apart from stability, it is important to note that the exposure of living cells to fluorescence excitation light itself induces ROS production. This implies that the exposure conditions (exposure time and excitation light intensity) should be kept at an absolute minimum. It also means that all wells should only be exposed when the actual images are acquired. This rules out the use of software-enabled autofocusing methods and warrants the use of a hardware-based autofocus system.
An advantage of the described method is its generic character. Virtually any combination of spectrally compatible fluorescent reporters can be used. This was demonstrated by using the Calcein/MitoSOX combination to measure mitochondrial ROS per living cell1,15. Furthermore, the applications are not limited to the integrated ROS/mitochondrial measurement. The assay can also be extended with a post hoc immunostaining (after the second imaging round). Since the exact imaging locations are saved, redox analyses can be directly correlated with location proteomics in the same cells. This greatly increases the molecular readout, which is in stark contrast to other methods often used to assess redox biology, or fluorescence intensities in general. For instance, fluorimetry (microplate reader) is widely used because of its relatively low cost (basic setup available for as low as €4000) and shallow learning curve, but being a black box, it is more prone to confounding factors such as variations in cell density or background (auto-)fluorescence, e.g. of contaminating dust particles. Moreover, plate readers do not allow for the extraction of morphological parameters, they cannot measure single cells, and they are less sensitive and reliable to measure dynamic or transient signals36,37. Flow cytometry does have the capacity to measure single cells and has the advantage of speed. Indeed, a 384-well plate can be screened in as little as 12 min with high sensitivity for multiple markers38. This is much faster than what is possible with widefield microscopy. But, still no spatiotemporal information is provided (i.e. subcellular localization, morphological data and/or time dependent kinetics), nor does it allow revisiting the same cells during or after a treatment (i.e., in fluxo). Furthermore, cells need to be in suspension, which makes flow cytometry less suited to studying the physiology of adherent cells. Major disadvantages of high-content microscopy as compared to the other methods are the need for large image data storage, intensive processing power and complex image analyses. The presented assay standardizes the image acquisition process and streamlines the analysis so as to minimize this processing time, increase ease of use and therefore make the assay more accessible.
In conclusion, and specific to the use of CM-H2DCFDA and TMRM, the described redox profiling method is robust, sensitive and reliable. Due to its multiparametric and quantitative nature, it is superior to other fluorescence-based methods. This way, it can help to elucidate the relationship between mitochondrial function and intracellular ROS signaling, which is crucial for better understanding a wide variety of pathologies in which redox homeostasis is perturbed. Furthermore, owing to its generic character, the assay allows applications well beyond its original scope.
The authors have nothing to disclose.
This research was supported by the University of Antwerp (TTBOF/29267, TTBOF/30112), the Special Research Fund of Ghent University (project BOF/11267/09), NB-Photonics (Project code 01-MR0110) and the CSBR (Centers for Systems Biology Research) initiative from the Netherlands Organization for Scientific Research (NWO; No: CSBR09/013V). Parts of this manuscript have been adapted from another publication1, with permission of Springer. The authors thank Geert Meesen for his help with the widefield microscope.
Reagents | |||
Tetramethylrhodamine, Methyl Ester, Perchlorate (TMRM) | ThermoFisher Scientific | T668 | |
CM-H2DCFDA (General Oxidative Stress Indicator) | ThermoFisher Scientific | C6827 | |
Dimethyl sulfoxide | Sigma)Aldrich | D8418 | |
MatriPlate 96-Well Glass Bottom MicroWell Plate 630 µL-Black 0.17 mm Low Glass Lidded | Brooks life science systems | MGB096-1-2-LG-L | |
HBSS w/o Phenol Red 500 ml | Lonza | BE10-527F | |
DMEM high glucose with L-glutamine | Lonza | BE12-604F | |
Phosphate Bufered Saline (PBS) w/o Ca and Mg | Lonza | BE17-516F | |
HEPES 1M 500mL | Lonza | 17-737F | |
Trypsin-Versene (EDTA) Solution | Lonza | BE17-161E | |
Cy3 AffiniPure F(ab')₂ Fragment Donkey Anti-Rabbit IgG (H+L) | Jackson | 711-166-152 | Antibody used for acquiring flat-field image |
Alexa Fluor 488 AffiniPure F(ab')₂ Fragment Donkey Anti-Rabbit IgG (H+L) | Jackson | 711-546-152 | Antibody used for acquiring flat-field image |
Name | Company | Catalog Number | Comments |
Equipment | |||
Nikon Ti eclipse widefield microscope | Nikon | ||
Perfect Focus System (PFS) | Nikon | hardware-based autofocus system | |
CFI Plan Apo Lambda 20x objective | Nikon | ||
Name | Company | Catalog Number | Comments |
Software | |||
NIS Elelements Advanced Research 4.5 with JOBS module | Nikon | This software is used to steer the microscope and program/perform the automatic image acquisition prototocol | |
ImageJ (FIJI) Version 2.0.0-rc-43/1.50g | |||
RStudio Version 1.0.44 | Rstudio | ||
R version 3.3.2 |