Fluorescent Dye Labeling of Erythrocytes and Leukocytes for Studying the Flow Dynamics in Mouse Retinal Circulation
Summary
Live-cell imaging of the labeled blood cells in ocular circulation can provide information about inflammation and ischemia in diabetic retinopathy and age-related macular degeneration. A protocol to label blood cells and image the labeled cells in the retinal circulation is described.
Abstract
The retinal and choroidal blood flow dynamics may provide insight into the pathophysiology and sequelae of various ocular diseases, such as glaucoma, diabetic retinopathy, age-related macular degeneration (AMD) and other ocular inflammatory conditions. It may also help to monitor the therapeutic responses in the eye. The proper labeling of the blood cells, coupled with live-cell imaging of the labeled cells, allows for the investigation of the flow dynamics in the retinal and choroidal circulation. Here, we describe the standardized protocols of 1.5% indocyanine green (ICG) and 1% sodium fluorescein labeling of mice erythrocytes and leukocytes, respectively. Scanning laser ophthalmoscopy (SLO) was applied to visualize the labeled cells in the retinal circulation of C57BL/6J mice (wild type). Both methods demonstrated distinct fluorescently labeled cells in the mouse retinal circulation. These labeling methods can have wider applications in various ocular disease models.
Introduction
Studying the flow dynamics of the blood cells in the retinal and choroidal circulation is imperative to understanding the pathogenesis of potentially vision-threatening ocular diseases and other ocular inflammatory conditions. However, the conventional angiography techniques, which involve the binding of fluorescent dyes to plasma proteins, do not provide any information regarding the dynamics of the erythrocytes or leukocytes1. The erythrocyte retinal flow dynamics are important for studying metabolically efficient circulation in the retina, and the leukocyte flow dynamics, for understanding the cell migration, recognition, adhesion and destruction in various inflammatory conditions2. There are several fluorescent molecules used in the identification and characterization of various cell types3. The hemodynamics of the blood cells can be measured by staining them with the appropriate fluorescent dyes and applying the proper imaging techniques4.
The presence of inflammatory responses in intraocular diseases like age-related macular degeneration (AMD) and diabetic retinopathy (DR) involve the accumulation of lymphocytes in the diseased area5,6. Tracking the immune cells in the tissues can help understand the complex events involved in the mechanism of disease pathogenesis. Radioactive isotopes like 51Cr and 125I were used as cell tracers in early studies. These dyes are toxic and affect the cell viability. Although the radioactive markers 3H and 14C are less toxic to the cells, due to their lower emission energies, it is difficult to detect their signals in the system7,8. A number of fluorochrome dyes were introduced to overcome the potential problems associated with radioactive markers and track lymphocyte migration in vitro using fluorescent microscopy and flow cytometry9,10. Hoechst 33342 and thiazole orange are DNA binding fluorescent dyes, which are used to track lymphocytes in vivo. Hoechst 33342 binds to AT-rich regions in the DNA, is membrane permeable, retains fluorescent signals for 2 – 4 days and is resistant to quenching9,10. The disadvantages of Hoechst 33342 and thiazole orange are the inhibition of lymphocyte proliferation11 and the short half-life, respectively9.
Calcein-AM, fluorescein diacetate (FDA), 2′,7′-bis-(2-carboxyethyl)-5-(and-6)-carboxyfluorescein, acetoxymethyl ester (BCECF-AM), 5-(and-6)-carboxyfluorescein diacetate (CFDA), and 5-(and-6)-carboxyfluorescein diacetate acetoxymethyl ester (CFDA-AM) are the cytoplasmic fluorescent dyes used for lymphocyte migration studies. However, FDA, CFDA and CFDA-AM have lower retention in the cells9. BCECF-AM reduces the proliferative response and influences the chemotaxis and superoxide production9,12. Calcein-AM is a fluorescent dye and useful for short-term in vivo lymphocyte migration studies. It emits strong fluorescent signals, does not interfere with most of the cellular functions and retains fluorescent signals for up to 3 days12,13. Fluorescein isothiocyanate (FITC) and carboxyfluorescein diacetate succinimidyl ester (CFDA-SE) are covalent coupling fluorescent dyes, which are used for lymphocyte migration studies. FITC exhibits no effect on the cell viability and has a stronger affinity with B lymphocytes than T lymphocytes14,15. The CFDA-SE labeled lymphocytes can be tracked in vivo for more than 8 weeks and up to 8 cell divisions9,16. C18 DiI (1,1'-dioctadecyl-3,3,3',3'-tetramethylindocarbocyanine perchlorate), DiO (3,3'-dioctadecyloxacarbocyanine perchlorate), Paul Karl Horan (PKH)2, PKH3, and PKH26 are membrane-inserting fluorescent lipophilic carbocyanine dyes used to label leukocytes and erythrocytes. C18 Dil and DiO exhibit higher signals when incorporated into the cell membrane and are relatively non-toxic12,17. PKH2, PKH3 and PKH26 labeled cells exhibit a good retention of the fluorescent signals with less toxicity18,19,20,21,22. However, PKH2 down regulates the CD62L expression and reduces the lymphocyte viability23.
Most of the above-mentioned studies have been performed for tracking the lymphocyte migration and proliferation in the lymphatics and studying the labeled erythrocytes in the non-ocular circulation. There are very few studies applying the labeling techniques to study the blood cells in the ocular circulation. Application of scanning laser ophthalmoscopy (SLO) has a great advantage in studying the labeled cells in the retinal and choroidal circulation in vivo by fundus angiography24. There are several fluorescent dyes, such as ICG, acridine orange, FITC, sodium fluorescein, and CFDA that are used to study the leukocytes in the retinal circulation by SLO25,26,27,28,29,30,31,32,33,34. The phototoxicity and carcinogenicity of acridine orange26,27, the interference of FITC with the cellular activity, and the requirement of an intravascular contrast agent for the resolution of the retinal and choroidal blood vessels limits their application in in vivo animal experiments29. Sodium fluorescein and ICG are non-toxic, approved by the Food and Drug Administration, and safe for testing on humans32,35. Most of the flow dynamic studies are related to the labeling of the leukocytes or erythrocytes and its visualization in the retinal and choroidal blood vessels36,37,38,39. Here, we describe a standardized protocol of ICG labeling of the erythrocytes, sodium fluorescein labeling of the leukocytes, and tracking the visualized labeled cells in the mouse retinal circulation using SLO.
Protocol
The animal protocols used in this study were approved by the Institutional Animal Care and Use Committee of SingHealth, Singapore and are in accordance to the guidelines of the Association for Research in Vision and Ophthalmology (ARVO) Statement for the Use of Animals in Ophthalmic and Vision Research.
1. Labeling of Erythrocytes and Leukocytes with Fluorescent Dyes
- Preparation of reagents
- Prepare ICG (1.5 mg/mL) by dissolving 3 mg of ICG in 1800 µL of sterilized distilled water. Add 200 µL of 10x phosphate buffered saline (PBS).
- Prepare 40% 1x PBS by adding 4 mL of 1x PBS to 6 mL of sterilized distilled water. Prepare 1% bovine serum albumin (BSA) in PBS by adding 100 mg of BSA to 10 mL of 1x PBS. Mix well until the BSA is dissolved.
- Isolation of erythrocytes and leukocytes using density gradient centrifugation
- Anesthetize the mice (wild type C57BL/6) using a combination of ketamine hydrochloride (50 mg/kg) and xylazine hydrochloride (0.5 mg/kg) (according to schedule 1, under ARVO guidelines). Confirm anesthesia by pedal withdrawal reflex (i.e., toe pinch).
- Slowly insert the 29 gauge needle (attached to a 1 mL syringe) at a costal angle directed towards the heart. To confirm that the needle is inside the heart, withdraw the plunger slightly and check if blood is withdrawn into the syringe. Exsanguinate 0.8 – 1 mL of blood directly from the heart.
- Immediately transfer the blood into an ethylene diamine tetra acetic acid (EDTA) (1.8 mg/mL of blood) containing blood collection tube and mix gently to prevent coagulation of the blood.
- Euthanize the mice by administering pentobarbital (80 mg/kg) by intraperitoneal injection.
- Layer the whole blood on top of a polysucrose and sodium diatrizoate solution (1:1 ratio; density 1.077 g/mL) in a 2 mL microcentrifuge tube and centrifuge (450 x g, 30 min) to allow the separation of the leukocytes and erythrocytes from the plasma.
- Remove and discard the supernatant (plasma) using a pipette. Carefully transfer the buffy coat (leukocytes) and erythrocytes (red blood cell layer) into new and separate tubes using pipettes.
- ICG (1.5%) labeling of erythrocytes
- Wash the erythrocytes with 1x PBS to remove any contaminants. Resuspend the erythrocytes in 1x PBS (1:1) to make 50% hematocrit. Aliquot 0.5 mL of 50% hematocrit (~ 250 µL packed erythrocytes) into microcentrifuge tubes. Centrifuge the erythrocytes (750 x g, 5 min) and discard the supernatant.
- Add 200 µL of 40% 1x PBS to the pelleted erythrocytes, mix well and incubate at room temperature for 5 min. Add 100 µL of ICG (1.5 mg/mL) to the erythrocyte suspension, mix gently by inverting the tube, and incubate at room temperature for 5 min. Add 300 µL of 1x PBS and incubate at 37 °C in a shaker incubator for 60 min.
- Centrifuge the carrier erythrocytes (750 x g, 3 min) and resuspend in 1 mL 1x PBS.
- Wash the cells ~ 3 – 5 times with 1x PBS until the supernatant is clear (step 1.3.3). After the last wash, decant the supernatant and add 1% BSA PBS (1:1) to the labeled pre-swelled erythrocytes to achieve a 50% hematocrit (1.25 x 10⁸ cells/mL) of ICG labeled erythrocytes.
- Sodium fluorescein (1%) labeling of leukocytes
- After separating the buffy coat from the blood using density gradient centrifugation (from step 1.2.6), wash the cells once with 10 mL of 1x PBS by centrifuging at 450 x g for 10 min to remove any contaminants. Resuspend the pellet in 900 µL of 1x PBS.
- Add 100 µL of 10% sodium fluorescein to 900 µL of the leukocyte suspension and incubate at room temperature for 2 min. Wash the labeled cells three times with 10 mL 1X PBS by centrifuging (450 x g, 10 min). Resuspend the cells into 100 µL 1x PBS.
2. Live Imaging of Fluorescently Labeled Cells
- Live-cell imaging of ICG labeled erythrocytes
- To prepare cells for injection via tail vein or retro-orbital route, dilute the 50% hematocrit of ICG labeled erythrocytes by 10-fold and 50-fold with 1x PBS to make 5% and 1% hematocrit cells, respectively.
- Place the mouse under the infrared light (250W intensity) for 5 min to let the tail vein dilate. Anesthetize the mouse with ketamine hydrochloride (50 mg/kg) and xylazine hydrochloride (0.5 mg/kg) through intraperitoneal injection (here, according to schedule 1, under ARVO guidelines).
- Dilate each pupil of the eyes with a drop of 0.5% tropicamide and 2.5% phenylephrine hydrochloride.
- Place the contact lens over one eye for imaging. Use ophthalmic gel as a medium for imaging and to prevent dryness of the cornea. Fix the confocal laser scanning ophthalmoscopy (SLO) camera with +25 diopter lens to compensate for the refraction of the mouse eye.
- Place the mouse onto the SLO imaging platform. Ensure that the cornea of the mouse is facing straight towards the optical head of the SLO machine.
- Switch on the imaging module. Using the associated imaging module software, click on the "New Patient" button and add animal identification details such as mouse ear tag number, date of birth, percentage of fluorescent dye and labeled cell type.
- Position the optic nerve of the animal at the center of the imaging screen by maneuvering the imaging module. Using the associated imaging module software, click on the "Acquire" button to take the infrared (IR) fundus images with the 30° or 15° angle view setting. Ensure that the center of the retina, the pupil and the optical path of the laser are aligned to achieve a best quality image.
NOTE: The optical path is aligned by maneuvering the joystick to obtain the sharpest image and best lighting exposure.
- Position the optic nerve of the animal at the center of the imaging screen by maneuvering the imaging module. Using the associated imaging module software, click on the "Acquire" button to take the infrared (IR) fundus images with the 30° or 15° angle view setting. Ensure that the center of the retina, the pupil and the optical path of the laser are aligned to achieve a best quality image.
- Take the ICG fundus video.
- Turn on the ICG filter (790 nm), set the camera to high speed mode with the 30° or 15° angle view and set the ICG intensity at 85 for all readings for standardization. On the control panel, click on the "Acquire" button to take the video (baseline control) at 8.8/15 frames/s for 1 min.
- Load 100 µL of ICG labeled erythrocytes into an insulin syringe attached to a 30 gauge needle.
- For the injection via the tail vein route, insert the needle bevel up into the tail vein. Confirm the intravenous access by checking the backflow of the blood into the syringe and inject the labeled cells into the circulation.
- For the injection via the retro-orbital route, insert the needle adjacent to the eye into the retro-orbital space. Confirm the retro-orbital access by checking the backflow of the blood into the syringe and inject the labeled cells into the circulation.
- After the injection, reposition the mouse and take the IR fundus images (see step 2.1.6.1) and video using the ICG filter (see step 2.1.7.1). The labeled cells in the retinal circulation can be visualized immediately after the injection of the cells.
- After acquiring the video frames, extract .tiff images of the video sequences by choosing the .tiff format when exporting the video using the SLO viewing module software. Save the files in a desired folder.
- Remove the contact lens, place it over the other eye, and complete the imaging as described in steps 2.1.4 – 2.1.7.
- After imaging, place the anesthetized animal under the infrared light (250W) to maintain the body temperature until it recovers from anesthesia. When the animal is fully recovered, place the mouse back into the holding cage.
- Live-cell imaging of 1% sodium fluorescein labeled leukocytes
- Prepare the mouse and set-up the instrument as described in section 2.1.
- Position the mouse and take the IR fundus images as described in steps 2.1.4 – 2.1.6.
- Obtain the fluorescein angiogram of the mouse using the fluorescein filter (488 nm) with the high-speed camera mode with the 30° or 15° angle view and fluorescein intensity at 85 for all readings for standardization. Record the video (baseline control) at 8.8/15 frames/s (see step 2.1.7.1).
NOTE: Here, multiple tracks of videos (1 min videos) were acquired at different time intervals.
- Obtain the fluorescein angiogram of the mouse using the fluorescein filter (488 nm) with the high-speed camera mode with the 30° or 15° angle view and fluorescein intensity at 85 for all readings for standardization. Record the video (baseline control) at 8.8/15 frames/s (see step 2.1.7.1).
- Inject 100 µL labeled leukocytes into the mouse through the tail vein or retro-orbital injection as described in section 2.1.8.
- Immediately after the injection, position the mouse and take the IR fundus images (see steps 2.1.5 and 2.1.6) and the fluorescein angiogram of the mouse (see section 2.2.2).
- Observe the labeled cells in the retina or choroidal blood vessels by adjusting the focal point of the scanning laser by turning the focusing knob on the imaging module.
- Acquire the video frames and images using SLO viewing module software (see step 2.1.10) and save it in a desired folder.
- After the procedure, follow step 2.1.12 for care of animals.
- Image analysis by MtrackJ software
- Open the image sequence in ImageJ by clicking on "File". Select "Import" and choose "Image sequence", select the desired image folder, and click "Open". A pop up window called "Sequence options" will appear on the screen. Click "Ok"; the image sequence will open.
- Set the frame interval of the image video by clicking on "Image" and select "Properties" for velocity measurements. Here, it is 8.8 frames/s.
- Open the MTrackJ plugin by selecting "Plugins". Select "Tracking" and then select "MtrackJ". A menu should appear.
- To adjust the tracking settings, select "Tracking" (under menu) and check the box "Move to next time frame index after adding point".
- Track the first cell.
- Locate one cell and track the same cell in subsequent frames. On the menu click "Add" to add a new track.
- Hover the cursor over the image (+ sign) and click on the appropriate cell.
NOTE: MTrackJ will automatically jump to the next time frame and add a small circle, marking the position of the first point in the trajectory. - Continue clicking on the current position of the cell while moving through the frames of the image sequence.
NOTE: Occasionally, the circles marking the previous points in the trajectory interfere with the ability to view the current location. If this occurs, proceed to step 2.3.5.3.1.- Change the display option for the trajectory by clicking on "Displaying" in the menu and selecting the option "display only track points at current time". To see all the trajectories, de-select this option.
- Continue clicking until the trajectory of the first cell is seen. Then save the track by clicking "Save".
- Track the second cell.
- In the menu, click "Add" to start a new track. Repeat steps 2.3.5.1 – 2.3.5.4 for tracking the new cell. Click on "Save" to save the second track.
- Continue these steps for all trackable cells observed. After tracking the cells, click on "Measure" and "OK" in the menu tab to get the results.
NOTE: A results window opens up automatically, which can be saved and opened in a spreadsheet for further analysis.
Representative Results
Erythrocytes labeled with 1.5% ICG were visualized in the retinal circulation of C57BL/6J mice (wild type). Both 1% and 5% hematocrit of 1.5% ICG labeled erythrocytes were distinguishable in the retinal circulation. However, the individual labeled cells were more clearly visualized with 1% hematocrit of 1.5% ICG labeled erythrocytes (Figure 1). In 5% hematocrit, due to the large number of labeled cells in the retinal vessels, it was not possible to mark the individual cell. Some erythrostasis was observed in the peripapillary region under both conditions, but it was more prominent in the 5% hematocrit of labeled erythrocytes (Figure 2).
Leukocytes were successfully labeled with 1% sodium fluorescein following the above protocol and were visualized as green labeled cells using the fluorescent microscopy (Figure 3). Small clumps of cells (4 – 5 cells together) were also observed in labeled samples. When the cells were injected into the mouse circulation, labeled leukocytes were visualized in the retinal circulation (Figure 4). After the labeling, both the erythrocytes and leukocytes were immediately injected into the mice and visualized at 30 and 60 min time intervals. Fluorescently labeled cells were observed immediately after the injection, but the fluorescence intensities gradually decreased at 30 and 60 min time intervals. We also used the leukocyte staining protocol (1% sodium fluorescein) on the erythrocytes and observed no labeling of the erythrocytes. Using the Mtrack J plugin on the Image J public domain software, the cells were tracked in the retinal circulation (Figure 5).
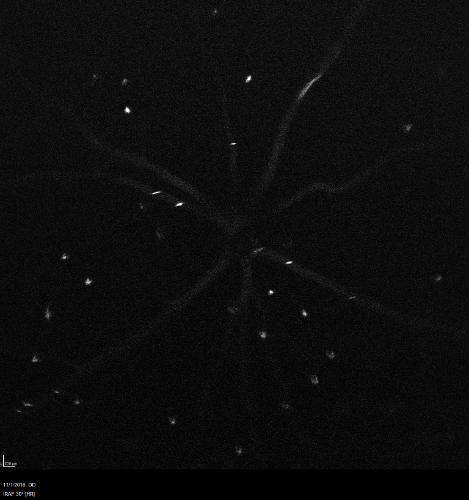
Figure 1: 1% Hematocrit of 1.5% ICG Labeled Erythrocytes in the Retinal Circulation. The ICG labeled individual erythrocytes displaying bright signals in the retinal vessels. Some erythrostasis was observed in the peripapillary region. Scale = 200 µm. Please click here to view a larger version of this figure.
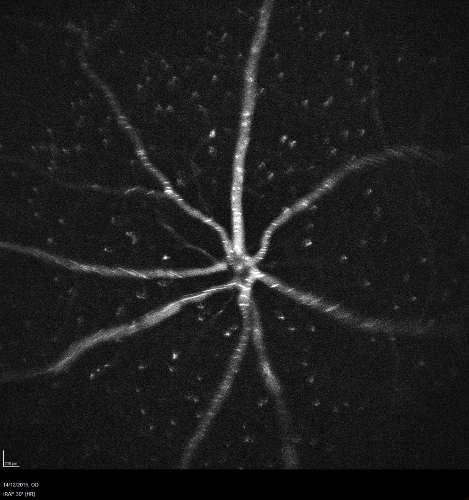
Figure 2: 5% Hematocrit of 1.5% ICG Labeled Erythrocytes in Retinal Circulation. Many ICG labeled erythrocytes displaying bright signals in the retinal vessels; a large amount of erythrostasis was observed in the peripapillary region. Scale = 200 µm. Please click here to view a larger version of this figure.

Figure 3: Fluorescence Microscopy Image of 1% Sodium Fluorescein Labeled Leukocytes. Sodium fluorescein labeled leukocytes showing green fluorescent signals with small clumps (20X magnification; scale = 50 µm). Please click here to view a larger version of this figure.
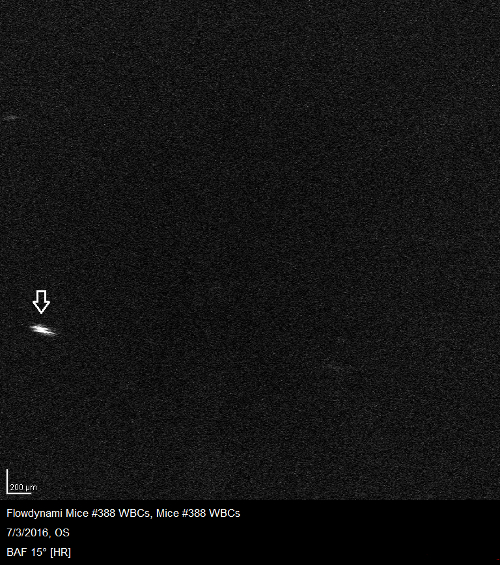
Figure 4: 1% Sodium Fluorescein Labeled Leukocytes in Retinal Circulation. Sodium fluorescein labeled leukocyte (arrow) showing bright signal in the retinal vessels. Scale = 200 µm. Please click here to view a larger version of this figure.
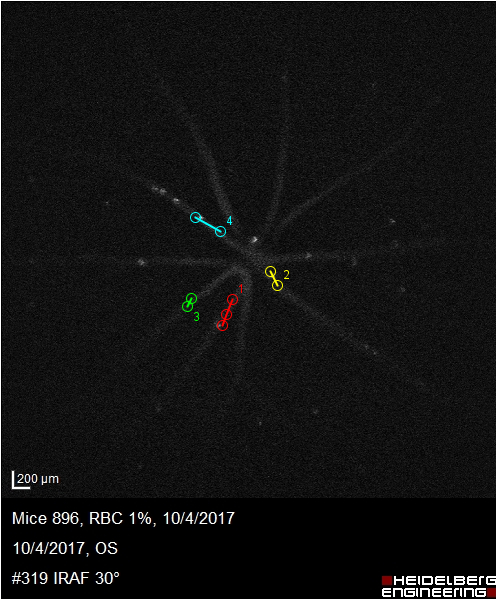
Figure 5: Tracking of Labeled Individual Cells in Retinal Circulation using Image Analysis software. Different tracks (colored circles and lines as represented on the image) were measured to compute the average velocity of the labeled cells in the retinal circulation.
Discussion
Studying the hemodynamics in the retinal and choroidal circulation is vital for understanding the pathophysiology of many ocular diseases. The blood flow dynamics in the retinal circulation can be studied by Fourier-domain optical coherence tomography (FD-OCT), laser speckle flowgraphy (LSFG) and retinal oximetry. Although these methods use different approaches to study the total blood flow in the retinal circulation40,41,42,43,44,45, they share the limitation of the inability to study the flow dynamics of individual cell types. The nutrients and oxygen supply to the retinal and choroidal tissues, as well as the migration of immune cells in ocular inflammatory diseases and their role in the disease pathogenesis, can be studied by investigating the flow dynamics of erythrocytes and leukocytes in retinal and choroidal circulation, respectively. Labeling techniques coupled with imaging methods will help to track the labeled cells in the circulation and to study the flow dynamics of the labeled cells. Several fluorescent dyes were successfully applied to label the leukocytes and erythrocytes for investigation of their flow dynamics in the circulation3,17,18,19.
Here, we report the application of Food and Drug Administration approved non-toxic fluorescent dyes, indocyanine green and sodium fluorescein, for the labeling and visualization of the erythrocytes and leukocytes in the retinal circulation, respectively. Although sodium fluorescein is the most commonly used dye for tracking the leukocytes31,32,33,34, the advantage of simultaneously labeling erythrocytes and leukocytes with ICG and sodium fluorescein, respectively is efficient visualization of labeled cells concurrently in the animal's eye by changing the filters in the SLO. SLO is a non-invasive method of retinal imaging that is extensively used in the study of pathological changes in various retinal diseases in humans and animals. It can also help in comparing retinal changes in response to a given treatment46.
To achieve quality images in the SLO, the pupils need to be fully dilated and the contact lens must be used with ophthalmic gel to maintain a moist cornea and prevent cataract formation. The position of the eyes and the optical path of the camera must be straight to achieve quality fundus and angiogram images. The animal should be deeply sedated to minimize movement during the imaging. Although both 1% and 5% hematocrit of 1.5% ICG labeled erythrocytes demonstrated the visualization of fluorescently labeled cells in the retinal circulation, 1% hematocrit was better suited for monitoring the individual cells. Fluorescently labeled cells cannot be visualized if the number of injected leukocytes is too low. Therefore, to achieve better results in monitoring the labeled cells in the retinal circulation, it is recommended to collect leukocytes from at least 4 mice, label with 1% sodium fluorescein, and inject into a single mouse. Although there are some alternative dyes for sodium fluorescein (Calcein, FITC, DIO, FDA and CFDA with absorption/emission maxima similar to or near sodium fluorescein), the dye retention rate and toxicity to ocular tissues must be evaluated9,12,13,14,17.
The limitation of the reported technique is the fading of the fluorescent signal in circulation after 60 min. Therefore, the flow dynamics of the labeled cells must be analyzed within 60 min. Here, to label leukocytes, blood was withdrawn from one mouse, cells were isolated, labeled, injected into another mouse, and visualized by SLO. However, in SLO, only 0 – 1 cell per frame was observed in retinal blood vessels. This could be due to insufficient leukocyte cell number and so we recommend to collect blood from at least 3 – 4 mice to visualize a higher cell number per frame. The camera speed of 8.8 frames/s was used in the study, but this could be increased to achieve more sequential images and videos of the labeled cells.
Earlier studies reported changes in blood flow velocity in the retinal circulation of diabetic patients with different stages of DR. Clermont et al. reported a 33% decrease of the retinal blood flow in patients with early stage of DR47, and Nguyen et al. reported an increase in the retinal blood flow in diabetic patients with proliferative DR48. A decreased blood flow velocity was also reported to be associated with progressive glaucoma49. In the aforementioned studies, the authors investigated the whole blood flow velocities in the retinal circulation. Studying the flow velocities of each cell type can provide information about the cellular interactions in different diseases and at different stages of disease and may help in prognosis. Here we report a method to label the erythrocytes and leukocytes with ICG and sodium fluorescein, respectively and their visualization in the retinal circulation; this method can be applied on any disease model for in vivo studies.
Future research can utilize our labeling techniques using SLO to study the variation in flow dynamics of the labeled erythrocytes and leukocytes under different drug treatment conditions at various stages of the disease. Furthermore, our methods can help understand the role of erythrocytes and leukocytes in disease phenotypes.
Disclosures
The authors have nothing to disclose.
Acknowledgements
The research project was funded under New Investigator grant from the National Medical Research Council (NMRC), Singapore. The team will like to acknowledge the research training provided to Dr Agrawal at Institute of Ophthalmology (IoO), University College London (UCL) under National Medical Research Council (NMRC) Overseas Research Training Fellowship from November 2012 till October 2014 under mentorship of Prof. David Shima. Dr. Agrawal acquired the concept and skills for labelling the cells and live imaging in Dr. Shima's lab. The team will hence like to acknowledge supervision and guidance during the training fellowship from Prof. David Shima, Pro.f Kenith Meissner, Dr. Peter Lundh and Dr. Daiju Iwata.
Materials
| Cardiogreen polymethine dye (Indocyanine green) | Sigma Aldrich | 12633-50MG | |
| Fluorescein 100 mg/mL | Novartis | U1705A/H-1330292 | |
| 10X Phosphate-buffered saline (PBS) Ultra Pure Grade | 1st BASE | BUF-2040-10X1L | |
| Bovine serum albumin | Sigma Aldrich | A7906-100G | |
| Microtainer tubes with K2E (K2EDTA) – EDTA concentration – 1.8 mg/mL of blood | BD, USA | REF 365974 | |
| Histopaque 1077 solution | Sigma Aldrich | 10771 | |
| Centrifuge 5810 R | Eppendorf | 05-413-401 | |
| Microcentrifuge tubes 2mL | Axygen | MCT-200-C-S | |
| Vortex mixer | Insta BioAnalytik pte. ltd | FINE VORTEX | |
| Shaker incubator | Lab Tech | ||
| Ceva Ketamine injection (Ketamine hydrochloride 100mg/mL) | Ceva | KETALAB03 | |
| ILIUM XYLAZIL-20 (Xylazine hydrochloride 20mg/Ml) | Troy Laboratories PTY. Limited | LI0605 | |
| 1% Mydriacyl 15 mL (Tropicamide 1%) | Alcon Laboratories, Inc. USA | NDC 0998-0355-15 | |
| 2.5% Mydfrin 5 mL (Phenylephrine hydrochloride 2.5%) | Alcon Laboratories, Inc. USA | NDC 0998-0342-05 | |
| Terumo syringe with needle 1cc/mL Tuberculin | Terumo (Philippenes) Corporation, Philippines | SS-01T2613 | |
| Vidisic Gel 10G | Dr. Gerhard Mann, Chem.-Pharm, Fabrik Gmbh, Berlin, Germany | ||
| Alcohol swabs | Assure medical disposables | 7M-004-L-01 | |
| Confocal laser scanning angiography system (Heidelberg Retina Angiograph 2) | Heidelberg Engineering, GmbH, Heidelberg, Germany | ||
| Hiedelberg Spectralis Viewing Module software, v4.0 | Heidelberg Engineering, GmbH, Heidelberg, Germany | ||
| Fluorescent microscope | ZEISS | Model: axio imager z1 |
References
- Khoobehi, B., Peyman, G. A. Fluorescent vesicle system. A new technique for measuring blood flow in the retina. Ophthalmology. 101 (10), 1716-1726 (1994).
- Beem, E., Segal, M. S. Evaluation of stability and sensitivity of cell fluorescent labels when used for cell migration. J Fluoresc. 23 (5), 975-987 (2013).
- Parish, C. R. Fluorescent dyes for lymphocyte migration and proliferation studies. Immunol Cell Biol. 77 (6), 499-508 (1999).
- Khoobehi, B., Peyman, G. A. Fluorescent labeling of blood cells for evaluation of retinal and choroidal circulation. Ophthalmic Surg Lasers. 30 (2), 140-145 (1999).
- Nowak, J. Z. Age-related macular degeneration (AMD): pathogenesis and therapy. Pharmacol Rep. 58 (3), 353-363 (2006).
- Antonetti, D. A., Klein, R., Gardner, T. W. Diabetic retinopathy. N Engl J Med. 366 (13), 1227-1239 (2012).
- Rannie, G. H., Thakur, M. L., Ford, W. L. An experimental comparison of radioactive labels with potential application to lymphocyte migration studies in patients. Clin Exp Immunol. 29, 509-514 (1977).
- Ford, W. L. The preparation and labeling of lymphocytes. Handbook of Experimental Immunology. 3, (1978).
- Weston, S. A., Parish, C. R. New fluorescent dyes for lymphocyte migration studies: Analysis by flow cytometry and fluorescence microscopy. J Immunol Meth. 133, 87-97 (1990).
- Brenan, M., Parish, C. R. Intracellular fluorescent labeling of cells for analysis of lymphocyte migration. J Immunol Meth. 74, 31-38 (1984).
- Samlowski, W. E., Robertson, B. A., Draper, B. K., Prystas, E., McGregor, J. R. Effects of supravital fluorochromes used to analyze the in vivo homing of murine lymphocytes on cellular function. J Immunol Meth. 144, 101-115 (1991).
- DeClerck, L. S., Bridts, C. H., Mertens, A. M., Moens, M. M., Stevens, W. J. Use of fluorescent dyes in the determination of adherence of human leukocytes to endothelial cells and the effect of fluorochromes on cellular function. J Immunol Meth. 172, 115-124 (1994).
- Chiba, K., et al. FTY720, a novel immunosuppressant, induced sequestration of circulating mature lymphocytes by acceleration of lymphocyte homing in rats. I. FTY720 selectively decreases the number of circulating mature lymphocytes by acceleration of lymphocyte homing. J Immunol. 160, 5037-5044 (1998).
- Butcher, E. C., Weissman, I. L. Direct fluorescent labeling of cells with fluorescein or rhodamine isothiocyanate. I. Technical aspects. J Immunol Meth. 37, 97-108 (1980).
- Butcher, E. C., Scollay, R. G., Weissman, I. Direct fluorescent labeling of cells with fluorescein or rhodamine isothiocyanate. II. Potential application to studies of lymphocyte migration and maturation. J Immunol Meth. 37, 109-121 (1980).
- Lyons, A. B., Parish, C. R. Determination of lymphocyte division by flow cytometry. J Immunol Meth. 171, 131-137 (1994).
- Unthank, J. L., Lash, J. M., Nixon, J. C., Sidner, R. A., Bohlen, H. G. Evaluation of carbocyanine-labeled erythrocytes for microvascular measurements. Microvasc Res. 45, 193-210 (1993).
- Slezak, S. E., Horan, P. K. Fluorescent in vivo tracking of hematopoietic cells. Part I. Technical considerations. Blood. 74, 2172-2177 (1989).
- Teare, G. F., Horan, P. K., Slezak, S. E., Smith, C., Hay, J. B. Long-term tracking of lymphocytes in vivo: The migration of PKH-labeled lymphocytes. Cell Immunol. 134, 157-170 (1991).
- Johnsson, C., Festin, R., Tufveson, G. T., Tötterman, T. H. Ex vivo PKH26-labeling of lymphocytes for studies of cell migration in vivo. Scand. J Immunol. 45, 511-514 (1997).
- Khalaf, A. N., Wolff-Vorbeck, G., Bross, K., Kerp, L., Petersen, K. G. In vivo labeling of the spleen with a red-fluorescent cell dye. J Immunol Meth. 165, 121-125 (1993).
- Albertine, K. H., Gee, M. H. In vivo labeling of neutrophils using a fluorescent cell linker. J Leukoc Biol. 59, 631-638 (1996).
- Samlowski, W. E., Robertson, B. A., Draper, B. K., Prystas, E., McGregor, J. R. Effects of supravital fluorochromes used to analyze the in vivo homing of murine lymphocytes on cellular function. J Immunol Meth. 144, 101-115 (1991).
- Manivannan, A., et al. Digital fundus imaging using a scanning laser ophthalmoscope. Physiol Meas. 14, 43-56 (1993).
- Okanouchi, T., Shiraga, F., Takasu, I., Tsuchida, Y., Ohtsuki, H. Evaluation of the dynamics of choroidal circulation in experimental acute hypertension using indocyanine green-stained leukocytes. Jpn J Ophthalmol. 47 (6), 572-577 (2003).
- Zdolsek, J. M., Olsson, G. M., Brunk, U. T. Photooxidative damage to lysosomes of cultured macrophages by acridine orange. Photochem Photobiol. 51, 67-76 (1990).
- Molnar, J., et al. Antiplasmid and carcinogenic molecular orbitals of benz[c]acridine and related compounds. Anticancer Res. 13, 263-266 (1993).
- Fillacier, K., Peyman, G. A., Luo, Q., Khoobehi, B. Study of lymphocyte dynamics in the ocular circulation: technique of labeling cells. Curr Eye Res. 14 (7), 579-584 (1995).
- Horan, P. K., et al. Fluorescent cell labeling for in vivo and in vitro cell tracking. Methods Cell Biol. 33, 469-490 (1990).
- Hossain, P., et al. In vivo cell tracking by scanning laser ophthalmoscopy: quantification of leukocyte kinetics. Invest Ophthalmol Vis Sci. 39 (10), 1879-1887 (1998).
- Yang, Y., Kim, S., Kim, J. Visualization of retinal and choroidal blood flow with fluorescein leukocyte angiography in rabbits. Graefes Arch Clin Exp Ophthalmol. 235 (1), 27-31 (1997).
- Kim, J., Yang, Y., Shin, B., Cho, C. Visualization and flow of platelets and leukocytes in vivo in rat retinal and choroidal vessels. Ophthalmic Res. 29 (6), 374-380 (1997).
- Le Gargasson, J. F., et al. Scanning laser ophthalmoscope imaging of fluorescein-labeled blood cells. Graefes Arch Clin Exp Ophthalmol. 235, 56-58 (1997).
- Yang, Y., Kim, S., Kim, J. Fluorescent dots in fluorescein angiography and fluorescein leukocyte angiography using a scanning laser ophthalmoscope in humans. Ophthalmology. 104 (10), 1670-1676 (1997).
- Yannuzzi, L. A. Indocyanine green angiography: a perspective on use in the clinical setting. Am J Ophthalmol. 151 (5), 745-751 (2011).
- Khoobehi, B., Peyman, G. A. Fluorescent labeling of blood cells for evaluation of retinal and choroidal circulation. Ophthalmic Surg Lasers. 30 (2), 140-145 (1999).
- Kornfield, T. E., Newman, E. A. Regulation of blood flow in the retinal trilaminar vascular network. J Neurosci. 34 (34), 11504-11513 (2014).
- Kornfield, T. E., Newman, E. A. Measurement of Retinal Blood Flow Using Fluorescently Labeled Red Blood Cells. eNeuro. 2 (2), (2015).
- Matsuda, N., et al. Visualization of leukocyte dynamics in the choroid with indocyanine green. Invest Ophthalmol Vis Sci. 37 (11), 2228-2233 (1996).
- Wang, Y., Lu, A., Gil-Flamer, J., Tan, O., Izatt, J. A., Huang, D. Measurement of total blood flow in the normal human retina using Doppler Fourier-domain optical coherence tomography. Br J Ophthalmol. 93 (5), 634-637 (2009).
- Wang, Y., Fawzim, A., Tan, O., Gil-Flamer, J., Huang, D. Retinal blood flow detection in diabetic patients by Doppler Fourier domain optical coherence tomography. Opt Express. 17 (5), 4061-4073 (2009).
- Srinivas, S., Tan, O., Wu, S., Nittala, M. G., Huang, D., Varma, R., Sadda, S. R. Measurement of retinal blood flow in normal Chinese-American subjects by Doppler Fourier-domain optical coherence tomography. Invest Ophthalmol Vis Sci. 56 (3), 1569-1574 (2015).
- Sugiyama, T., Araie, M., Riva, C. E., Schmetterer, L., Orgul, S. Use of laser speckle flowgraphy in ocular blood flow research. Acta Ophthalmol. 88 (7), 723-729 (2010).
- Nakano, Y., Shimazaki, T., Kobayashi, N., Miyoshi, Y., Ono, A., Kobayashi, M., Shiragami, C., Hirooka, K., Tsujikawa, A. Retinal Oximetry in a Healthy Japanese Population. PLoS One. 11 (7), 0159650 (2016).
- Turksever, C., Orgul, S., Todorova, M. G. Reproducibility of retinal oximetry measurements in healthy and diseased retinas. Acta Ophthalmol. 93 (6), 439-445 (2015).
- Sharp, P. F., Manivannan, A., Xu, H., Forrester, J. V. The scanning laser ophthalmoscope-a review of its role in bioscience and medicine. Phys Med Biol. 49 (7), 1085-1096 (2004).
- Clermont, A. C., Aiello, L. P., Mori, F., Aiello, L. M., Bursell, S. E. Vascular endothelial growth factor and severity of nonproliferative diabetic retinopathy mediate retinal hemodynamics in vivo: a potential role for vascular endothelial growth factor in the progression of nonproliferative diabetic retinopathy. Am J Ophthalmol. 124 (4), 433-446 (1997).
- Nguyen, H. T., et al. Retinal blood flow is increased in type 1 diabetes mellitus patients with advanced stages of retinopathy. BMC Endocr Disord. 16 (1), 25 (2016).
- Schumann, J., Orgül, S., Gugleta, K., Dubler, B., Flammer, J. Interocular difference in progression of glaucoma correlates with interocular differences in retrobulbar circulation. Am J Ophthalmol. 129 (6), 728-733 (2000).
