Summary

Assessing Binocular Central Visual Field and Binocular Eye Movements in a Dichoptic Viewing Condition

Published: July 21, 2020
doi:

Summary

Presented here is a protocol for assessing binocular eye movements and gaze-controlled central visual field screening in participants with central vision loss.

Abstract

Macular degeneration typically results in heterogeneous binocular central visual defects. Currently available approaches to assess central visual field, like the microperimetry, can test only one eye at a time. Therefore, they cannot explain how the defects in each eye affect the binocular interaction and real-world function. Dichoptic stimulus presentation with a gaze-controlled system could provide a reliable measure of monocular/binocular visual fields. However, dichoptic stimulus presentation and simultaneous eye-tracking are challenging because optical devices of instruments that present stimulus dichoptically (e.g., haploscope) always interfere with eye-trackers (e.g., infrared video-based eye-trackers). Therefore, the goals were 1) to develop a method for dichoptic stimulus presentation with simultaneous eye-tracking, using 3D-shutter glasses and 3D-ready monitors, that is not affected by interference and 2) to use this method to develop a protocol for assessing central visual field in subjects with central vision loss. The results showed that this setup provides a practical solution for reliably measuring eye-movements in dichoptic viewing condition. In addition, it was also demonstrated that this method can assess gaze-controlled binocular central visual field in subjects with central vision loss.

Introduction

Macular degeneration is generally a bilateral condition affecting central vision and the pattern of visual loss can be heterogeneous. The central visual loss could be either symmetrical or asymmetrical between two eyes1. Currently, there are several techniques available to assess the central visual field in macular degeneration. The Amsler grid chart contains a grid pattern that can be used to manually screen central visual field. Automated perimeters (e.g., Humphrey visual field analyzer) present light flashes of varying brightness and sizes in a standardized ganzfeld bowl to probe the visual field. Gaze-contingent microperimetry presents visual stimulus on an LCD display. Micro-perimeters can compensate micro-eye movements by tracking a region of interest on the retina. Micro-perimeters can probe local regions in the central retina for changes in function but can test only one eye at a time. Consequently, micro-perimetric testing cannot explain how the heterogeneous defects in each eye affect the binocular interaction and real-world function. There is an unmet need for a method to reliably assess visual fields in a viewing condition that closely approximates real-world viewing. Such an assessment is necessary to understand how the visual field defect of one eye affects/contributes to the binocular visual field defect. We propose a novel method for assessing central visual field in people with central visual loss under dichoptic viewing condition (i.e., when visual stimuli are independently presented to each of the two eyes).

To measure visual fields reliably, fixation must be maintained at a given locus. Therefore, it is important to combine the eye-tracking and dichoptic presentation for binocular assessment. However, combining these two techniques can be challenging due to interference between the illuminating systems of the eye-tracker (e.g., infrared LEDs) and the optical elements of the dichoptic presenting systems (e.g., mirrors of haploscope or prisms of stereoscopes). Alternative options are to use an eye-tracking technique that does not interfere with the line of sight (e.g., scleral coil technique) or an eye-tracker that is integrated with goggles2. Though each method has its own benefits, there are disadvantages. The former method is considered invasive and can cause considerable discomfort3 and the latter methods have low temporal resolutions (60 Hz)4. To overcome these issues, Brascamp & Naber (2017)5 and Qian & Brascamp (2017)6 used a pair of cold mirrors (which transmitted infrared light but reflected 95% of the visible light) and a pair of monitors on either side of the cold mirrors to create a dichoptic presentation. Infrared video-based eye-tracker was used to track eye movements in the haploscope setup7,8.

However, using a haploscope-type dichoptic presentation has a drawback. The center of rotation of the instrument (haploscope) is different from the center of rotation of the eye. Therefore, additional calculations (as described in Appendix – A of Raveendran (2013)9) are required for proper and accurate measurements of eye movements. In addition, the planes of accommodation and vergence must be aligned (i.e., demand for accommodation and vergence must be the same). For example, if the working distance (total optical distance) is 40 cm, then the demand for accommodation and vergence is 2.5 diopters and 2.5-meter angles, respectively. If we align the mirrors perfectly orthogonal, then the haploscope is aligned for distant viewing (i.e., required vergence is zero), but the required accommodation is still 2.5D. Therefore, a pair of convex lenses (+2.50 diopters) must be placed between the eye and mirror arrangement of haploscope to push the plane of accommodation to infinity (i.e., required accommodation is zero). This arrangement necessitates more space between the eye and mirror arrangement of haploscope is required, which takes us back to the difference in centers of rotation. The issue of aligning planes of accommodation and vergence can be minimized by aligning the haploscope to the near viewing such that both the planes are aligned. However, this requires measurement of inter-pupillary distance for every participant and the corresponding alignment of haploscope mirrors/stimulus presenting monitors.

In this paper, we introduce a method to combine infrared video-based eye-tracking and dichoptic stimulus presentation using wireless 3D shutter glasses and 3D-ready monitors. This method does not require any additional calculations and/or assumptions like those used with the haploscopic method. Shutter glasses have been used in conjunction with eye trackers for understanding binocular fusion10, saccadic adaptation11, and eye-hand coordination12. However, it should be noted that stereo-shutter glasses used by Maiello and colleagues10,11,12 were the first-generation shutter glasses, which were connected through a wire to synchronize with the monitor refresh rate. Moreover, the first-generation shutter glasses are commercially unavailable now. Here, we demonstrate the use of commercially available second-generation wireless shutter glasses (Table of Materials) to present dichoptic stimulus and reliably measure monocular and binocular eye-movements. Additionally, we demonstrate a method to assess monocular/binocular visual fields in subjects with central visual field loss. While dichoptic presentation of visual stimulus enables monocular and binocular assessment of visual fields, binocular eye tracking under dichoptic viewing condition facilitates visual fields testing in a gaze-controlled paradigm.

Protocol

All the procedures and protocol described below were reviewed and approved by the institutional review board of Wichita State University, Wichita, Kansas. Informed consent was obtained from all the participants.

1. Participant selection

  1. Recruited participants with normal vision (n=5, 4 females, mean ± SE: 39.8 ± 2.6 years), and with central vision loss (n=15, 11 females, 78.3 ± 2.3 years) due to macular degeneration (age-related/juvenile). Note that grossly different ages of the two groups was secondary to demographics of the subjects with central vision loss (age-related macular degeneration affects older subjects and is more prevalent in females). Further, the goal of this study was not comparing the two cohorts.

2. Preparation of the experiment

  1. Use a wireless 3D active shutter glasses (Table of Materials) that can be synced with any 3D-ready monitor. For the shutter glasses to be active, there should be no interference between the infrared transmitter (a small pyramid-shaped black box) and the infrared receiver (sensor) on the nose bridge of the shutter glasses.
  2. Display all the visual stimuli on a 3D monitor (1920 x 1080 pixels, 144 Hz). For the monitor and the 3D glasses to work seamlessly, ensure that appropriate drivers are installed.
  3. Use a table-mounted infrared video-based eye-tracker (Table of Materials) that is capable of measuring eye movements at the sampling of 1000 Hz for this protocol. Separate the infrared illumination and camera of the eye-tracker use any tripod with adjustable height and angle (Table of Materials) to hold them firmly in place. Place the camera at a distance of 20-30 cm from the participant and place the screen at a distance of 100 cm from the participant.
  4. Use an infrared reflective patch (Table of Materials) to avoid the interference between infrared illumination of the eye-tracker and the infrared system of the shutter glasses (Figure 1, Right).
  5. Use commercially available software (Table of Materials) to integrate shutter glasses and 3D ready monitor for dichoptic presentation of visual stimuli to control the eyetracker.
  6. To stabilize the head movements, use a tall and wide chin and forehead rest (Table of Materials) and clamp it to an adjustable table. The wide dimension of the chin and forehead rest allows comfortable positioning of participants with the shutter glasses on.
    NOTE: Figure 1 shows the setup for eye-tracking with dichoptic stimulus presentation using 3D shutter glasses and 3D-ready monitor. The infrared reflective patch was strategically placed below the infrared sensor on the nose bridge of 3D shutter glasses (Figure 1, Right).
  7. Minimize the leakage of luminance information by deactivating the light-boost option in the 3D ready monitor. The leakage of luminance information from one eye to the other eye is known as luminance leakage or crosstalk13. This is prone to occur with the stereoscopic displays in the high luminance conditions.
  8. Because of the shutters, the amount of infrared illumination (from the eye-tracking system) reaching the pupil can be significantly reduced13 – on an average, approximately 65% of luminance was reduced (Supplementary Table 1). To overcome this, increase the strength of the infrared LEDs of the eyetracker to 100% or (the maximum setting) from the default power setting. When using the infrared video-based eye-tracker (Table of Materials) change this setting in the “Illumination power” settings in the left bottom screen as shown in Figure 2.

3. Running the experiment

NOTE: The main experiment of this study was binocular eye tracking and screening of the central visual field using dichoptic stimulus. The central visual field screening was comparable to the visual field testing of commercially available instruments (Table of Materials). The physical properties of the visual stimulus such as luminance of the target (~22 cd/m2), luminance of the background (~10 cd/m2), size of the target (Goldmann III – 4 mm2), the visual field grid (Polar 3 grid with 28 points, Figure 3), and stimulus duration (200 ms) were identical to the visual field testing of commercially available instruments. Note that these luminance values were measured through shutter glasses when the shutter was ON (Supplementary Table 1). For the purposes of testing discussed here, the luminance of the stimulus was constant unlike visual field testing where the luminance of the stimulus is altered to obtain a detection threshold. In other words, the experiment employed supra-threshold screening and not thresholding. Therefore, the results of the screening were binary responses (stimuli seen or not seen) and not numerical values.

  1. Pre-experiment checks
    1. A couple of minutes before the participant arrives for the testing, ensure that both eye tracker and the host computer (that runs the experiment) is turned on and confirm that the host computer is connected to the eyetracker.
    2. As a rule, confirm the synchronization accuracy (using platform specific commands) of the display before beginning the experiment.
  2. Initiating the main experiment
    NOTE: The steps below are very platform specific and is contingent on the script that runs the main experiment. See Supplementary Material that contain the samples of the codes used to design and run the experiment.
    1. Initiate the program (See Supplementary Material – ‘ELScreeningBLR.m’) that runs the main experiment from the appropriate interface. When and if prompted by the program, enter the participant information (such as participant ID, test distance) that is needed to save the output data file in the data folder with a unique filename.
    2. A gray screen with instructions such as “Press Enter to toggle camera; Press C to calibrate, Press V to validate” will appear on the screen. At this stage, adjust the camera of the eye-tracker to align with the participant’s pupil as shown in Figure 2.
  3. Eye-tracker calibration and validation
    1. Initiate the calibration of the eye-tracker. Instruct the participants to follow the target by moving the eyes (and not head) and look at the center of the target.
    2. After the successful calibration, initiate the validation. Provide the same instructions as the calibration.
    3. Read the results of the validation step (usually displayed on the screen). Repeat the calibration and validation until “good/fair” (as recommended by the eyetracker manual) result is obtained.
  4. Drift correction
    1. Once the calibration and validation of the eye-tracker is done, initiate the drift correction.
    2. Instruct the participants to “look at the central fixation target and hold their eyes as steady as possible”.
      NOTE: After the calibration, validation, and drift correction, the eye-tracking will be initiated simultaneously with the main experiment.
  5. Visual field screening
    1. Re-instruct/remind the participant about the task that he/she must do during the experiment. Ask subjects to keep both eyes open during the entire testing.
    2. For this visual field experiment, instruct them to hold the fixation at the central fixation target while responding to “any white light seen” by pressing the “enter” button in the response button (Figure 1, Table of Materials). Instruct them not to move the eyes and search for the new white lights. Also, remind them that the brief white lights can appear at any location on the screen.
      NOTE: During visual field screening, the functioning of shutter glasses can be probed using monocular targets that can be fused to form a complete percept (See Supplementary Figure 2 – catch trials).
    3. Re-iterate the instruction to “hold fixation” several times throughout the experiment to ensure the fixation falls within the desired area.
      NOTE: An audio feedback (like an error tone) can be used to alert loss of fixation (like eyes moved outside a tolerance window). When fixation lapses, reinstruct the participant to fixate only on the cross target. The visual stimuli presentation can be temporarily stopped until the participant brings the fixation back within the tolerance window (like central 2°).
    4. At the end of the visual field experiment, the screen will display the result of the testing highlighting the seen and non-seen locations differently (like for example Figure 6).
  6. Saving the data file
    1. All the visual field data (say saved as “. mat” file) and eye-movement data (say saved as “.edf” file) will be saved automatically for post-hoc analysis. However, ensure that the files have been saved before quitting the program/platform running the experiment.

4. Analysis

NOTE: The analysis of eye movement and visual field data can be performed in several ways and is contingent on the software used to run the experiment and data format of eye tracker’s output. The steps below are specific to the setup and the program (See Supplementary Materials).

  1. Eye movement analysis (post-hoc)
    NOTE: The saved eye movements data file (EDF) is a highly compressed binary format, and it contains many types of data, including eye movement events, messages, button presses, and gaze position samples.
    1. Convert EDF to ASC-II files using a translator program (EDF2ASC).
    2. Run ‘PipelineEyeMovementAnalysisERI.m’ to initialize eye movement analysis and follow the instructions as noted in the code (See Supplementary Materials for the code script).
    3. Run ‘EM_plots.m’, to extract horizontal and vertical eye positions and to plot as shown in Figure 4 and Figure 5.
      NOTE: Eye movement data can be further analyzed to compute fixation stability, detect microsaccades, etc. However, this is beyond the scope of the current paper.
  2. Visual fields
    1. To get the reports of visual field test, run ‘VF_plot.m’.
      NOTE: All datasets pertaining to the visual field experiment such as points seen/not seen will be plotted as a visual field map as shown in Figure 6. If a point was seen, then it will be plotted as “green” filled square, otherwise a red filled square will be plotted. No post-hoc analysis for visual field data will be required.

Representative Results

The representative binocular eye-movement traces of one observer with normal binocular vision during two different viewing conditions is shown (Figure 4). Continuous tracking of eye movements was possible when both eyes viewed the stimulus (Figure 4A), and when the left eye viewed the stimulus with the right eye under an active shutter (Figure 4B). As evident from these traces, the proposed method does not impact the quality of eye-movement measurement and can measure the eye movements for even long duration experiments. We then demonstrated that the method can be used to reliably measure eye movements even in challenging participants with central vision loss (Figure 5). An important application of the method is screening the central visual field in subjects with (Figure 6) and without (Supplementary Figure 1) central vision loss. The method provides a way to document the impact of central vision loss in real world viewing with both eyes open. In this representative observer (S7 in Supplementary Table 2), binocular advantage was observed (i.e., seeing a greater number of points with both eyes compared to the right/left eyes). Preliminary analysis (Supplementary Table 2) of the visual field test results of all participants with central vision loss demonstrates the benefit of binocular viewing (compared to non-dominant eye viewing condition). One-way ANOVA revealed that there is a significant main effect of the viewing condition [F (2,28) =6.51, p=0.004]. Post-hoc (Tukey HSD) showed that participants with central vision loss saw greater number of points in the binocular viewing condition compared to non-dominant viewing condition (p<0.01), but not dominant eye viewing condition (p=0.43).

Figure 1
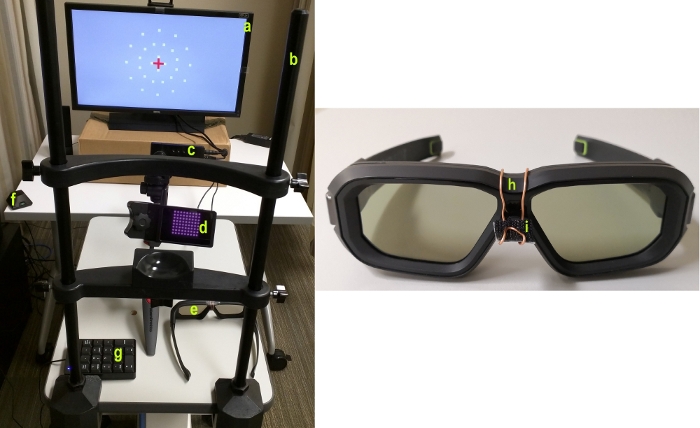
Figure 1: Eye tracking and dichoptic presentation setup.
Left – Equipment setup showing (a) 3D-ready monitor, (b) chin/forehead rest, (c & d) EyeLink eyetracker camera and infrared illumination source (table mounted), (e & f) 3D shutter glasses and its IR transmitter and (g) response button. Right –3D shutter glasses with (h) infrared sensor on the nose-bridge and (i) Infrared reflective patch strategically placed below the sensor and held in place by a thin wire. Please click here to view a larger version of this figure.

Figure 2
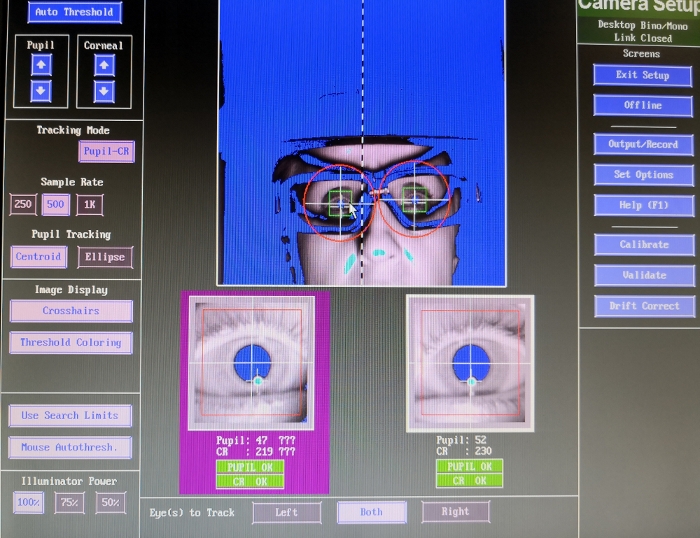
Figure 2: Screen grab of the eye tracker settings.
The figure shows that the infrared illumination power setting (bottom left corner) can be toggled between 50%, 75%, and 100%. This figure also shows the proper alignment of pupil. Please click here to view a larger version of this figure.

Figure 3
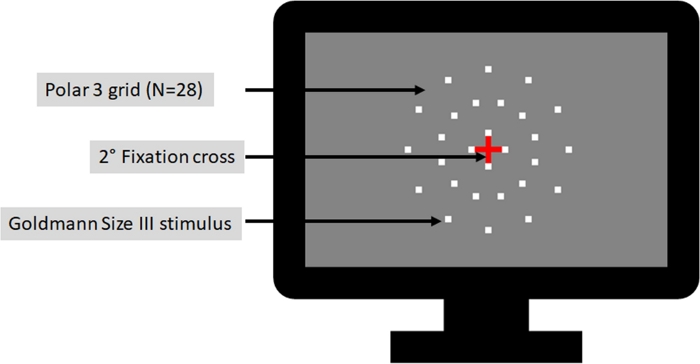
Figure 3: Illustration of visual field test grid.
Pictorial representation showing Polar 3 grid (N = 28, in 3 concentric rings of 2.3°, 6.6°, and 11° in diameter, respectively) visual field test design. Testing parameters were similar to commercially available instruments. Please click here to view a larger version of this figure.

Figure 4
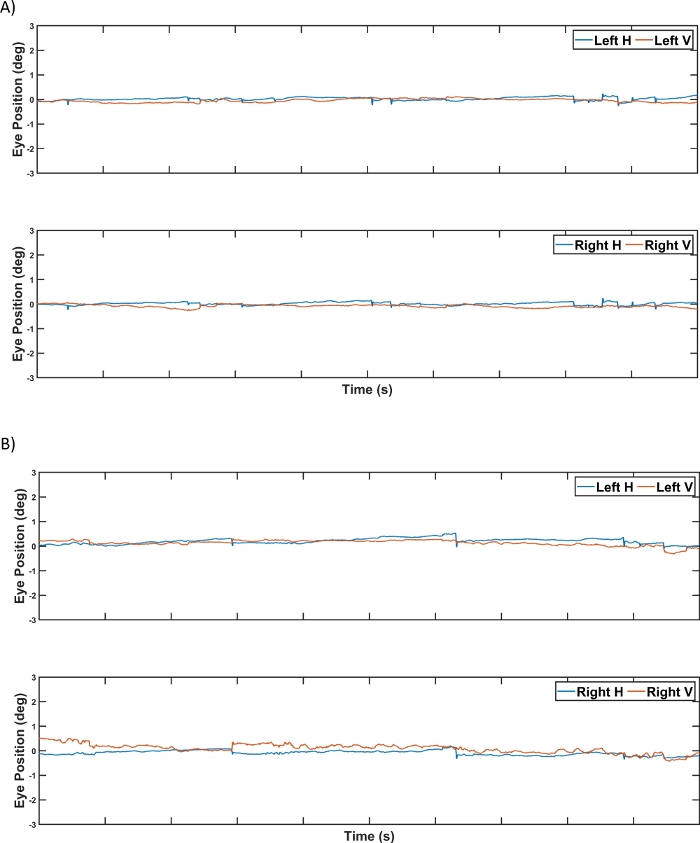
Figure 4: Binocular eye tracking in a subject with normal vision.
Representative binocular eye-movement traces of a control participant: (A) horizontal and vertical eye positions of the left eye (top) and the right eye (bottom) when the visual stimuli were presented dichoptically to both eyes; and (B) horizontal and vertical eye positions of the left eye and the right eye when the visual stimuli were presented dichoptically only to the left eye. Each unit on the x-axis and y-axis represents one second and one degree, respectively. Please click here to view a larger version of this figure.

Figure 5
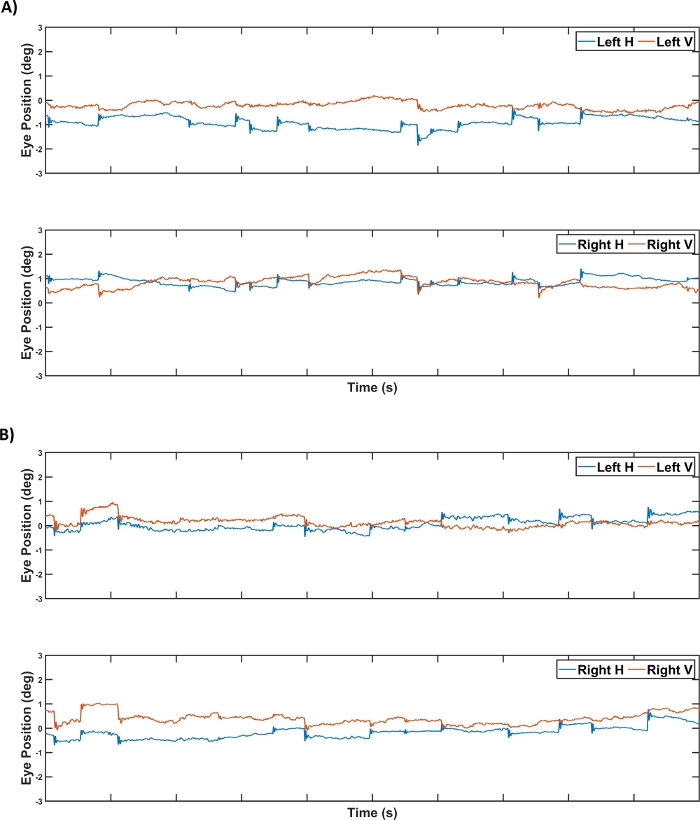
Figure 5: Binocular eye tracking in a subject with central vision loss.
Representative binocular eye movement traces of a participant with macular degeneration: (A) horizontal and vertical eye positions of the left eye (top) and the right eye (bottom) when the visual stimuli were presented dichoptically to both eyes, and (B) horizontal and vertical eye positions of the left eye and the right eye when the visual stimuli were presented dichoptically only to the left eye. Each unit on the x-axis and y-axis represents one second and one degree, respectively. It should be noted that despite larger fixational eye movements in the patient with central vision loss (compare it with Figure 4), reliable eye-tracking was feasible. Please click here to view a larger version of this figure.

Figure 6
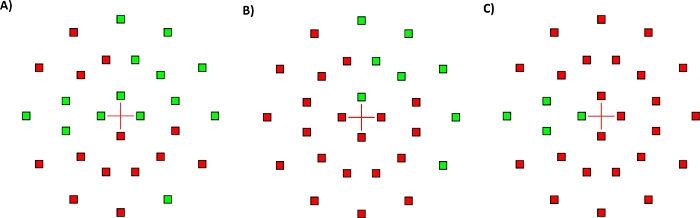
Figure 6: Visual field screening test results of a subject with central vision loss.
Results of visual field screening (N=28) in a representative participant with central vision loss (S7 in Supplementary Table 2). Visual stimulus presented to both eyes (left), to the left eye only (middle), and to the right eye only (right). Fixation cross is shown in the center and the visual field locations where the brief white stimulus was seen are shown as green filled squares. The locations that did not see the stimulus are shown as red filled squares. Proportion seen in the three viewing conditions were 0.50 (14/28, both eyes viewing, left); 0.29 (8/28, LE viewing, middle); and 0.14 (4/28, RE viewing, right). Please click here to view a larger version of this figure.

Supplementary Figure 1: Visual field screening test results of a control subject. Results of visual field screening (N=28) in a representative control participant. Visual stimulus presented to both eyes (top), to the left eye only (middle), and to the right eye only (bottom). Fixation cross is shown in the center and the visual field locations where the brief white stimulus was seen are shown as green filled squares. The locations that did not see the stimulus are shown as red filled squares. Proportion seen in the three viewing conditions were 1.00 (28/28, both eyes viewing, top); 1.00 (28/28, LE viewing, middle); and 0.93 (26/28, RE viewing, bottom). Please click here to download this figure.

Supplementary Figure 2: Catch Trials – Probing the functioning of shutter glasses. Catch trials ascertained uninterrupted communication of stereoscopic glasses with IR emitter and synchronization with the stereo display. The central image illustrates a perception that should be reported by subject (red cross and a red/green/yellow square) if the synchronization works. The dimensions of the cross target (and the individual bars) were identical to the fixation cross used for visual field screening and the outer square border corresponds to the 4° tolerance window. Note that suppression of worse seeing eye, which is more likely in subjects with grossly dissimilar visual acuities, can confound the subjective perceptual reports. For the catch trials (every 10 trials), red horizontal bar enclosed in a red square seen only by the left eye and red vertical bar enclosed in a green square seen only by the right eye (2° x 0.4°) were used. The monocular targets could be fused to perceive a red central cross, if the stereoscopic mode was ON throughout and if the shutter glasses functioned properly. This step ascertained that the two infrared light sources did not interfere, and the shutter glasses were synchronized with the 3D-ready monitor. Please click here to download this figure.

Supplementary Table 1: Luminance of background and the stimulus. The luminance of the gray background and the white stimulus measured with and without the shutter glasses at the eye level of presumed subject. The shutter glasses reduce the luminance by approximately 65%. It is important to account for the transmission loss when presenting visual stimulus of set luminance and contrast. Note that the infrared illumination power of the eye tracker (always set to 100% in our testing) has no role in these measurements. Please click here to download this table.

Supplementary Table 2: Summary of visual field testing in central field loss participants. Visual field performance by participants with central vision loss in dominant eye, non-dominant eye, and binocular viewing conditions. Abbreviations: DE – dominant eye; NDE – non-dominant eye; BE – both eyes. Binocular ratios for DE was calculated by finding the ratio between proportion of points seen during BE and DE viewing conditions. Similarly, the binocular ratio for NDE was also calculated. Ratio of >1 suggests binocular advantage (i.e., better performance under binocular viewing condition). Overall, a greater number of points was seen in BE viewing condition compared to NDE viewing condition. Please click here to download this table.

Supplementary Materials.  Please click here to download these materials.

Discussion

The proposed method of measuring eye movements in dichoptic viewing condition has many potential applications. Assessing binocular visual fields in participants with central vision loss that is demonstrated here is one such application. We used this method to assess binocular visual field in fifteen participants with central vision loss to study how binocular viewing influences the heterogeneous central visual field loss.

The most important step in the protocol is positioning (distance from eye and angle) the infrared source of the eye tracker for optimal illumination. This is critical for the eye tracker to capture both corneal reflex and pupil center consistently. Once this was achieved, the tracking should be continuous even in subjects with prescription glasses and in those with central vision loss. It is important to watch for postural changes in subjects, especially head tilts (with head and chin rested) during prolonged testing as it can interfere with eye tracking. Postural changes and fatigue can be minimized by reducing the overall test duration. In challenging subjects, the test duration is primarily driven by time taken to achieve a successful calibration/validation. The overall test duration for the procedure was about 45 minutes in subjects with macular degeneration. The positioning of the infrared reflective patch, emitter, and the infrared source of the eye tracker is critical for the uninterrupted functioning of the shutter glasses. The default calibration (like 9-point or HV 9) can be used for participants with normal vision. However, for assessing subjects with central vision loss it might be necessary to use alternatives (like 5-point calibration or HV 5), and/or large custom-made calibration targets (like black square ≈2° in size). These changes to the calibration target can be handled in the scripts used to run the experiment (See Supplementary Materials – ‘ELScreeningBLR.m’). For very challenging participants, calibration target can be pointed using fingers to help them find and point towards the target. Like the calibration process, drift check/correction can be performed using in-built target for participants with normal vision and custom-built larger target for participants with central vision loss. We followed the manufacturer recommendation to perform drift check at the beginning of each session. The gaze offset in degrees of visual angle (or pixels) can be accessed from final output file. However, we did not apply any of these data for our analyses. As an in-built measure of quality, the EyeLink eye tracker repeats the calibration when the drift check fails.

The stimulus design, presentation, and control in the setup were through MATLAB based programs. Python or similar programs could be used for achieving the goals of our study. An important pre-requisite for running time-sensitive vision science experiments is good synchronization between the vertical retrace of the display and the stimulus onset. Before each session, we ran pre-experiment checks of synchronization using platform specific commands. A homogeneous flickering screen indicates good synchronization, whereas an inhomogeneous flicker implies poor synchronization, probably due to some bug or limitation of the graphics hardware or its driver. In addition to the flicker, an emerging pattern of yellow horizontal lines will also be seen in most computers. These lines should be tightly concentrated/clustered in the topmost area of the screen. Distributed yellow lines signal timing issues that can be due to background programs like anti-virus or others in the host computer. We recommend quitting all unnecessary applications and turn on airplane mode (or turn the Wi-Fi off) to minimize timing related artefacts.

Similar to previous studies10,12 we used video-based high-resolution table-mounted eye tracker. However, we believe that the method described here should work equally well with other commercially available eye trackers. The quality of eye movement data for purposes of the method demonstrated in this study should not be impacted by the temporal resolution of the eye tracker. Even lower resolution eye trackers (as low as 60 Hz15) have been used to assess and train subjects with macular degeneration. The viewing distance is determined by several factors including the display resolution and stimulus parameters. Any practicable working distance within the rage of wireless transmitter (<15 feet) can be used. The size of the visual field that can be assessed is contingent on the test distance and display size. In the setup here, the maximal possible was ~30°x17° (W x H). The standard visual field grid (Polar 3) used in this study tests central 11° (diameter) of visual field. The stereoscopic shutter glasses could be replaced with polarizing glasses. Suitable modifications in the setup (say higher resolution display or longer working distance) will be necessary to minimize the impact of reduced resolution secondary to use of polarizing glasses. Moreover, the current method is less expensive than building a haploscope for dichoptic presentation if researchers already have a video-based eye tracker.

We employed a ‘gaze controlled’ paradigm in this study. Gaze-controlled systems collect instantaneous information regarding gaze position (and hence discard trials where the gaze was not within a desired tolerance window) but do not compensate for it. However, the setup here can be used for a gaze contingent testing, where the instantaneous gaze position is not only monitored but also compensated by appropriate modification of stimulus presentation. For example, if the gaze moved from the desired location to the right by ‘x’ degree, then the stimulus can be offset by ‘x’ degree to the right. Studies of simulated vision loss and scotomas use gaze contingent paradigms16,17. Such paradigms can be extremely time-sensitive and their effectiveness depends on several factors including the temporal resolution of the eye-tracker18. For example, an eye-tracker with a temporal resolution of 500 Hz (or one sample every 2 ms) will introduce a temporal delay of at least 2 ms. Although this is trivial, there are usually additional delays due to refresh rate of the stimulus display, computational delays of programming language, etc. Moreover, the proposed method can induce an additional delay due to temporal synchronization between 3D-monitors and 3D-shutter glasses.

Subjects with considerably asymmetric vision loss (say with large interocular differences in visual acuity or if the scotoma in one eye is relatively large) can be effectively monocular when viewing binocularly. Subjects with grossly dissimilar vision loss, nystagmus, high refractive error, and strabismus cannot be assessed using this setup. Subjects with systemic conditions like head tremors and Parkinson’s disease will not be good candidates for eye tracking. Subjects with neck or back problems will need frequent breaks and briefer test protocols. The reduction in luminance through the active shutters necessitates use of displays with broader luminance range. Achieving optimal infrared illumination and continuous tracking of the corneal reflex and pupillary center can be challenging in subjects with prescription eyeglasses.

Several studies have used dichoptic stimulus presentation that is presenting two separate images to participant’s two eyes to study the binocular functions such as stereopsis14, suppression18. However, these studies lack eye movements information because of the technical difficulties of combining dichoptic visual stimulus presentation and eye-tracking. Eye movements provide crucial insights about cognitive functions like covert/overt spatial attention. The proposed method of measuring eye movements in a dichoptic viewing condition will better the understanding of the binocular function in subjects with normal vision and in subjects with central vision loss. Amsler grid chart provides only qualitative information about the visual field and the retina-tracking perimeters cannot assess the binocular fields. The setup here incorporating eye tracking and dichoptic testing provides one way to reliably screen central visual field in macular degeneration. A potential application of the proposed method is in the field of virtual reality. All the commercially available virtual reality headsets use the concept of dichoptic presentation of visual stimulus. Many asthenopic symptoms have been associated with dysfunctional eye-movements (e.g., vergence eye-movements) while using virtual reality environment10,15. The proposed method would help us to study eye-movements and visual function during dichoptic presentation, which can be related to virtual reality environment.

In summary, we detailed a method to assess 1) binocular eye movements and 2) monocular/binocular visual field while dichoptically presenting visual stimulus using wireless 3D-shutter glasses and 3D-ready monitor. We demonstrated that our method is feasible even in challenging participants such as those with central vision loss.

Disclosures

The authors have nothing to disclose.

Acknowledgements

This research was funded by LC Industries Postdoctoral research fellowship to RR and Bosma Enterprises Postdoctoral research fellowship to AK. The authors would like to thank Drs. Laura Walker and Donald Fletcher for their valuable suggestions and help in subject recruitment.

Materials

3D monitor Benq NA Approximate Cost (in USD): 500
https://zowie.benq.com/en/product/monitor/xl/xl2720.html
3D shutter glass NVIDIA NA Approximate Cost (in USD): 300
https://www.nvidia.com/object/product-geforce-3d-vision2-wireless-glasses-kit-us.html
Chin/forehead rest UHCO NA Approximate Cost (in USD): 750
https://www.opt.uh.edu/research-at-uhco/uhcotech/headspot/
Eyetracker SR Research NA Approximate Cost (in USD): 27,000
https://www.sr-research.com/eyelink-1000-plus/
IR reflective patch Tactical NA Approximate Cost (in USD): 10
https://www.empiretactical.org/infrared-reflective-patches/tactical-infrared-ir-square-patch-with-velcro-hook-fastener-1-inch-x-1-inch
MATLAB Software Mathworks NA Approximate Cost (in USD): 2150
https://www.mathworks.com/pricing-licensing.html
Numerical Keypad Amazon CP001878 (model), B01E8TTWZ2 (ASIN) Approximate Cost (in USD): 15
https://www.amazon.com/Numeric-Jelly-Comb-Portable-Computer/dp/B01E8TTWZ2
Psychtoolbox – Add on Freeware NA Approximate Cost (in USD): FREE
http://psychtoolbox.org/download.html
Tripod (Dekstop) Manfrotto MTPIXI-B (model), B00D76RNLS (ASIN) Approximate Cost (in USD): 30
https://www.amazon.com/dp/B00D76RNLS

References

  1. Fletcher, D. C., Schuchard, R. A. Preferred retinal loci relationship to macular scotomas in a low-vision population. Ophthalmology. 104 (4), 632-638 (1997).
  2. Raveendran, R. N., Babu, R. J., Hess, R. F., Bobier, W. R. Transient improvements in fixational stability in strabismic amblyopes following bifoveal fixation and reduced interocular suppression. Ophthalmic & Physiological Optics. 34, 214-225 (2014).
  3. Nyström, M., Hansen, D. W., Andersson, R., Hooge, I. Why have microsaccades become larger? Investigating eye deformations and detection algorithms. Vision Research. , (2014).
  4. Raveendran, R. N., Babu, R. J., Hess, R. F., Bobier, W. R. Transient improvements in fixational stability in strabismic amblyopes following bifoveal fixation and reduced interocular suppression. Ophthalmic and Physiological Optics. 34 (2), (2014).
  5. Brascamp, J. W., Naber, M. Eye tracking under dichoptic viewing conditions: a practical solution. Behavior Research Methods. 49 (4), 1303-1309 (2017).
  6. Qian, C. S., Brascamp, J. W. How to build a dichoptic presentation system that includes an eye tracker. Journal of Visualized Experiments. (127), (2017).
  7. Raveendran, R. N., Bobier, W. R., Thompson, B. Binocular vision and fixational eye movements. Journal of Vision. 19 (4), 1-15 (2019).
  8. . Binocular vision and fixational eye movements Available from: https://uwspace.uwaterloo.ca/handle/10112/12076 (2017)
  9. . Fixational eye movements in strabismic amblyopia Available from: https://uwspace.uwaterloo.ca/handle/10012/7478 (2013)
  10. Maiello, G., Chessa, M., Solari, F., Bex, P. J. Simulated disparity and peripheral blur interact during binocular fusion. Journal of Vision. 14 (8), (2014).
  11. Maiello, G., Harrison, W. J., Bex, P. J. Monocular and binocular contributions to oculomotor plasticity. Scientific Reports. 6, (2016).
  12. Maiello, G., Kwon, M. Y., Bex, P. J. Three-dimensional binocular eye-hand coordination in normal vision and with simulated visual impairment. Experimental Brain Research. 236 (3), 691-709 (2018).
  13. Agaoglu, S., Agaoglu, M. N., Das, V. E. Motion Information via the Nonfixating Eye Can Drive Optokinetic Nystagmus in Strabismus. Investigative Opthalmology & Visual Science. 56 (11), 6423 (2015).
  14. Erkelens, C. J. Fusional limits for a large random-dot stereogram. Vision Research. 28 (2), 345-353 (1988).
  15. Seiple, W., Szlyk, J. P., McMahon, T., Pulido, J., Fishman, G. A. Eye-movement training for reading in patients with age-related macular degeneration. Investigative Ophthalmology and Visual Science. 46 (8), 2886-2896 (2005).
  16. Aguilar, C., Castet, E. Gaze-contingent simulation of retinopathy: Some potential pitfalls and remedies. Vision Research. 51 (9), 997-1012 (2011).
  17. Pratt, J. D., Stevenson, S. B., Bedell, H. E. Scotoma Visibility and Reading Rate with Bilateral Central Scotomas. Optom Vis Sci. 94 (31), 279-289 (2017).
  18. Babu, R. J., Clavagnier, S., Bobier, W. R., Thompson, B., Hess, R. F., PGH, M. Regional Extent of Peripheral Suppression in Amblyopia. Investigative Opthalmology & Visual Science. 58 (4), 2329 (2017).
  19. Ebenholtz, S. M. Motion Sickness and Oculomotor Systems in Virtual Environments. Presence: Teleoperators and Virtual Environments. 1 (3), 302-305 (1992).
check_url/cn/61338?article_type=t

Play Video

Cite This Article
Raveendran, R. N., Krishnan, A. K. Assessing Binocular Central Visual Field and Binocular Eye Movements in a Dichoptic Viewing Condition. J. Vis. Exp. (161), e61338, doi:10.3791/61338 (2020).

View Video