This protocol is dedicated to the microtubule plus-end visualization by EB3 protein transfection to study their dynamic properties in primary cell culture. The protocol was implemented on human primary skin fibroblasts obtained from Huntington’s disease patients.
Transfection with a fluorescently labeled marker protein of interest in combination with time-lapse video microscopy is a classic method of studying the dynamic properties of the cytoskeleton. This protocol offers a technique for human primary fibroblast transfection, which can be difficult because of the specifics of primary cell cultivation conditions. Additionally, cytoskeleton dynamic property maintenance requires a low level of transfection to obtain a good signal-to-noise ratio without causing microtubule stabilization. It is important to take measures to protect the cells from light-induced stress and fluorescent dye fading. In the course of our work, we tested different transfection methods and protocols as well as different vectors to select the best combination of conditions suitable for human primary fibroblast studies. We analyzed the resulting time-lapse videos and calculated microtubule dynamics using ImageJ. The dynamics of microtubules’ plus-ends in the different cell parts are not similar, so we divided the analysis into subgroups – the centrosome region, the lamella, and the tail of fibroblasts. Notably, this protocol can be used for in vitro analysis of cytoskeleton dynamics in patient samples, enabling the next step towards understanding the dynamics of the various disease development.
Huntington's disease (HD) is an incurable neurodegenerative pathology caused by a mutationin gene encodinghuntingtin protein (HTT). HTT is primarily associated with vesicles and microtubules and is probably involved in microtubule-dependent transport processes1,2. To study the influence of mutant HTT on the microtubule dynamics, we used in vitro visualization of the EB3 protein, that regulates the dynamic properties of microtubules by binding and stabilizing the growing plus-ends. To load fluorescently labeled EB3 into human skin fibroblasts, plasmid transfection was applied. We used the primary fibroblast culture obtained from the HD patients' skin biopsy for this study.
The mutation in the HTT protein gene leads to elongation of the polyglutamine tract3. HTT has a role in such cellular processes as endocytosis4, cell transport1,2, protein degradation5, etc. Substantial part of these processes involves various elements of the cell cytoskeleton, including the microtubules.
Human primary cells are the best model to reproduce events occurring in patient cells as closely as possible. To create such models, one needs to isolate cells from human biopsy material (e.g., from surgical samples). The resulting primary cell line is suitable to study pathogenesis using various genetic, biochemical, molecular, and cell biology methods. Also, human primary cell cultures serve as a precursor for creating various transdifferentiated and transgenic cultures6.
However, in contrast to immortalized cell cultures, the significant disadvantage of primary cells is their limited passage capacity. Therefore, we recommend using cells in the early passages stage (up to 15). Older cultures degenerate very quickly, losing their unique properties. Thus, the newly obtained primary cells should be kept frozen for long-term storage.
Primary cell cultures are susceptible to cultivation conditions. Therefore, they often require unique approaches and optimization of growing conditions. In particular, the human skin primary fibroblasts used in our experiments are demanding on the substrate. Hence, we used various additional coatings (e.g., gelatin or fibronectin) depending on the experiment type.
The cell cytoskeleton determines the cell shape, mobility, and locomotion. The dynamics of the cytoskeleton are crucial for many intracellular processes both in interphase and mitosis. In particular, the cytoskeleton polymerized from tubulin, are highly dynamic and polar structures, enabling motor protein-mediated directed intracellular transport. The microtubules' ends are in constant rearrangement, their assembly phases alternate with the disassembly phases, and this behavior is called "dynamic instability"7,8,9. Various associated proteins shift the equilibrium of the polymerization reaction, leading either to the polymer formation or the protein monomer formation. The addition of tubulin subunits occurs mainly at the plus-end of microtubules10. The end-binding (EB) proteins family consists of three members: EB1, EB2, and EB3. They serve as plus-end-tracking proteins (+TIPs) and regulate the dynamic properties of microtubules by binding and stabilizing their growing plus-ends11.
Many studies use fluorescent molecule-labeled tubulin microinjection or transfection with time-lapse imaging and video analysis to visualize microtubules in vitro. These methods might be invasive and harmful to cells, especially primary human cells. The most challenging step is to find conditions for cell transfection. We tried to reach the highest possible level of transfection without affecting viability and native cell morphology. This study applies the classical method to study the differences in microtubule dynamics in skin fibroblasts of healthy donors and patients with Huntington's disease.
This protocol follows the guidelines of the Federal Research and Clinical Center of Physical-Chemical Medicine of Federal Medical Biological Agency dated September 08, 2015.
NOTE: Figure 1 gives an overview of the protocol.
1. Obtaining a primary culture of human skin fibroblasts (Figure 2)
2. Storage, freezing, and unfreezing of primary culture
3. Cell cultivation
4. Transfection
5. Preparing for imaging
6. Setting the imaging parameters
The resulting GFP-EB3 movies produced using the protocol (Figure 1) illustrate the microtubules' dynamic properties. Microtubules are involved in different cell processes, and their dynamic properties impact various life characteristics of the primary human cell culture from patients' biopsy material (Figure 2).
The following parameters determine the dynamic instability of microtubules: the rates of growth (polymerization) and shrinking (depolymerization); the frequency of catastrophes (transition from polymerization to depolymerization); the frequency of rescues (transition from depolymerization to polymerization); as well as pauses – states when the microtubule does not polymerize and does not depolymerize 12. All parameters are tightly regulated, and the rates of polymerization and depolymerization of individual microtubules can vary significantly both in the same and different cell types13,14,15,16,17.
It is necessary to consider for the analysis that microtubules can have different dynamics depending on their position in the cell. Microtubules located in the region of the nucleus and centrosome behave differently compared to those on the cell periphery19. Therefore, to obtain a reliable result, we made the microtubules' dynamic measurements in three separate regions of the cell: the central part, the leading edge, and the tail part (Figure 3). To control the correct distribution of the GFP-EB3 label in various cell parts, we used human pulmonary artery endothelial cells (HPAEC) (see Supplementary Figure 1).
Specialized programs, such as ImageJ or Fiji (ImageJ 2 v1. 53i), allow the analysis of the videos by the following parameters: (1) the rate of the microtubules' growth; (2) the frequency of catastrophes; (3) the frequency of rescues; (4) the frequency of pauses; and (5) duration of pauses. In addition, unique program options and plugins allow tracing automatically18 or manually19 (Figure 4). The manual tracing method worked better in our experiments since automatic measurements are prone to larger errors and require more repetitions for a more accurate result. Detailed instructions on microtubules dynamics data analysis can be found in Supplementary Figure 2 and Supplementary File 1.
The imaging parameters may require adjustments during the imaging process. For example, the duration of one cell imaging and the exposure values can be changed. Such settings are helpful if there is a rapid signal burnout, or the cell shrinks (Figure 5).
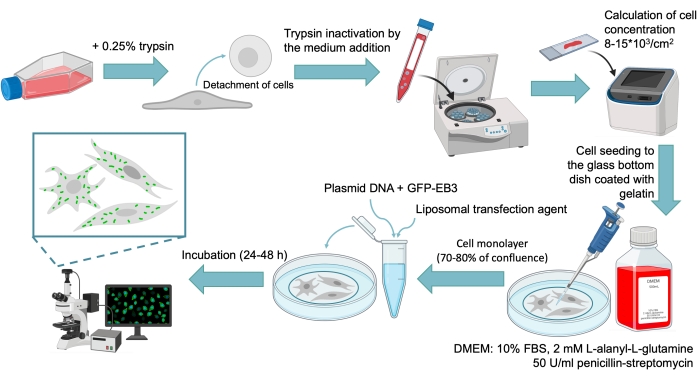
Figure 1: The general scheme of GFP-EB3 transfection protocol for human skin primary fibroblasts culture. The protocol includes the following steps: detachment of cells by the trypsin solution; trypsin inactivation by the medium addition; centrifugation of the resulting compound; calculation of cell concentration; cell seeding to the glass bottom dish (confocal dish) coated with gelatin; cell culture transfection by plasmid DNA (with GFP-EB3) with the liposomal transfection reagent; incubation 24-48 h; and analysis under a microscope. Please click here to view a larger version of this figure.
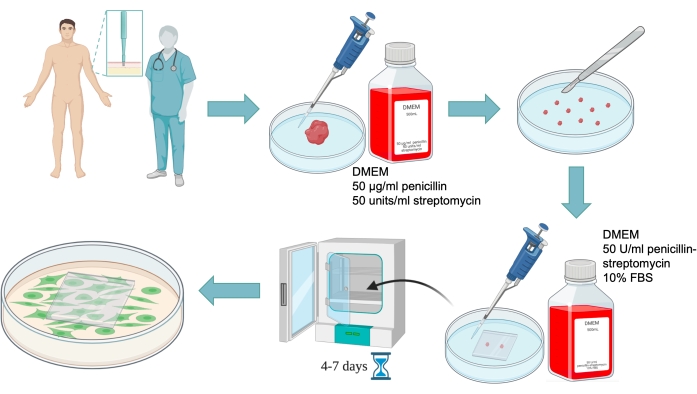
Figure 2: Human skin fibroblasts primary culture preparation scheme. A skin biopsy must be performed under sterile conditions by a physician after a patient signs an informed consent. Then a piece of tissue is transported in a small amount of the medium without FBS to the laboratory in a Petri dish. A large fragment of tissue is cut into pieces of 0.5-1 mm in size, and they are covered with a cover glass with the addition of the medium with FBS. Then the Petri dish is placed in a CO2 incubator, where after 4-7 days fibroblasts migrate from the tissue fragment to the glass bottom. Please click here to view a larger version of this figure.
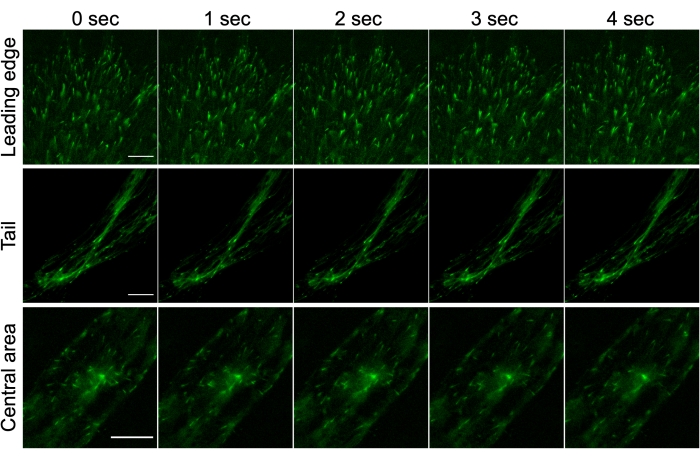
Figure 3: GFP-EB3 marker (green) in different areas of transfected human fibroblasts, obtained from HD patients' skin biopsy: leading edge (top panel); tail (middle panel); central part of fibroblast (zone around the centrosome) (bottom panel). Scale bar = 10 µm. The imaging frequency is 1 frame/s. Wide-field fluorescent microscopy. Please click here to view a larger version of this figure.
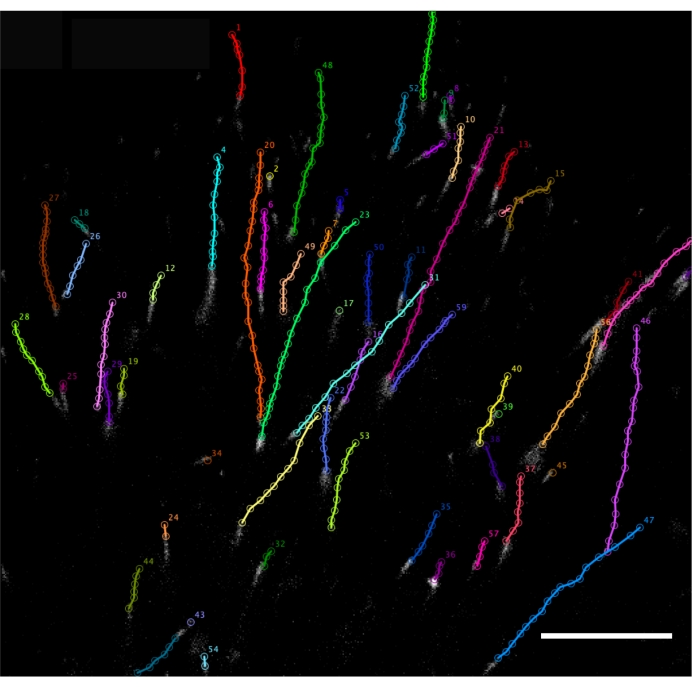
Figure 4: GFP-EB3 manual tracking by ImageJ plugin MTrackJ. Tracks reflecting the growth of microtubules were obtained as a result of frame-by-frame manual marking of the GFP-EB3 labels tips at the plus-ends during 20 s of imaging. Transfected cultured fibroblasts, obtained from HD patients' skin biopsy. The imaging frequency is 1 frame/s. Wide-field fluorescent microscopy. Scale bar = 10 µm. Please click here to view a larger version of this figure.
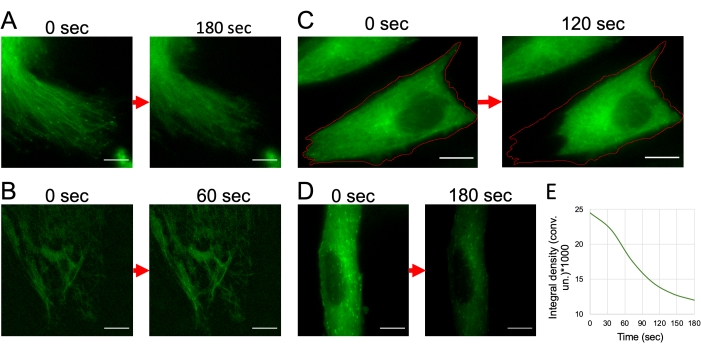
Figure 5: Troubleshooting during imaging of GFP-EB3 labeled microtubules' plus-ends. (A) Fluorescent-labeled microtubules are out of focus due to the absence of a focusing system. (B) Microtubules are stabilized and lose their dynamic properties due to overexpression of GFP-EB3 in the cell due to long incubation with the transfecting mixture. (C) Shrinking of the cell lamella as a result of phototoxicity due to the release of ROS. (D) Signal intensity drops during imaging – rapid photobleaching. Transfected cultured fibroblasts, obtained from HD patients' skin biopsy. The imaging frequency is 1 frame per second. Wide-field fluorescent microscopy. Scale bars = 10 µm. Please click here to view a larger version of this figure.
Supplementary Figure 1: Selective visualization of growing microtubule plus-ends. GFP-EB3 marker (green) in different areas of transfected human endothelial cell (culture of HPAEC: Human Pulmonary Artery Endothelial Cells) in leading edge, tail and central area (zone around the centrosome). Scale bars 10 µm. The imaging frequency is 1 frame/s Wide-field fluorescent microscopy. Please click here to download this File.
Supplementary Figure 2: Microtubule dynamics analysis by GFP-EB3 label after manual tracking using ImageJ plugin MTrackJ. (A,B) EB3 tracks obtained by EB3-GFP patches displacement on time-lapse series of transfected cultured fibroblasts, obtained from HD patients' skin biopsy (are colored individually). (A) EB3 track (purple, №46) obtained by EB3-GFP patches displacement during 18 seconds. (B) EB3 track (red, №37) obtained by EB3-GFP patches displacement during 9 seconds. (C) Quantification of plus-ends displacement of microtubules of human HD patients' skin fibroblast shown in (A). (D) Quantification of plus-ends displacement of microtubules shown in (B). The graph shows that between 6-8 seconds there is a pause in the growth of the microtubule (there is no movement of the plus-end). Please click here to download this File.
Supplementary File 1: Quantitative analysis of the dynamics of EB3-GFP labeled microtubules' plus-ends. Please click here to download this File.
Better quality results for microtubules’ dynamics analysis can be obtained from high-quality microscopic images. It is important to observe all the necessary conditions for time-lapse imaging of living cells and to correctly adjust the imaging parameters. Using special cell culture dishes with a glass bottom (confocal dishes) is important, since glass has a different refractive index of light than plastic. The thickness of the glass and its uniformity over its entire area is also extremely important, since these parameters are crucial for normal sample focusing. Violation of these parameters inevitably leads to a failure of the perfect focus system resulting in bad focusing thereby making it impossible to use such out-of-focus video for analysis (Figure 5A). Another important condition for live-cell imaging is their protection from ROS. Various reagents can be used for such purposes20. In our work, we use mineral oil, which completely isolates the culture medium from the atmosphere and prevents gas exchange. In the same way, the ROS-reducing oxyrase can be used, but this enzyme is not suitable for all cell types and is more often applicable to imaging with increased time.
When choosing the optimal incubation time of cells after transfection (24 or 48 h), attention should be given to the number of transfected cells. A number smaller than the maximal number of cells expressing the labeled protein is already sufficient for the analysis. Overexpression should not be allowed because microtubules, in such cases, are stabilized and their dynamic properties cannot be analyzed (Figure 5B).
In some cases, it may be necessary to adjust the imaging parameters in accordance with the reaction of cells after the start of video recording. For example, it is possible to observe cell lamella shrinking due to high sensitivity to light (phototoxicity) (Figure 5C). When excited, the fluorescent molecules typically react with molecular oxygen to form free radicals that can damage cell components21. When designing experiments, fluorophores with the maximum possible excitation wavelength should be selected to minimize cell damage under short-wave illumination. In addition, there are reports that certain components of standard culture media, including the riboflavin vitamin and the tryptophan amino acid, may also contribute to the adverse effects of light on cultured cells22. Among other things, this may be caused by an excessive amount of fluorescent labels in one cell. In these cases, it becomes necessary to reduce the duration of the recording and the intensity of illumination. Another possible problem may also be rapid photobleaching – decreasing of the signal intensity during recording (Figure 5D). This effect should be taken into account when selecting the next object on the same experimental dish, since the neighboring cells around the imaged area are also burned out.
It should be mentioned that there are other methods for microtubule visualization in living cells like microinjection of fluorescent-labeled tubulin into the cell or cell transduction using viruses. As with any other method, there are advantages and disadvantages to the transfection method. However, from our point of view, in comparison with the injection method, transfection is more effective and allows to achieve mass inclusion of expression vectors into the cells, resulting in a large number of fluorescent cells for analysis. Also, the transfection method does not require special equipment and skills from the researcher. The method of viral transduction shows good results and can be applied. Still, it is not suitable for all cell cultures (in particular, it is less suitable for human fibroblasts, obtained from HD patients’ skin biopsy).
The most critical step in this protocol is the transfection performed to ensure sufficient protein expression. A good signal-to-noise ratio, no photobleaching of microtubules, and the absence of cell drifting during time-lapse video recording are absolutely critical for effective microtubules imaging. In our experiment, visualization of microtubules and the dynamic analysis provide vital information on microtubule properties and behavior in the cells with mutant HTT. Our protocol is applicable for studies of other diseases for which pathology implicates dynamic properties of microtubules.
The authors have nothing to disclose.
This research was funded by the Ministry of Science and Higher Education of the Russian Federation, grant No. 075-15-2019-1669 (transfection of fibroblasts), by the Russian Science Foundation, grant No. 19-15-00425 (all other works on the cultivation of fibroblasts in vitro). It was partially supported by Lomonosov Moscow State University Development program PNR5.13 (imaging and analysis). The authors acknowledge the support of the Nikon Center of Excellence at A. N. Belozersky Institute of Physico-Chemical Biology. We want to offer our special thanks to Ekaterina Taran for her help assistance with voice acting. The authors also thank Pavel Belikov for his help with the video editing. Figures in the manuscript were created with BioRender.com.
Instrumentation | |||
Camera iXon DU897 EMCCD | Andor Technology | ||
Eppendorf Centrifuge 5804 R | Eppendorf Corporate | ||
Fluorescence filter set HYQ FITC | Nikon | Alternative: Leica, Olympus, Zeiss | |
LUNA-II Automated Cell Counte | Logos Biosystems | L40002 | |
Microscope incubator for lifetime filming | Okolab | Temperature controller H301-T-UNIT-BL-PLUS | |
Gas controller CO2-O2-UNIT-BL | |||
Objective lens CFI Plan Apo Lambda 60x Oil 1.4 (WD 0.13) | Nikon | Alternative: Leica, Olympus, Zeiss | |
Widefield fluorescence light microscope Eclipse Ti-E | Nikon | Alternative: Leica, Olympus, Zeiss | |
Software | |||
Fiji (Image J version 2.1.0/1.53c) | Open source image processing software | ||
NIS Elements | Nikon | Alternative: Leica, Olympus, Zeiss | |
Additional reagents | |||
Mineral oil (Light white oil) | MP | 151694 | |
Cell culture dish | |||
Cell Culture Dish | SPL Lifesciences | 20035 | |
Confocal Dish (glass thickness 170 µm) | SPL Lifesciences | 211350 | Alternative: MatTek |
Conical Centrifuge tube | SPL Lifesciences | 50015 | |
Cryogenic Vials | Corning-Costar | 430659 | |
Microcentrifuge Tube | Nest | 615001 | |
Cultivation | |||
Lipofectamine 3000 Transfection Reagent | Thermo Fisher Scientific | L3000001 | |
Dimethyl sulfoxide | PanEko | 135 | |
DMEM (Dulbecco's Modified Eagle Media) | PanEko | C420 | |
DPBS (Dulbecco's phosphate-salt solution) | PanEko | P060 | |
Fetal bovine serum (FBS) | Hyclone | K053/SH30071.03 | |
Gelatin (bovine skin) | PanEko | 070 | |
GlutaMAX | Thermo Fisher Scientific | 35050038 | |
Opti-MEM (1x) + Glutamax | Gibco | 519850026 | |
Penicillin-streptomycin | PanEko | A063 | |
Trypsin-EDTA (0.25%) | Thermo Fisher Scientific | 25200072 | |
Transfection | |||
Plasmid DNA with EB3-GFP | Kind gift of Dr. I. Kaverina [Vanderbilt University, Nashville] with permission from Dr. A. Akhmanova [Erasmus University, Rotterdam] |
Stepanova et al., 2003 DOI: 10.1523/JNEUROSCI.23-07-02655.2003 |