The use of nude mouse ear tissue was approved by Massachusetts General Hospital Institutional Animal Care and Use Committee (IACUC), while the use of human skin tissue was approved by the Massachusetts General Hospital Institutional Review Board (IRB). According to IACUC protocols, freshly euthanized mice were obtained from collaborators with nude mice colonies. Human tissue was procured from elective abdominoplasty procedures at Massachusetts General Hospital via an approved protocol. In addition, specific tissue types other than abdominal skin were acquired via a body donation authority, also through an IRB-approved protocol.
1. Preparation of tissue
- Preparation of nude mouse ear skin tissue
- After acquiring freshly harvested nude mouse bodies, remove the ears using forceps and microsurgical scissors. Place one ear in a small Petri dish (i.e., 35 mm x 10 mm). Place the nude mouse body in a biohazard bag to be disposed of in accordance with local IACUC protocols.
- Rinse each mouse ear with phosphate-buffered saline (PBS) and gently pat it dry with a task wiper. Repeat twice to remove any residual dirt or debris on the ear that may affect the imaging quality (see Figure 1).
- If the ear is to be used within 24 h, place it in a small Petri dish (i.e., 35 mm x 10 mm) with fresh PBS in a refrigerator (2-8 °C). If the ear will be used after 24 h of harvesting, place it in a Petri dish (35 mm x 10 mm) without PBS, cover the dish with parafilm, and place it in a -20 °C freezer.
- Preparation of human skin tissue
- After the procurement of human tissue, place it in a large Petri dish (i.e., 60 mm x 15 mm) in a biological hood to allow enough space for sample preparation.
- Place the stratum corneum side facing down such that the subcutaneous fat is accessible.
- Using forceps and microsurgical scissors, begin to carefully remove the subcutaneous fat. Once subcutaneous fat can no longer be removed with the scissors, switch to a 10-blade disposable scalpel (or equivalent) to remove the remaining subcutaneous fat. Use the scalpel at a 45° angle to the skin while holding the skin still with forceps (see Figure 1).
NOTE: To have high-quality transmission SRS images, the samples need to be as thin as possible without being punctured.
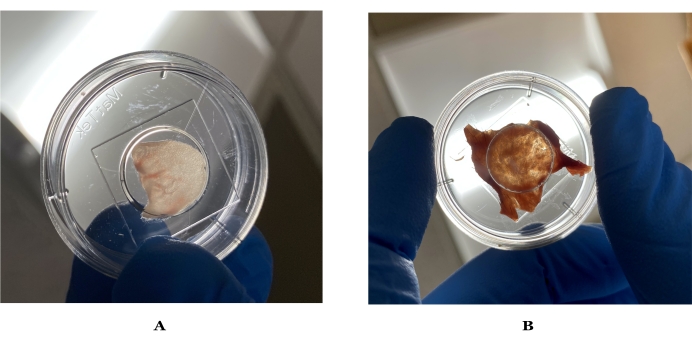
Figure 1: Images of ideal thickness for imaging mouse and human skin. (A) Mouse ear skin held up to light, which can visibly let light through. (B) Ideal human skin held up to light after preparation. Please click here to view a larger version of this figure.
- Section the human skin into 1 cm x 1 cm pieces.
NOTE: Fresh skin, may be used for up to 24 h without the use of an agarose gel bed, as described previously31. However, fresh skin may be utilized for longer if kept on an agarose gel bed. If the skin is to be used later, the skin is placed in a specimen transport bag and then placed in a -20 °C freezer. Frozen skin needs to be thawed using the procedure below for optimal results (see step 3.1.2).
2. Laser and microscope setup
- Approximately 30 min prior to imaging, switch on the widely tunable ultrafast laser (hereafter referred to as the laser) and allow it to warm up. Enable the Laser Warning sign/lock system to notify personnel outside of potential hazard upon entry.
NOTE: Proper eyewear must always be worn when working with Class IV lasers. For the specific laser used here, the recommended proper eyewear is OD ≥ 6 for the working range of the laser 800-1,300 nm. - While the laser is warming up, enable the remaining hardware for microscope control, CARS detection, and SRS detection.
- Align the microscope properly to ensure optimal imaging. In the Image Acquisition Control window in the microscope control software (hereafter MC software), click on transmission lamp to allow light to come from the transillumination lamp of the microscope.
- Ensure correct Köhler illumination to align the microscope along the vertical axis: close the iris down so a minimum amount of light is seen through the eye piece32.
- While looking through the eyepiece, open the iris to see if the polygon touches all sides simultaneously. Adjust the condenser height if a polygon shape cannot be seen before opening the iris.
- If the polygon shape does not touch all sides at the same time, adjust the aperture alignment position by using the adjustment knobs.
NOTE: See Sanderson et al.33 for an in-depth microscope setup. - Place a microscope slide with a coverslip and double-sided adhesive spacer containing an oil sample (e.g., olive oil, as there are many -CH2– bonds within oils) on the microscope stage holder.
- In the Acquisition settings window of the MC Software, find the microscope dropdown menu and set the microscope objective 到 20x.
- Verify that the CARS detection filter (645 nm/50 nm) is in position to visualize and measure the epiCARS signal along the microscope side port photomultiplier tube.
NOTE: This specific filter is selected for imaging lipids as the anti-Stokes CARS signal generated at 652 nm for a pump wavelength of 803 nm and a Stokes wavelength of 1,040 nm (see Eq. (1)).
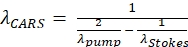 (1)
(1)
Where the λ variables have units of nm; λpump is the pump beam wavelength; and λStokes is the Stokes beam wavelength. - Look through the eyepiece to find the edge of the oil sample, which will be used to verify the alignment of the system.
- Ensure that the edge is in Z focus using the focus knobs on the microscope and adjust the stage controller to obtain XY focus.
- After the laser has warmed up,set the pump beam to 803 nm with the motor fine tune set to 50.0 in the laser's graphical user interface. The exact motor fine tune used may differ from setup to setup.
NOTE: The pump beam is the only beam with an adjustable wavelength on this laser as the Stokes beam wavelength is fixed at 1,040 nm.This configuration targets the CH vibration at 2850 cm-1 (see Eq. (2) to calculate the pump wavelength for wavenumber targeting).
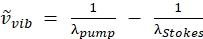 (2)
(2)
Where has units of relative wavenumber (cm−1), and λ variables have units in cm.
 - Check the alignment of the laser into the microscope prior to imaging; see Figure 2 for the depiction of the laser path. During the initial setup of the microscope, install two irises in the beam path as guides for correct alignment into the microscope. As the optical path of the laser can drift over time, ensure that the laser beam paths traverse the center of the irises so that they correctly enter the microscope.
- Using the IR viewer, close all the irises completely and ensure the beam is centered on both: first on the iris nearest the laser and finally at the microscope entry port.
- First, check the pump beam to ensure that the beam is going into the microscope straight. Once the pump is aligned, check to ensure that the Stokes beam also goes into the microscope correctly.
- If the beams are not aligned through the irises, iteratively walk the beams through the irises using the x and y adjustment knobs of the two mirror mounts for the pump and Stokes beampaths.
- Once the beam spots are overlapping prior to entering the microscope, check to ensure that they are traversing the microscope correctly.
- In the Image Acquisition Control window of the MC software, click the TD channel for transmission, ALG1 (analog channel 1) for the coherent anti-Stokes Raman channel, and ALG2 (analog channel 2) for the stimulated Raman scattering channel. Use the following settings (as in this protocol): gain of 1 and an offset of -1 for ALG1, gain of 1.25 and offset of -2 for ALG2.
NOTE: Depending on system configuration, analog channels may have different numbering for individual imaging channels. If the SRS detector is in place, there will be no transmission signal as no light can get through (i.e., one cannot visualize images with TD and ALG2 simultaneously in this setup).
- In the Image Acquisition Control window of the MC software, click the TD channel for transmission, ALG1 (analog channel 1) for the coherent anti-Stokes Raman channel, and ALG2 (analog channel 2) for the stimulated Raman scattering channel. Use the following settings (as in this protocol): gain of 1 and an offset of -1 for ALG1, gain of 1.25 and offset of -2 for ALG2.
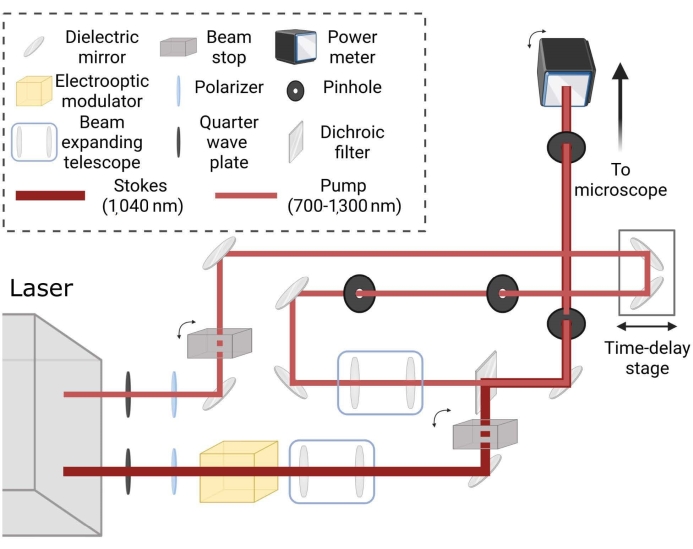
Figure 2: Schematic layout for coherent Raman laser imaging path. Beams are independently conditioned for spot size and matched via time delay stage to generate coherent Raman scattering in samples for the desired tuning frequency. Please click here to view a larger version of this figure.
- Turn on the power meter and, using a high-power thermal power sensor, measure the power of the pump and Stokes beams individually for the experiment.
NOTE: In this specific example, the pump beam power was 80 mW, while the Stokes beam power was 180 mW prior to the entrance to the microscope. - In the Image Acquisition Control window, click on the Focus x2 button to view the image in the MC Software.
- In the Acquisition settings window, ensure that the pixel ratio and the dwell time are set to the desired parameters for the experiment.
NOTE: A 1,024 x 1,024 pixel ratio and a dwell time of 2 µs/pixel were utilized in this protocol. - Confirm the laser alignment with respect to the microscope by unblocking the pump beam and looking at the TD channel.
NOTE: The laser is aligned properly if the beam is seen centered in the image with the correct detector settings. - Otherwise, use X and Y adjustment knobs on the periscope to reposition the beam to the center of the image.
- Confirm laser and microscope alignment by seeing the same image in both the CARS and SRS channels.
- To acquire the alignment image, click the XY scan button in the Image Acquisition Control window with the appropriate Filter Mode set (e.g., Kalman Line 3).
- Save this set of images with a descriptive filename to compare over time and confirm system performance/alignment.
3. Lipid imaging
- Mouse ear and human tissue
- If using fresh tissue, skip step 3.1.2.
- Remove mouse ear skin from the -20 °C freezer and place it in an incubation chamber (32 °C) for 10 min. Remove the mouse ear from the incubation chamber.
NOTE: See step 1.1.2. for mouse ear skin preparation. Rough handling or scraping of the tissue can result in mechanical degradation, destruction, or disruption of the tissue, especially the stratum corneum. - If using a nude mouse ear, place the anterior portion of the ear facing toward the glass bottom of a 35 mm, No. 0 dish. If using human skin, place it with the stratum corneum face down as this will allow drug quantification from the superficial layers to the deeper layers (Figure 1).
NOTE: The posterior portion of the nude mouse ear is more prone to imperfections from housing. If human skin is not placed with stratum corneum side facing downward on the inverted microscope, one will not be able to see past the dermis as there is a fair amount of light scattered, and the drug permeating into the stratum corneum cannot be seen. - Once the tissue has been centered on the glass bottom, use a cotton-tipped applicator to ensure that the skin is flat and has complete contact with the coverslip surface of the glass-bottom dish.
NOTE: This is a step that can cause difficulty while imaging the skin if it is not completely flat. - Place a washer on top of the skin to prevent any movement while imaging. Ensure that the tissue is visible through the center hole of the washer for SRS transmission detection.
- Remove the slide stage insert and replace it with the incubation chamber, which has the single dish insert.
- Place the glass-bottom dish with the skin tissue in the single dish attachment of the incubation chamber.
NOTE: Alternatively, use a 6-well plate to image multiple skin samples and formulations at once. - Decrease the pixel ratio in the Acquisition Settings window of the MC software (e.g., from 1,024 x 1,024 to 512 x 512) for faster galvo scanning speed while the Z-depth is changed to find the stratum corneum (see Figure 3A for mouse or Figure 3E for human).
- After the stratum corneum has been found, register that axial position to be the zero position in the Acquisition Settings window and change the pixel ratio for each specific experiment (e.g., 1,024 x 1,024).
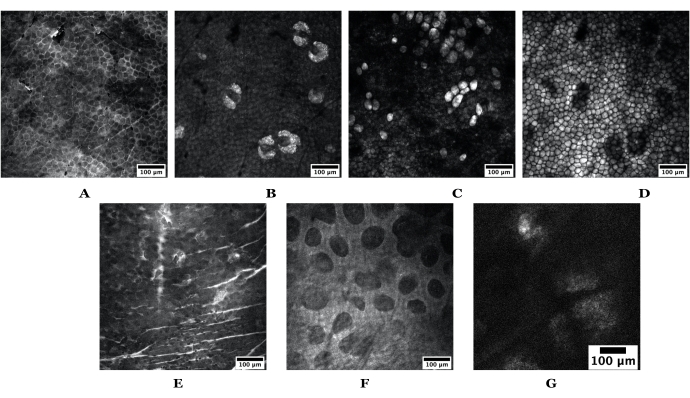
Figure 3: Example skin depths obtained using SRS. The top set of images are from nude mouse ear skin depicting the following: (A) stratum corneum, (B) sebaceous glands, (C) adipocytes, (D) subcutaneous fat. The bottom set of images are obtained from human skin depicting the following: (E) stratum corneum, (F) papillary dermis, and (G) a sebaceous gland. Scale bars = 100 µm. Both mouse and human skin images were acquired using a 20x objective at 1024 pixels x 1024 pixels; the human SG was taken at 512 x 512 pixels. Abbreviations: SRS = stimulated Raman scattering; SG = sebaceous gland. Please click here to view a larger version of this figure.
4. Application of topical formulation
- Pipette the predetermined formulation dose onto the skin (e.g., 10 µL/cm2).
NOTE: The formulation's viscosity will play a role in the pipette choice. The use of a positive displacement pipette for viscous formulations, such as creams or gels, and an air displacement pipette for solutions is recommended. In this experiment, ruxolitinib was the model compound in a simple solution of propylene glycol (propane-1,2-diol). - Using the plunger tip from a syringe, or a gloved finger, rub the formulation in a clockwise motion for 30 s. Note the time when the formulation is applied for later cPK analysis (see steps 6.15-6.17 below).
NOTE: The duration of application is dependent on the experiment; each one may be different. - After the allotted time for the formulation to permeate has elapsed, remove the excess formulation and place the skin with the formulation side facing toward the glass-bottom dish.
NOTE: The formulation is removed using a delicate task wiper or a small (~1 inch) 3-D printed squeegee in a single direction (e.g., from north to south).
5. Experimental setup for drug quantification
- Set the pump beam to 803 nm. Check the pump and Stokes beam powers with the photodiode to ensure they are the desired powers for the experiment. Unblock each beam individually to measure the power and reblock the beams.
NOTE: In this specific example, the pump beam power was 100 mW, while the Stokes beam power was 180 mW. - Place the glass-bottom dish in an incubation chamber with an insert for one glass-bottom dish. Secure the dish with clips to prevent movement during imaging.
- Turn on the transmission lamp in the MC Software. Looking through the eyepiece, adjust the axial focus with the adjustment knob to ensure that the tissue is within focus.
- Unblock both the pump and Stokes beams. Ensure that ALG1 and ALG2 channels are enabled and then click Focus x2 on the MC software to visualize the skin in the CARS and SRS channels. Ensure the SRS photodiode is in position above the condenser.
- In the Device dropdown menu, click Multi Area Time Lapse (MATL). Look for an XY Stage Warning to appear; when the stage moves to find its mechanical origin, click OK.
- In the MATL module, go to View and then click Registered Point List within the MC software. Begin to add either 1) specific depths within the skin (i.e., stratum corneum, SGs, adipocytes, subcutaneous fat as determined during live imaging with lipid-tuned contrast) or 2) XY positions if entire depth stacks are to be taken. See Figure 3 for examples.
- Once the stratum corneum is identified, scroll through the axial focus (or z-focus) to identify specific tissue stratifications mentioned above. See Figure 3 for examples within human and mouse skin.
- In the case of imaging specific depths as opposed to full Z-depth stacks, for each skin stratification, click Register Point to add it to the MATL queue. For full-depth stacks, click Register Point for each XY position with depth selection in the acquisition parameters window.
- Once all the desired XY (full Z-depth stacks) or XYZ (specific skin stratifications) positions have been registered within the MATL software, change the file directory and name in a manner that will be consistent throughout the experiments for image and cPK analyses (see steps 6.15- 6.17).
- Set the number of repeats to 1 in the MATL module and click Ready. Wait for Play to change from a gray to a black arrow, indicating that the software is ready. Press Play to begin imaging the preliminary lipid stack (hereafter Lipid Images).
NOTE: This will be used to separate lipid-rich and lipid-poor regions of individual tissue stratifications during analysis. The cycle and total time are indicated in the bottom right of the registered point list. - Once the cycle has completed, block both the pump and Stokes beams. Change the wavelength on the laser graphical user interface to the desired wavelength based upon the targeted wavenumber or Raman vibration.
NOTE: For example, 843 nm for the pump beam is used to target 2,250 cm-1 using Eq. (2), and the motor fine tune is changed to 50.1. The example drug presented here, ruxolitinib, contains a nitrile that can be targeted at 2,250 cm-1. The wavenumber targeted for skin structure will always be the same (2,850 cm-1); however, the wavenumber for an API can be any wavenumber but must be known or calculated a priori. - Adjust the manual time delay stage (Figure 2) to ensure overlap in time for the new wavelength and the pump beam power. Ensure the same powers are used for both lipid and API imaging, which are established a priori.
- Use the duration per cycle to calculate the total number of repeats required per experiment. Simply divide the total desired time-course of the experiment by that of the cycle duration.
NOTE: The cycle duration is a function of image size, pixel dwell time, Kalman averaging, and the number of images per cycle. Optimization of these parameters will shorten the cycle time, thus increasing temporal resolution. - Once the total number of cycle repeats has been chosen, unblock the pump beam, check the power using the photodiode, and ensure that it matches that of the desired power. Finally, unblock the Stokes beam to allow for imaging.
- Press Play to begin automated imaging of the set-points.
- After the MATL imaging has been completed, switch the pump beam back to 803 nm and adjust the power back to the original lipid-imaging power used in step 5.1.
- As in previous steps, change the filename to be consistent for post experiment images throughout the study.
- Set the number of repeats to 1.
- Click Ready | Play button to acquire a post time-course lipid stack and ensure that there has been no tissue movement during imaging (Figure 4).
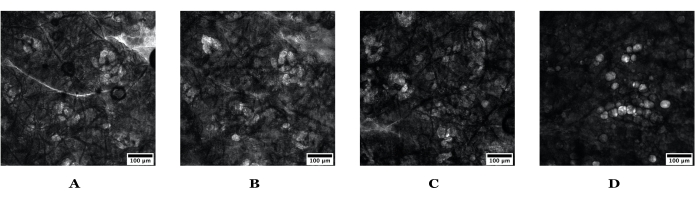
Figure 4: Tissue movement in nude mouse ear skin demonstrated by visualizing sebaceous glands. Example of limited tissue movement is depicted in A and B, while substantial tissue movement is depicted in C and D. (A) shows the sebaceous glands at the time of formulation application and (B) the same depth at 120 min after application. (C) Mouse sebaceous glands at the time of formulation application and (D) 120 min after formulation application; the sebaceous glands are barely visible, which is an indication that this experiment was not measuring the uptake into the sebaceous glands for the entire experimental duration. Scale bars = 100 µm. Images are 1024 pixels x 1024 pixels. Please click here to view a larger version of this figure.
6. Data analysis
- Acquire images as .OIB (or .OIR depending on the microscope and MC software) file types with each XYZ position having a separate subfolder.
- Compile lipid images with API channel images by renaming lipid images with the following ending _lipid.oib.
- Perform the following steps with each skin stratification (demonstrated here using only the SG stratification for simplicity's sake; see Figure 3B).
- Import an SG lipid image into ImageJ (or Fiji)34 and check the box labeled Split Channels to split the file into the CARS and SRS channels.
NOTE: Fiji will split the file into the number of images acquired during the experiment across the number of channels. - Open the region of interest (ROI) manager by clicking Analyze | Tools | ROI Manager.
- Using the SRS channel (e.g., C = 1), demarcate an SG in the image.
NOTE: SGs are the bright locations due to targeted -CH2– vibration. - Add this to the ROI manager by clicking Add [t] in the ROI manager or pressing t on the keyboard. Repeat this process for each SG within the image.
- To mask out lipid-rich regions, select each ROI and click the More tab | OR (Combine) | Add to ROI manager.
- To mask out lipid-poor regions, use the rectangle tool in the FIJI menu and draw a square around the entire image. Add this to the ROI manager.
- Click on the newly added square ROI in addition to the ROI that selects all lipid-rich regions in the ROI manager. Under More, select XOR to generate a mask of the lipid-poor regions and add it to the ROI manager.
- Import an SG lipid image into ImageJ (or Fiji)34 and check the box labeled Split Channels to split the file into the CARS and SRS channels.
- Load the API images into Fiji.
- Concatenate the images in numerical order (i.e., Image0001, Image0002, Image0003, etc.) by using the following menu sequence: Image | Stacks | Tools | Concatenate.
- Alternatively, import these images by loading one of the images into Fiji and then selecting an option called Group files with similar names on the setup page.
NOTE: This provides the ability to import all images with a similar filename and concatenate them automatically.
- Alternatively, import these images by loading one of the images into Fiji and then selecting an option called Group files with similar names on the setup page.
- While having the concatenated image active, go to the ROI manager, select the lipid-rich regions (i.e., the SG), click More, and select Multi-measure. Wait for the Results window to appear.
- Look for Area, Mean, Min, Max, and Median in the default measurement settings. If other metrics are desired for analysis, enable these options by checking the relevant checkbox in the Set Measurements window (Analyze | Set Measurements…).
- Export the data from the Results window to a spreadsheet and add a column titled Region.
- Add lipid-rich to each row of data for the lipid-rich regions. Add lipid-poor to regions that were outside the lipids.
- Add a column titled layer and add the respective layer that was analyzed (Supplemental Table S1).
- Repeat steps 6.5 – 6.7 for the lipid-poor regions while the appropriate ROI is selected.
- To visualize the data, save the spreadsheet and import it into either JupyterLab (package matplotlib)35 or in R (package ggplot2)36. Plot the data as a function of the image number vs. mean intensity to estimate the concentration-time data. (Figure 5).
- Import the spreadsheet into RStudio to perform noncompartmental analysis (NCA) for the pharmacokinetic analysis of the CRI data.
- Add a column titled time.
- For Image0001, calculate the duration between the formulation application and the first image.
NOTE: This is the first timepoint. The cycle duration is used to calculate the remaining images (and thus time points) that increase over time. For example, if the time since application is 30 min, Image0001 will have a time point of 30 min and with a cycle duration of 8 min, Image0002 will have a time point of 38 min, Image0003 will have a timepoint of 46 min and so on. - Run NCA in RStudio (using the NonCompart package)37 on the intensity-time data imported from the spreadsheet, with the following call for one layer/region:
sNCA(x = time, y = mean, dose = 1, timeUnit = "s", doseUnit ="mg")
Where x refers to time points, y refers to intensity, and dose can be left as one, calculated as the mM dose of the drug in the formulation or the product dose.
NOTE: The NCA output will provide parameters such as Cmax and AUCall. However, as this is ex vivo skin, these parameters are, in fact, Jmax and AUCflux-all. - Compare Jmax and AUCflux-all metrics visually by plotting them (Figure 6) in addition to statistical comparisons across experimental conditions. See Figure 6 for an example of the analysis of ex vivo CRI studies.
NOTE: The appropriate statistical test(s) are contingent on each specific dataset. It is also important to note that all pharmacokinetic parameters are log-normally distributed, and any comparisons must use the log-transformed (natural log or log10) data.
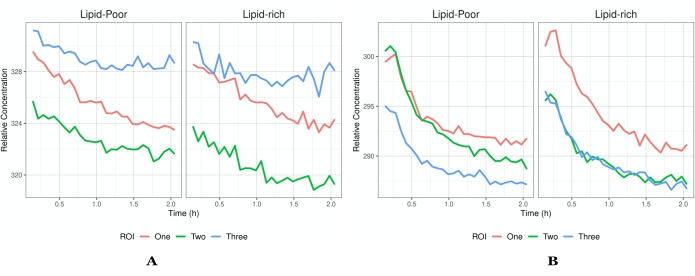
Figure 5: Intensity vs. time profiles. (A) An example of flux profiles that have reached saturation and thus only a decrease in intensity is seen. Each ROI has a different flux profile to demonstrate the heterogeneity in the data that one might acquire. (B) An example of concentrations that increase after imaging has begun. Each ROI is a different field of view (indicated by the different color traces) within the same tissue of the same experiment. In addition to global concentrations, there is the ability to elucidate which local environment an API/formulation prefers as indicated by lipid-rich and lipid-poor regions. The profiles presented in A indicate that there is no absorption of drug into the tissue as the API has already permeated and begun to leave the tissue once imaging has started. However, in B, the tissue has not reached saturation, and there is still absorption of the API followed by elimination. The segmentation of images into lipid-rich and lipid-poor will aid in the elucidation of the localization of the API (or inactives) and the permeation pathways into the skin (i.e., stratum corneum). A higher concentration within the lipid-rich regions indicates that the API localizes within the lipid structure of the layer under investigation, which aids in targeted drug delivery information. Abbreviations: ROI = region of interest; API = active pharmaceutical ingredient. Please click here to view a larger version of this figure.
Imaging is considered successful if the tissue has not significantly moved in either axial (<10 μm) or lateral direction upon the completion of the experiment (Figure 4). This is an immediate indication if the SRS measurement for the API of interest is not representative of the initial depth, for which quantification is layer-specific. This is mitigated by imaging z-stacks for each XY position of interest, with the trade-off being the temporal resolution. If frozen skin is used in these studies, the penetration and permeation of the API are rapid compared to fresh skin, and minimal time between formulation application and the start of imaging is imperative. Another consideration is the objective used for the experiments. If using a 60x objective, selecting a flat surface within a single field of view (FOV) is relatively easy; however, for a 20x objective, the viewed field is much larger, and thus, a key step in the tissue preparation is ensuring uniform contact of the skin with the glass-bottom imaging dish. A flat FOV and similar depth compared to the original depth within the FOV are two keys to positive results.
The alignment of the laser, in addition to the dynamic range of the image, must be addressed with the utmost care. Misalignment of the laser pulse trains into the microscope can lead to a host of problems, including low signal levels or unevenly excited FOVs, which may give rise to low-contrast images. Another consideration is to ensure that the entire dynamic range of intensity values are utilized when acquiring images; otherwise, the imaging data are compressed, and concentration differences may be difficult to detect.
Another consideration is that skin heterogeneity may give rise to variation in the computed microscale flux profiles within the same dataset. The intensities (a proxy for concentrations) begin high and decrease over the experimental duration (Figure 5A), while other studies indicate an increase followed by a decrease in flux over the experimental duration (Figure 5B). At present, absolute concentration quantification cannot occur instantly due to the experimental setup. Thus, concentrations that decrease after application are possibly the result of a saturation within the depth of interest, and the quantification only represents the API elimination. If the dynamic range is not large enough or the skin is too thick, visual inspection will render the concentrations to appear stagnant so that no change occurs over the imaging duration. This is a function of both a suboptimal dynamic range and skin thickness, which will suggest a need to repeat the experiment.
The concentration-time profiles are then subjected to NCA of each profile to estimate the exposure, maximum flux, and time to maximum flux. Statistical analysis (Figure 6) is conducted across experimental conditions to further investigate covariates contributing to potential differences in exposures. Comparisons of the global cPK parameters will provide insight into which formulation provides a higher flux or greater exposure. In contrast, the microscale cPK parameters (i.e., the lipid-rich and lipid-poor regions) will provide insight into the local biodistribution and permeation pathways. For example, when comparing two formulations with the same API concentration and differing in the inactive ingredients, one formulation may tend to permeate through the stratum corneum via the lipid-rich region versus that of the lipid-poor region. This observation indicates that this specific formulation will "push" the permeation toward the lipid-rich regions for easier penetration and permeation.
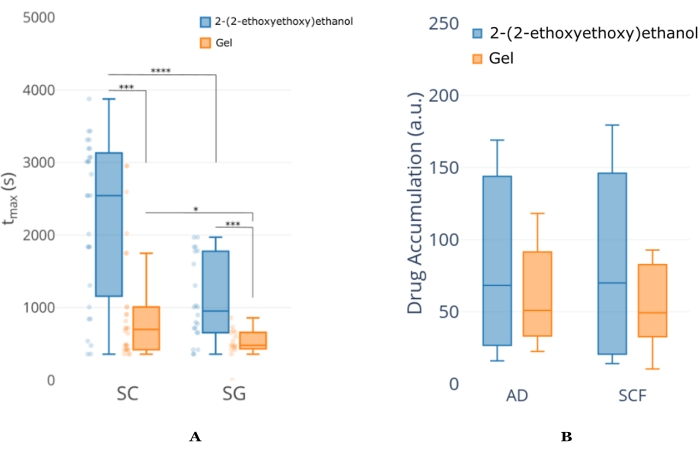
Figure 6: Example NCA analysis of concentration-time profile from mouse ear tissue. (A) An example of tmax (time at which maximum concentration occurs) analysis between two formulations for the same API. This analysis indicates that the 2-(2-ethoxyethoxy)ethanol provides extended API permeation compared to that of the Gel formulation, regardless of the skin layer. It can also be seen that the tmax for the SC layer is longer than the SG, suggesting that the 2-(2-ethoxyethoxy)ethanol formulation is continuing to deliver API even when the imaging duration has concluded. (B) An example of total exposure analysis between the same formulation/API combination in A but at depths further into the skin. This figure is modified from18. Abbreviations: SC = stratum corneum; SG = sebaceous gland; AD = adipocyte; SCF = subcutaneous fat. Please click here to view a larger version of this figure.
Supplemental Table S1: Example dataset acquired from manual image analysis. The columns indicate the information acquired from the Data Analysis section of this manuscript (i.e., frame, area, mean, min, max, median), while additional columns have been added for use in a cPK analysis (i.e., layer, region, time_minutes). These data can be analyzed via NCA and plotted to visualize the concentration profile within the SG skin layer. Please click here to download this Table.
