Protein concentration
An overview of the two labeling workflows is shown in Figure 1. Since the cells are still intact when labeled according to the cell-surface protein labeling protocol, only the cell surface proteins are exposed to the dye. In the standard Ettan DIGE protocol, the cells are lysed before labeling and proteins inside as well as outside the cell are labeled (Fig 1). The relative amount of dye to protein in the cell-surface protein labeling protocol is not known, since cell-surface proteins cannot be specifically quantitated. However, it is known that cell surface proteins constitute a very low proportion of the cellular proteins 2. Approximately 5–10 x106 cells to 600 pmol of dye were used. It may be possible to use fewer cells since only 12.5–25% of the nonfractionated sample in this study was used for 2-D electrophoresis.
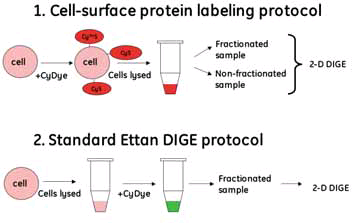
Fig 1. Overview of labeling workflow protocols
Protein concentrations in the different fractions were determined using the 2-D Quant Kit. The total protein amount derived from 10 x106 CHO-K1 cells was 920 μg in the non-fractionated sample, 225 μg in the membrane/hydrophobic fraction and 770 μg in the cytosolic/hydrophilic fraction. These amounts will most likely vary depending on cell type and cell size. The proportion of proteins that are labeled in the cell-surface protocol may be higher than the standard Ettan DIGE minimal labeling, which is 2-3% of total protein. It seems that only one dye molecule is attached per protein molecule, since the spot shape is round and vertical streaking of the low molecular proteins on the gels is absent (Fig 2 and 3). Two and more dye molecules per protein would cause vertical streaking due to increased molecular weight of the labeled protein. This phenomenon would mostly be seen with the low molecular weight proteins, since a change in molecular weight of these proteins would result in a larger shift on the gel compared to high molecular weight proteins.
Cell-surface protein specific labeling
Two identical samples of cells were surface labeled with CyDye DIGE Fluor Cy3. One was lysed and used directly for 2-D electrophoresis. The other sample was lysed and fractionated into membrane and cytosolic fractions. The entire fluorescent label appeared in the membrane fraction; the cytosolic fraction was devoid of any labeled proteins (Fig 2). The same gel with the cytosolic protein sample was silver stained and the result showed that there were proteins in the gel, but they were not labeled using the cell-surface protein labeling protocol. These results suggest that this new labeling protocol is specific for cell surface proteins. The CyDye DIGE Fluor minimal dye does not appear to enter the cell or pass through the cell membrane. The cells are kept on ice prior to the labeling and this may reduce any transport across the membrane. The time for CyDye DIGE Fluor minimal dye exposure is also relatively short (20 minutes), which is sufficient for protein labeling but not for entry into the cell. Another possible explanation for the lack of labeling inside the cell is that even if the dye passes across the membrane, the pH inside the cell is too low (< pH 7.4) for an efficient labeling reaction to occur (optimal pH 8.5). The labeling reaction is quenched followed by washing of the cells, which further prevents any protein labeling after the cells have been lysed. This method has been successfully applied to human cell lines in vitro as well as to a complex biological system in vivo 7.
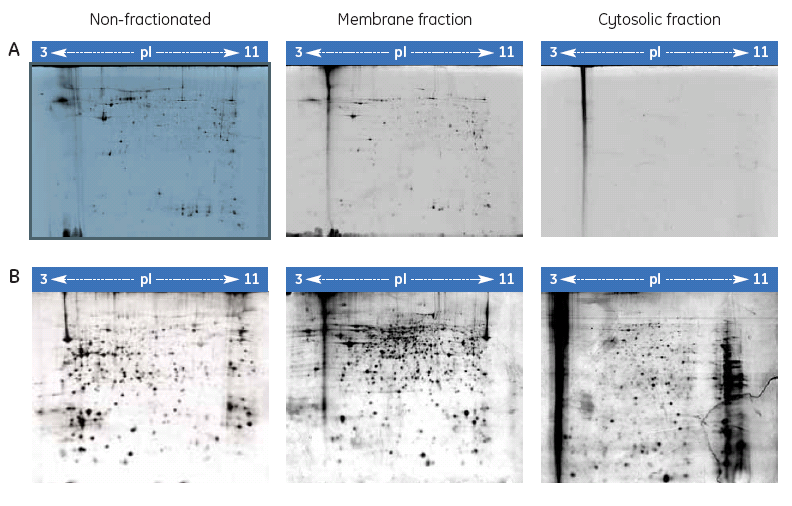
Fig 2. Specificity of cell-surface protein labeling.
The cellsurface proteins of CHO-K1 cells were labeled with Cy3 and fractionated. The different fractions were separated by 2-D electrophoresis and scanned for Cy3 fluorescence (A). The same gels were then silver stained (B).
Fractionation
There are only minor differences in the spot pattern for the membrane-fractionated sample compared with the nonfractionated sample (Fig 2). The two spot maps were compared using DeCyder 2-D Differential Analysis Software and all the spots detected in the membrane fraction were also present in the non-fractionated sample. Fractionation, therefore, is not necessary to improve detection of cell surface proteins but can be used to verify lack of labeling of proteins inside the cells.
Comparison between protocols
To be able to evaluate the advantages with the new cell surface protein labeling protocol, a comparison with the standard Ettan DIGE protocol was performed. Two identical samples from CHO-K1 cells grown in the same flask were labeled in parallel with the two different protocols, respectively (Fig 1). A cell-surface Cy5 labeled sample was run on the same gel as a Cy3 labeled cell lysate. The green spots (Cy3) on the gel (Fig 3A) represent the proteins labeled using the standard Ettan DIGE procedure followed by membrane fractionation. These spots are presumably membrane proteins including cell surface proteins as well as proteins from membranes inside the cell (ER, Golgi, mitochondrion, and nucleus). Standard Ettan DIGE labeling procedure followed by a membrane fractionation step was chosen for comparison, since it should give the highest probability for detecting the low abundant cell surface proteins. The red spots (Cy 5) on the gel (Fig 3A) are cell surface specific proteins labeled using the new cell surface protein labeling protocol that are not visible with the standard labeling procedure (green spots). Furthermore, the yellow spots represent overlapping proteins that occur in both samples using either procedure (Fig 3A). Another useful application would be to combine both labeling protocols to distinguish proteins on the cell surface from those on intracellular membranes. Moreover, information about relative changes in cell surface/membrane protein levels after various stimuli could be followed by using both labeling techniques simultaneously.
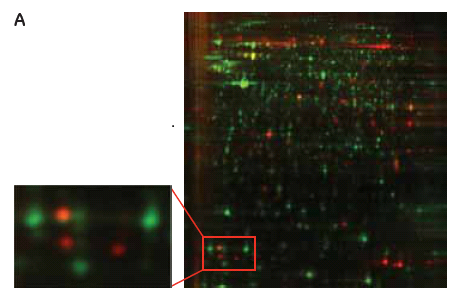
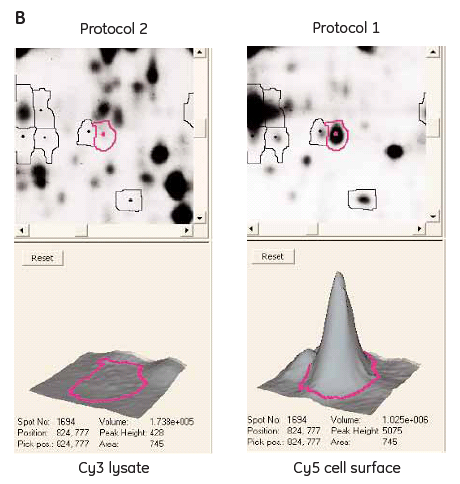
Fig 3.
(A) 2-D gel images of a CHO-K1 Cy5 cell-surface labeled sample (red spots, see protocol 1, Fig 1) and a membrane fractionated Cy3 sample (green spots, see protocol 2, Fig 1) labeled according to standard Ettan DIGE protocol run in the same 2-D gel. (B) DeCyder 2-D Differential Analysis Software views from the 2-D gel showing a cell-surface labeled protein not visible using the standard Ettan DIGE protocol.
Identification of cell surface proteins
Since the spot pattern is very different between a cell surface labeled sample and a total protein labeled sample, it was necessary to include a cell surface labeled spike to enable matching and identification of the cell surface spots in the preparative spot map. All cell surface proteins were picked. Cell surface proteins can be difficult to identify due to their low abundance. The actual protein amount in some spots may be insufficient for identification, since the cell surface proteins are visually enriched and not physically enriched using this protocol. To facilitate successful identification of low abundant cell surface proteins, the preparative amounts of total protein can be enriched for membrane proteins before application on 2-D electrophoresis. In these CHO cells, intracellular membrane proteins and cell surface proteins constitute approximately 20% of the total protein in the cells. For this cell type, the protein amount in the spots could potentially be increased by a factor 5 by enrichment of membrane proteins. Also, the use of narrow gradient pH intervals of the IPG strips will allow application of larger amounts of protein. In this study we used only 600 μg total protein, with no enrichment for membrane proteins, and a broad range IPG strip. We were still able to identify a large number of cell surface proteins, of which 82% were previously known as membrane associated proteins.
Multiplexing
To test the cell surface protein labeling protocol in an Ettan DIGE experiment using all three dyes 6, a series of samples from serum depleted CHO cells were collected and cell surface proteins labeled at different time points (Table 1). Samples were separated by 2-D electrophoresis. The preparation of an internal standard for a cell surface DIGE experiment is straightforward. In this case, Cy 2 cell surface labeled samples (from all time points) were pooled and used as an internal standard applied to each 2-D gel. All three CyDye DIGE Fluor minimal dyes labeled cell surface proteins similarly (data not shown). Changes in expression during serum starvation for many of cell surface proteins were detected using DeCyder 2-D software (Fig 4).
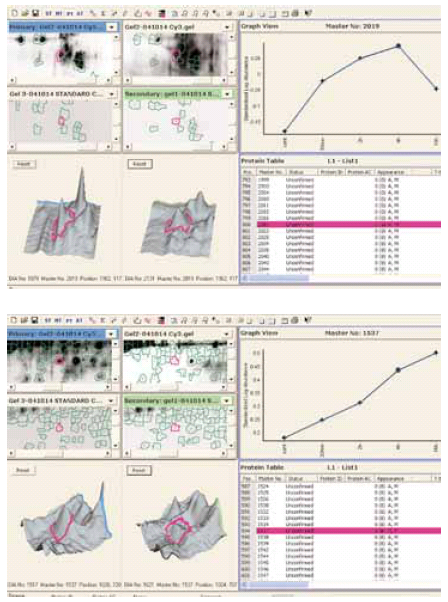
Fig 4.
Change in expression of two cell-surface proteins during starvation of CHO-K1 cells. Spot maps were analyzed using DeCyder 2-D Differential Analysis software.
Conclusions
The new Ettan DIGE protocol for cell surface protein labeling is rapid, simple to use and highly specific for labeling cell surface proteins. Many novel cell surface proteins are only detectable when using the cell-surface protein labeling protocol. Over 80 new cell-surface proteins for CHO cells were detected using DeCyder 2-D Differential Analysis Software. Over 80% of the identified cell surface labeled spots were membrane associated proteins.
Multiplexing is achieved using the three CyDye DIGE Fluor minimal dyes, and in combination with DeCyder 2-D software, this new protocol is a powerful tool for studying cell surface proteins with all the advantages obtained with the 2-D DIGE technology.
