Here, we describe a detailed protocol for the use of a luciferase-based reporter assay in a semi-automated, high-throughput screening format.
Growing evidence has shown that high autophagic flux is related to tumor progression and cancer therapy resistance. Assaying individual autophagy proteins is a prerequisite for therapeutic strategies targeting this pathway. Inhibition of the autophagy protease ATG4B has been shown to increase overall survival, suggesting that ATG4B could be a potential drug target for cancer therapy. Our laboratory has developed a selective luciferase-based assay for monitoring ATG4B activity in cells. For this assay, the substrate of ATG4B, LC3B, is tagged at the C-terminus with a secretable luciferase from the marine copepod Gaussia princeps (GLUC). This reporter is linked to the actin cytoskeleton, thus keeping it in the cytoplasm of cells when uncleaved. ATG4B-mediated cleavage results in the release of GLUC by non-conventional secretion, which then can be monitored by harvesting supernatants from cell culture as a correlate of cellular ATG4B activity. This paper presents the adaptation of this luciferase-based assay to automated high-throughput screening. We describe the workflow and optimization for exemplary high-throughput analysis of cellular ATG4B activity.
Autophagy is a conserved metabolic process that allows cells to keep intracellular homeostasis and respond to stress by degrading aged, defective, or unnecessary cellular contents via the lysosomes1,2,3. Under some pathophysiologic conditions, this process acts as a crucial cellular response to nutrient and oxygen deprivation, resulting in recycled nutrients and lipids, allowing the cells to adapt to their metabolic needs2,3,4. Autophagy has also been identified as a cellular stress response related to several diseases, such as neurodegenerative disorders, pathogen infection, and various types of cancer. The function of autophagy in cancer is complex and dependent on the type, stage, and status of the tumor. It can suppress tumorigenesis through autophagic degradation of damaged cells, but can also promote the survival of advanced tumors by improving cell survival during stressful conditions, such as hypoxia, nutrient deprivation, and cytotoxic damage2,4,5,6.
Several studies have shown that autophagy inhibition provides a benefit as an anticancer strategy. Thus, the inhibition of critical steps, such as autophagosome formation or its fusion with the lysosome, could be an effective method for cancer control2,4,5,6. Growing evidence has shown that ATG4B is involved in certain pathological conditions, and it has gained attention as a potential anticancer target2,3,4. For instance, it was observed that colorectal cancer cells and human epidermal growth factor receptor 2 (HER2)-positive breast cancer cells had significantly higher ATG4B expression levels than adjacent normal cells2,4. In prostate cancer cells, inhibition of ATG4B resulted in a cell line-specific susceptibility to chemotherapy and radiotherapy7. Recently, strong evidence has emerged that pancreatic ductal adenocarcinoma (PDAC) is particularly vulnerable to ATG4B inhibition. For instance, in a genetically engineered mouse model, it was shown that intermittent loss of ATG4B function reduces PDAC tumor growth and increases survival3,4. Overall, ATG4B is highly overexpressed in some cancer types, is related to the progression of tumor, and is linked to cancer therapy resistance2,4,8.
The ATG4 cysteine proteases in mammals have four family members, ATG4A-ATG4D. These proteins exhibit some target selectivity toward the LC3/GABARAP (ATG8) family of proteins9,10,11 and may have additional functions not linked to their protease activity12,13. Furthermore, ATG4 functions in regulating a novel type of post-translational modification, the ATG8-ylation of proteins11,12. While ATG4B and its main substrate LC3B are the most widely studied, a picture is emerging that suggests a complex role for each subfamily member in the regulation of autophagic and non-autophagic processes. This is further corroborated by a complex network of post-translational modifications that regulate ATG4B activity via phosphorylation, acetylation, glycosylation, and nitrosylation9,10,11,12,13.
Several known ATG4B inhibitors have been published2,4,14,15. While these are suitable as research tools, their pharmacodynamic profile, selectivity, or potency have yet precluded them from development as preclinical candidates4,16. Overall, there is an urgent need to identify more potent and selective compounds. Often, the compounds are good biochemical inhibitors of protein function, yet their efficacy in cell-based assays is poor. There are multiple assays to monitor ATG4B activity, including biochemical methods and cell-based assays4. We have previously developed a simple, luminescence-based, high-throughput assay for monitoring ATG4B activity in cells8,17. This assay utilizes a luciferase protein from Gaussia princeps (GLUC) that is stable and active in the extracellular milieu and can be inducibly released from cells in response to ATG4B proteolytic activity18,19.
In this reporter construct, dNGLUC is linked to the actin cytoskeleton of cells. A protease-specific linker can be introduced between the β-actin anchor and dNGLUC, turning the secretion dependent on cleavage of the linker. We used the full-length open reading frame of LC3B between β-actin and dNGLUC, to be able to monitor LC3B cleavage17,18,19. Although the secretion mechanism of dNGLUC is poorly understood, it is specific for monitoring ATG4B activity, does not depend on overall autophagy as it occurs in ATG5 knockout cells, and is mediated by non-conventional mechanisms that do not require a classical signal peptide4,18,19. We have successfully used this reporter to screen small molecules and siRNA libraries, and have identified novel regulators of ATG4B activity, such as the Akt protein kinases8. This paper describes a detailed protocol for the use of this luciferase reporter in a semi-automated, high-throughput screening format.
NOTE: The assay process is outlined in Figure 1. See the Table of Materials for details related to all materials, reagents, and equipment used in this protocol.
1. Retrovirus production
NOTE: The plasmid encoding the ActinLC3dNGLUC is pMOWS-ActinLC3dNGLUC20. Use a low-passage number of cells for high-titer virus production (ideally less than P20).
2. Retroviral transduction
3. Pooled population selection and maintenance
4. Compound addition
NOTE: The Selleckchem small molecule library consists of approximately 4,000 compounds arranged in eight rows and 10 columns in fifty 96-well plates at a stock concentration of 10 mM in dimethyl sulfoxide (DMSO).
5. Cell seeding
6. Harvesting the cellular supernatant
NOTE: The liquid handling robotic platform used here performs liquid handling with a multichannel arm for 96-tips. If no liquid-handling automation is available, the protocol can be adapted to low-throughput format by using multichannel pipettes.
7. Luciferase assay
NOTE: The dNGLUC used in the reporter exhibits flash kinetics with rapid signal decay. Due to the rapid decay of luminescence after adding substrate (coelenterazine), the plate reader should be set to measure the luminescence signal in the supernatants; inject the substrate to a well and read that well after a few seconds. For this reason, use a plate reader that is capable of monitoring luminescence and equipped with a substrate injector to ensure the time between the injection and read steps will be uniform for all samples. The settings used on the plate reader can be found in Figure 4.
8. Cell fixation and staining
NOTE: This step can be performed manually with the aid of a multichannel pipette or by using a bulk dispenser.
9. Image acquisition
NOTE: Perform image acquisition using an automated microscope. As an alternative to image acquisition to determine number of cells, the intracellular luciferase activity can also be determined. There are advantages and disadvantages with regards to whether one normalizes to cell numbers or to intracellular luciferase activity, which is discussed below. We find that determining cell numbers is less invasive and results in lower variability than determining intracellular luciferase values.
10. Image analysis
NOTE: Any image analysis software can be used to segment and count cell nuclei from the acquired images. Here, we describe the steps to use a specific online software that is compatible to multiple automated microscopes files.
In a previous publication8, we successfully used this assay to screen small molecule and siRNA libraries and identified novel regulators of ATG4B. Here, we describe the protocol and representative results of this luciferase reporter in a semi-automated, high-throughput screening format. Figure 8 shows an example of the raw data analysis for both cell nuclei and luminescence. A typical result of a luminescence measurement is depicted in Figure 8A. The basal luminescence signal from DMSO can be seen in column 1, and in the presence of 10 µM of the ATG4B inhibitor FMK9A in column 24. The nuclei count result from the same plate can be seen in Figure 8B. Raw values for each compound were normalized to neutral control mean values to obtain the percentage of ATG4B activity and cell survival (Figure 9A,B). As expected, most compounds had no effect on ATG4B activity, as indicated by values close to the basal luminescence from the negative control (DMSO – column 1). The Z' factor, which is a quality index for high-throughput screening, was calculated using equation (1):
Z' = 1 – (3 × ) (1)
Where STDpos is the standard deviation of the positive control (FMK9a), STDneg is the standard deviation of the negative control (DMSO), AVGpos is the average of the positive control, and AVGneg is the average of the negative control.
To select the hits, we used the normalized values to calculate a ratio to be used as a cut-off value for the identification of ATG4B inhibitors. The ratio was calculated by dividing the ATG4B activity of each compound by its cell viability. We considered that ratios >1 indicated possible ATG4B activators and ratios <1 indicated possible ATG4B inhibitors (Figure 9C). We selected all compounds with ratio values similar to the positive control FMK9A and excluded compounds that were cytotoxic.
In this screen, we cherry-picked 53 ATG4B inhibitors to confirm and evaluate their activity and toxicity. The compounds were tested in 10 concentrations as twofold dilutions ranging from 100 µM to 195 nM. The cells treated in a concentration response manner enabled fitting the quantified data and calculating the EC50 values. The inhibitors' relative toxicity was quantified by cell viability data. Taken together, these results showed that this approach enables the identification of ATG4B modulators.
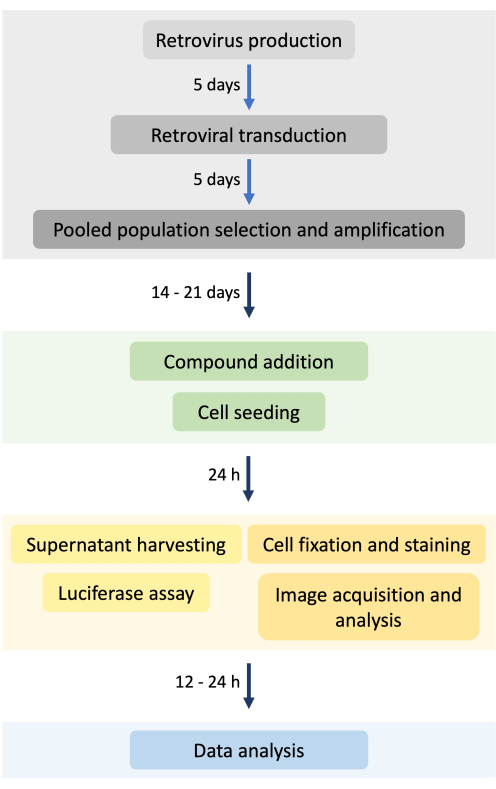
Figure 1: Assay workflow. The experiment details the timeline for stable cell line generation and a high-throughput assay workflow, starting with the stable cell line generation, compound screening, measurement of luciferase, image acquisition, and data analysis. Please click here to view a larger version of this figure.
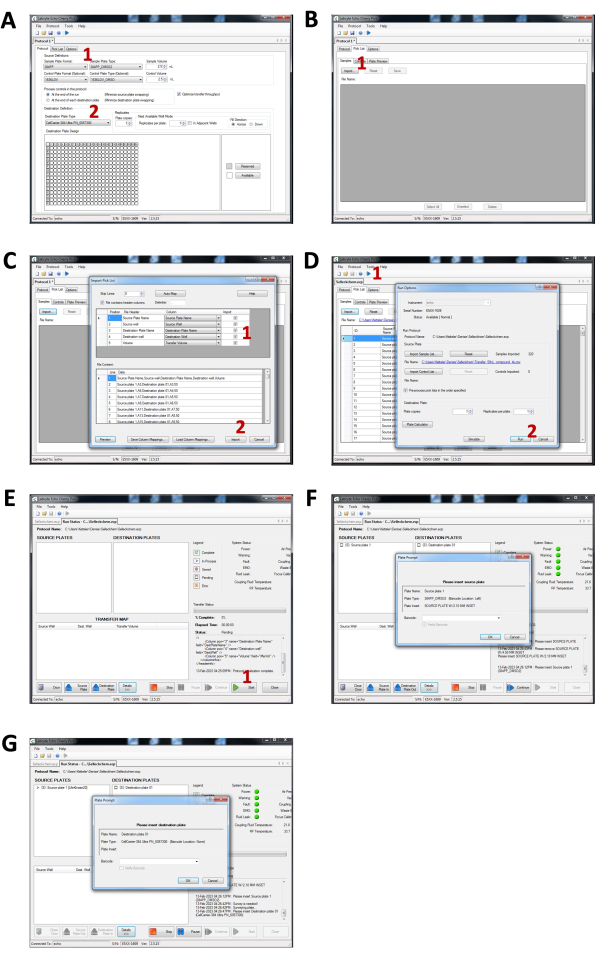
Figure 2: Step by step instructions for the liquid handler setup. (A) Protocol tab settings. (1) Select the sample plate format and type. (2) Select the destination plate type. (B) Pick List tab. (1) Use the import option to import the spreadsheet. (C) Import Pick List prompt window. (1) Select the parameters to import. (2) Click Import to conclude. (D) Running protocol. (1) Click on the Run icon. (2) Prompt window displaying the run option and to start the protocol run. (E) Run Status tab. (1) Start the protocol. (F) Prompt window for loading the source plate. (G) Prompt window for loading the destination plate. Please click here to view a larger version of this figure.
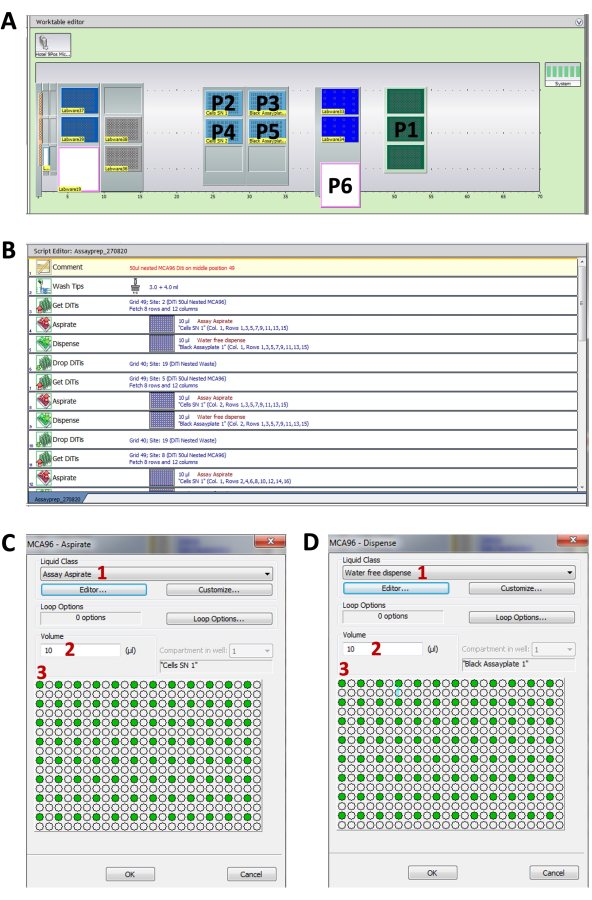
Figure 3: Configuration of liquid handling robot. (A) Configuration of the Tecan deck. (P1) Position for the 50 µL disposable tip stack. (P2,P4) Positions for the assay plate. (P3,P5) Positions for the empty, solid-black, 384-well plates. (P6) Position for disposing the used tips. (B) Screenshot of the assay script. (C) Screenshot of the MAC96 aspirate details. (1) Select the aspiration liquid class. (2) Type the volume for aspiration. (3) Select the well positions for aspiration. (D) Screenshot of the MAC96 dispense details. (1) Select the dispensing liquid class. (2) Type the volume for dispensing. (3) Select the same well positions for dispensing. Please click here to view a larger version of this figure.
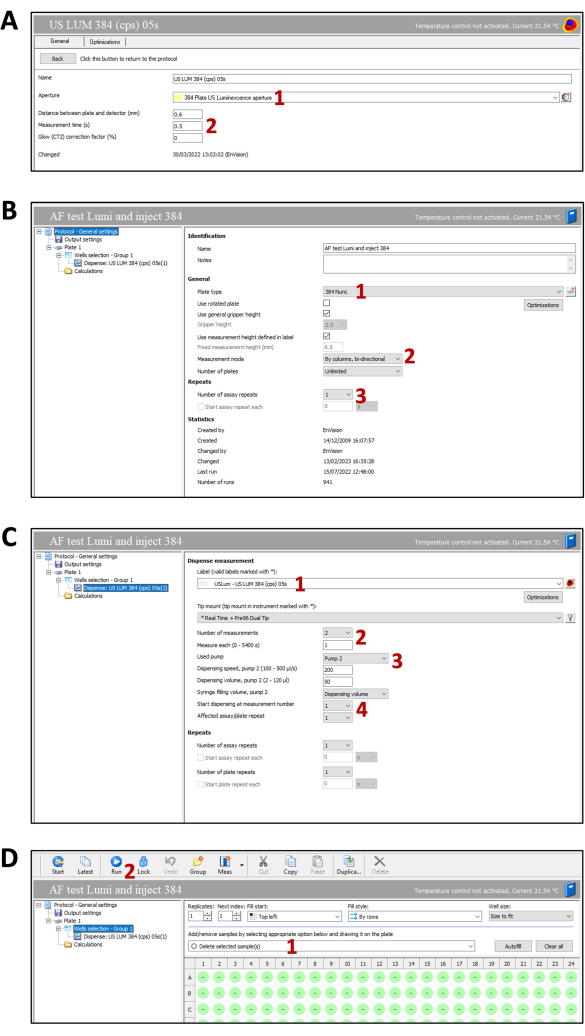
Figure 4: Screenshot of the luminescence plate reader settings. (A) Measurement settings tab. (1) Select the aperture. (2) Select the distance, time, and correction factor. (B) Protocol general settings. (1) Select the plate type. (2) Select the measurement mode. (3) Select the number of assay plates. (C) Dispense measurement settings. (1) Select the measurement. (2) Set the measurement time. (3) Select the pump, dispensing speed, and volume. (4) Define the dispense order and plate repetition. (D) Well selection tab. (1) Select the wells for measurement. (2) Start the measurement protocol. Please click here to view a larger version of this figure.
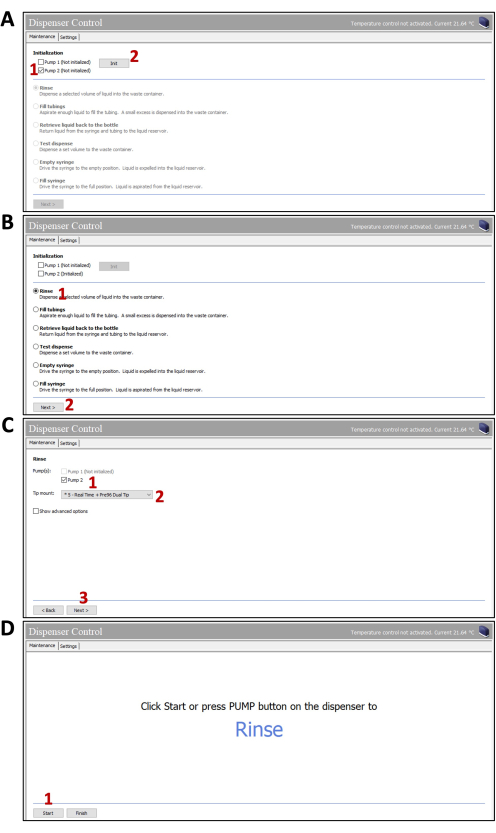
Figure 5: Screenshot of the dispenser control of the luminescence plate reader. (A) Initialization Tab. (1) Select the pump. (2) Initiate the pump. (B) Rinse protocol option. (1) Select the rinse option. (2) Click next to move to settings. (C) Rinse tab settings options. (1) Select the pump. (2) Select the tip mount. (3) Click next to move to next tab. (D) Tab for starting the rinsing. (1) Click on start to initiate the rinsing protocol. Please click here to view a larger version of this figure.
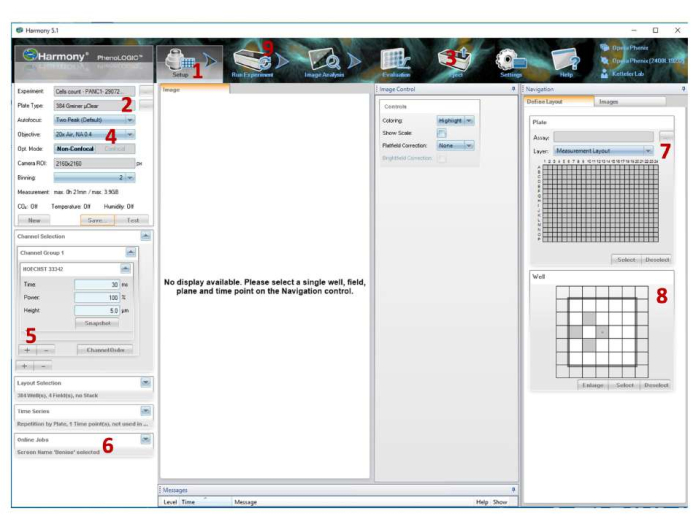
Figure 6: Screenshot of the automated high-content microscope imaging software. Details of the settings used for image acquisition. (1) Setup tab. (2) Select the plate type. (3) Select Eject to load the plate into the microscope. (4) Select the objective. (5) Add the channel. (6) Select the folder to transfer data to Columbus software. (7) Select wells. (8) Select fields. (9) Click on the Run experiment tab to start image acquisition. Please click here to view a larger version of this figure.
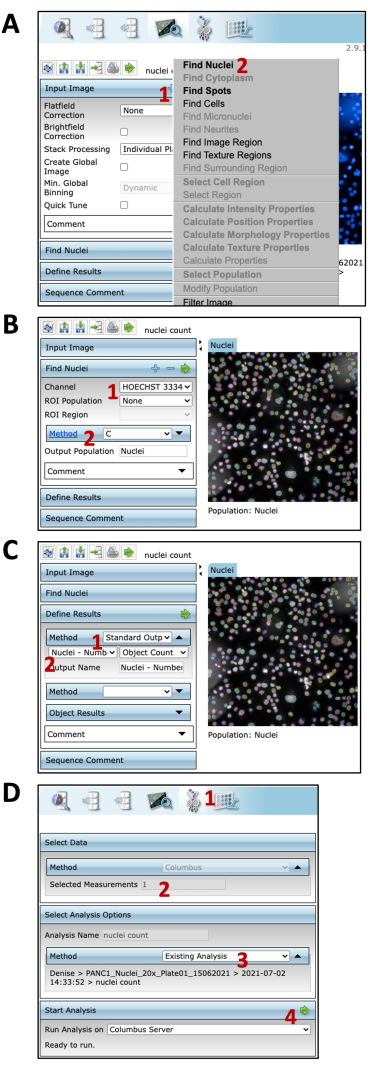
Figure 7: Image analysis on online software. (A) Image analysis tab. (1) Click on + to add a building block. (2) Select the Find Nuclei option. (B) Find Nuclei settings. (1) Select the channel. (2) Select the segmentation method. (C) Define results tab. (1) Select Standard Output. (2) Select the option to be displayed as the result. (D) Image analysis. (1) Batch Analysis tab. (2) Select the measurement. (3) Select the analysis method. (4) Start image analysis. Please click here to view a larger version of this figure.
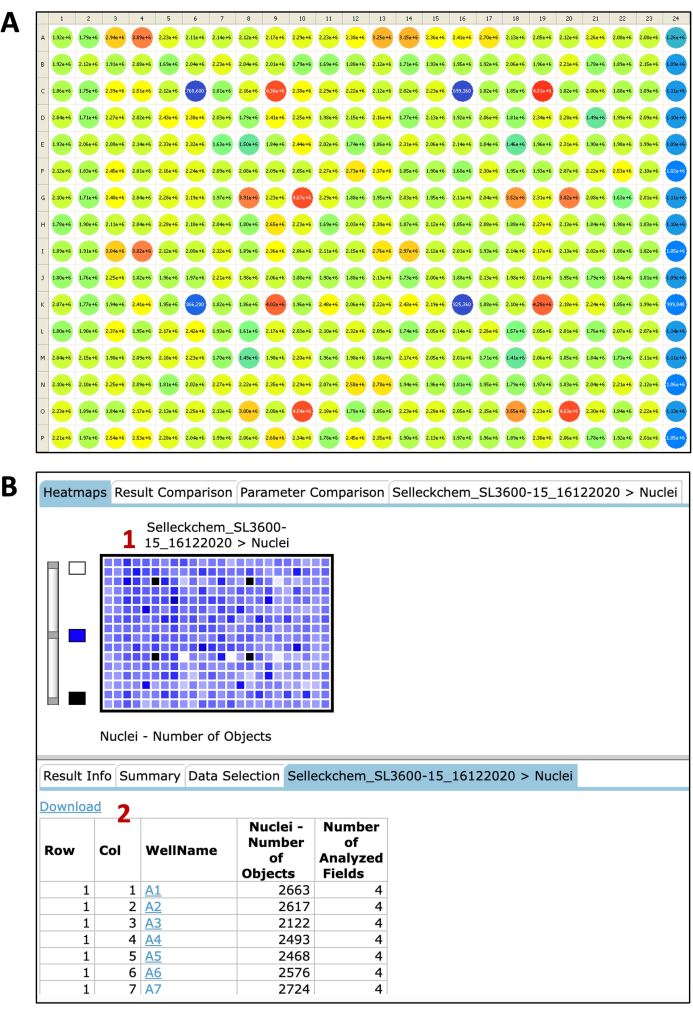
Figure 8: Representative images from luciferase measurements and nuclei count. (A) Luciferase relative intensity values from a 384-well assay plate represented by numbers and colors. (B) Image analysis results. (1) Heatmap of the nuclei number of objects. (2) Table displaying the results for each well. Please click here to view a larger version of this figure.
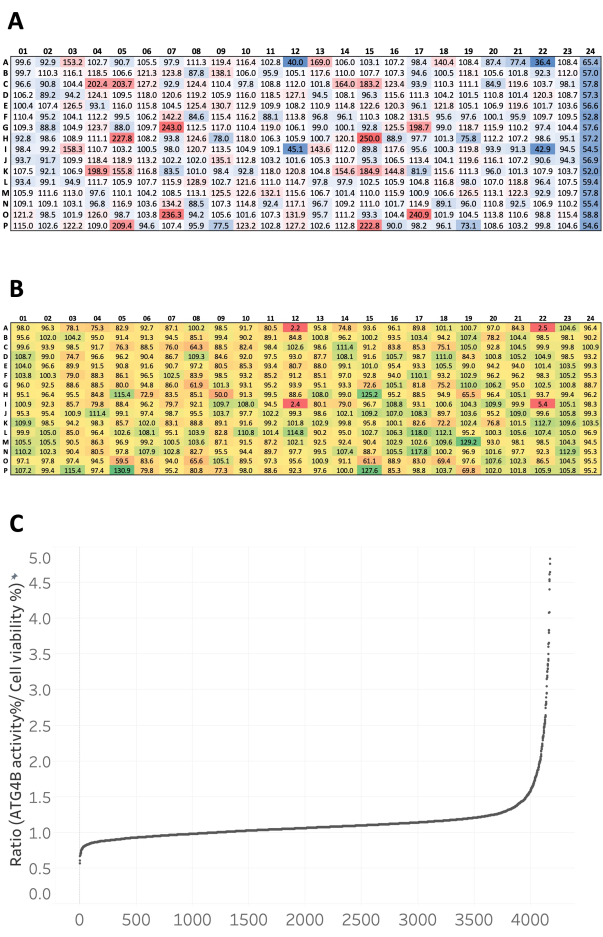
Figure 9: Representative results after data normalization. (A) Representative ATG4B activity percentage after data normalization to mean ATG4B activity from negative control (DMSO) wells within the same plate. Activators are shown in red and inhibitors in blue, with white indicating no significant change in activity. Negative control (DMSO) is found in column 1 and positive control (FMK9A) is found in column 24. (B) Representative cell viability percentage after data normalization to mean cell number from negative control (DMSO) wells within the same plate. Proliferation is shown in green and toxicity in red, with yellow indicating no significant change in cell viability. Negative control (DMSO) is found in column 1 and positive control (FMK9A) is found in column 24. (C) Distribution of compounds according to the ratio value. Each dot represents one compound. The ratio was calculated by dividing the ATG4B activity by cell viability. Please click here to view a larger version of this figure.
This protocol describes a cell-based reporter-gene assay for the identification of ATG4B inhibitors. The identification of primary hits is based on luciferase activity upon the treatment of cells expressing the full-length open reading frame of LC3B between β-actin and dNGLUC. Some advantages of this assay are that it is sensitive, highly quantitative, and noninvasive, as it can detect dNGLUC without lysing the cells. This paper presents a detailed protocol for generating a stable cell line and a primary screening. There are a few critical steps in the protocol.
First, the protocol described here used the PANC1 cell line, which presents a high transfection efficacy and high proliferation ability. This screening method can be performed using other cell lines, but transduction efficacy may vary from one cell line to another. Second, one should avoid working with stable cell populations from frozen stock with passage numbers higher than five, as expression levels of the reporter might decrease over time. Third, it is important to use a fresh cell batch before each assay to obtain the maximum and a consistent signal of luciferase within different experiments. Fourth, when seeding the cells, either manually or by using a bulk dispenser, the cell suspension needs to be constantly stirred to achieve a homogeneous cell density throughout the plate. Fifth, when harvesting the supernatant from the well, it is important that the tips are positioned at an appropriate depth inside the wells to aspirate the supernatant without disturbing the cell monolayer at the bottom of the well. Finally, the substrate working solution should be prepared on the day of the assay. Coelenterazine is very light-sensitive and subject to oxidation, and there are some reports of rapid substrate decay after preparing.
A number of cell-based assays are available to investigate the consequence of ATG4B inhibition or activation, but examining the cellular activity of ATG4B remains limited4. This method is noninvasive, highly sensitive, robust, and directly dependent on ATG4B activity, as its activity results in the release of dNGLUC. The described protocol is simple and requires only a short time to screen 10x 384-well plates. Another advantage of the method is that it can be used for monitoring ATG4B activity in vivo, since dNGLUC is highly stable and can be measured ex vivo from serum.
Although we have successfully used this reporter to screen small molecule and siRNA libraries and identified novel regulators of ATG4B activity, there are a few limitations to be considered in this protocol. First, the described cell-based assay relies on a reporter readout that indirectly reflects changes in ATG4B activity, enabling the detection of both inhibitors and activators of ATG4B activity. Therefore, the hits should undergo further evaluation so that their specificity and activity are validated. Moreover, inhibitors should be further evaluated in their capacity to regulate the spatial distribution of LC3 in cells or that of other autophagy-related proteins. Second, although this assay can easily be modified to a smaller-scale assay due to its simple handling and data analysis, it requires a degree of automation for substrate addition and subsequent luminescence measurement. Third, because the mechanism of dNGLUC release is poorly understood at a molecular level, compounds interfering with elements of the secretion pathway may affect the results. Finally, the cell viability can also be determined by the intracellular luciferase activity. Although we find that determining cell numbers is less invasive and results in lower variability than determining intracellular luciferase values, determining cell numbers limits their use for smaller research labs as they present difficulties in terms of imaging equipment, data analysis software, and data storage. Overall, the developed cell-based reporter-gene assay enables the identification of ATG4B inhibitors.
The authors have nothing to disclose.
This work was supported by UK Medical Research Council core funding to the MRC-UCL University Unit Grant Ref MC_U12266B, MRC Dementia Platform Grant UK MR/M02492X/1, Pancreatic Cancer UK (grant reference 2018RIF_15), and the UCL Therapeutic Acceleration Support scheme, supported by funding from MRC Confidence in Concept 2020 UCL MC/PC/19054. The plasmid encoding the ActinLC3dNGLUC (pMOWS-ActinLC3dNGLUC) was obtained from Dr. Robin Ketteler (Department of Human Medicine, Medical School Berlin).
50 µL Disposable Tips – Non-filtered, Pure, Nested 8 Stack (Passive Stack) | Tecan | 30038609 | Disposable 96-tip rack |
BioTek MultiFlo | BioTek | bulk dispenser | |
Coelenterazine | Santa Cruz Biotechnology | sc-205904 | substrate |
Columbus Image analysis software | Perkin Elmer | Version 2.9.1 | image analysis software |
DPBS (1x) | Gibco | 14190-144 | |
Echo Qualified 384-Well Polypropylene Microplate, Clear, Non-sterile | Beckman Coulter | 001-14555 | 384PP plate |
EnVision II | Perkin Elmer | luminescence plate reader | |
Express pick Library (96-well)-L3600-Z369949-100µL | Selleckchem | L3600 | Selleckchem |
FMK9A | MedChemExpress | HY-100522 | |
Greiner FLUOTRAC 200 384 well plates | Greiner Bio-One | 781076 | solid-black 384-well plates |
Harmony Imaging software | Perkin Elmer | Version 5.1 | imaging software |
Hoechst 33342, Trihydrochloride, Trihydrate – 10 mg/mL Solution in Water | ThermoFisher | H3570 | Hoechst 33342 |
Labcyte Echo 550 series with Echo Cherry Pick software | Labcyte/Beckman Coulter | nanoscale acoustic liquid dispenser | |
Milli-Q water | deionized water | ||
Opera Phenix High-Content Screening System | Perkin Elmer | automated microscope | |
Paraformaldehyde solution 4% in PBS | Santa Cruz Biotechnology | sc-281692 | |
PhenoPlate 384-well, black, optically clear flat-bottom, tissue-culture treated, lids | Perkin Elmer | 6057300 | CellCarrier-384 Ultra PN |
pMOWS-ActinLC3dNGLUC | Obtained from Dr. Robin Ketteler (Department of Human Medicine, Medical School Berlin) | ||
Polybrene Infection / Transfection Reagent | Merck | TR-1003-G | polybrene |
Puromycin dihydrochloride, 98%, Thermo Scientific Chemicals | ThermoFisher | J61278.ME | Puromycin |
Tecan Freedom EVO 200 robot | Tecan | liquid handling robotic platform | |
X-tremeGENE HP DNA Transfection Reagent Roche | Merck | 6366244001 | DNA transfection reagent |