We present CorrelationCalculator and Filigree, two tools for data-driven network construction and analysis of metabolomics data. CorrelationCalculator supports building a single interaction network of metabolites based on expression data, while Filigree allows building a differential network, followed by network clustering and enrichment analysis.
A significant challenge in the analysis of omics data is extracting actionable biological knowledge. Metabolomics is no exception. The general problem of relating changes in levels of individual metabolites to specific biological processes is compounded by the large number of unknown metabolites present in untargeted liquid chromatography-mass spectrometry (LC-MS) studies. Further, secondary metabolism and lipid metabolism are poorly represented in existing pathway databases. To overcome these limitations, our group has developed several tools for data-driven network construction and analysis. These include CorrelationCalculator and Filigree. Both tools allow users to build partial correlation-based networks from experimental metabolomics data when the number of metabolites exceeds the number of samples. CorrelationCalculator supports the construction of a single network, while Filigree allows building a differential network utilizing data from two groups of samples, followed by network clustering and enrichment analysis. We will describe the utility and application of both tools for the analysis of real-life metabolomics data.
In the last decade, metabolomics has emerged as an omics science due to advances in analytical technologies such as Gas Chromatography-Mass Spectrometry (GC-MS) and Liquid Chromatography-Mass Spectrometry (LC-MS). These techniques allow simultaneous measurement of hundreds to thousands of small molecule metabolites, creating complex multidimensional datasets. Metabolomics experiments can be performed in targeted or untargeted modes. Targeted metabolomics experiments measure specific classes of metabolites. They are usually hypothesis-driven, while untargeted approaches attempt to measure as many metabolites as possible and are hypothesis-generating in nature. Targeted assays usually include internal standards and thus allow for absolute quantification of metabolites of interest. In contrast, untargeted assays allow relative quantification and include many unknown metabolites1.
Analysis of metabolomics data is a multi-step process that leverages many specialized software tools1. It can be divided into the following three major steps: (1) data processing and quality control, (2) statistical analysis, and (3) biological data interpretation. The tools described here are designed to enable the latter step of the analysis.
An intuitive and popular way to interpret metabolomics data is to map the experimental measurements onto metabolic pathways. Numerous tools have been designed to achieve this2,3,4,5, including Metscape, developed by our group6. Pathway mapping is often combined with enrichment analysis, which helps identify the most significant pathways7,8. These techniques first gained prominence in the analysis of gene expression data and have been successfully applied for the analysis of proteomics and epigenomics data9,10,11,12,13. However, the analysis of metabolomics data presents a number of challenges for knowledge-based approaches. First, in addition to the endogenous metabolites, metabolomics assays measure exogenous compounds, including those that come from nutrition and other environmental sources. These compounds, as well as metabolites produced by bacteria, cannot be mapped onto human or metabolic pathways of other eukaryotic organisms. Further, pathway coverage of secondary metabolism and lipid metabolism currently does not allow high-resolution mapping at the level that would easily support the biological interpretation of the data14,15.
Data-driven network analysis techniques can help overcome these challenges. For example, correlation-based networks can help derive relationships among both known and unknown metabolites and facilitate the annotation of the unknowns16. While computing Pearson's correlation coefficients is the most straightforward approach to establishing the linear relationships between metabolites, the disadvantage is that it captures both direct and indirect associations17,18,19. An alternative is to compute partial correlation coefficients that can distinguish between direct and indirect associations. Gaussian graphical modeling (GGM) can be used to estimate partial correlation networks. However, GGM requires that the sample size and the number of features be comparable. This condition is rarely met in untargeted LC-MS data that contains measurements for thousands of metabolic features. Regularization techniques can be utilized to overcome this limitation. Graphical lasso (Glasso) and nodewise regression are popular methods for regularized estimation of the partial correlation network16,20.
The first of the bioinformatics tools presented here, CorrelationCalculator16, is based on the debiased sparse partial correlation (DSPC) algorithm. DSPC relies on de-sparsified graphical lasso modeling. The underlying assumption of the algorithm is that the number of connections among the metabolites is considerably smaller than the number of samples, i.e., the partial correlation network of metabolites is sparse. This assumption allows DSPC to discover the connectivity among large numbers of metabolites using fewer samples, leveraging regularized regression techniques. Further, using a debiasing step for the regularized regression estimates, it obtains sampling distributions for the edge parameters that can be used to construct confidence intervals and test hypotheses of interest (e.g., presence/absence of a single or a group of edges). The presence or absence of an edge in the partial correlation network can thus be formally tested using the computed p-values.
CorrelationCalculator proved to be very useful for single-group analysis16; however, the objective of many metabolomics experiments is the differential analysis of two or more conditions. While CorrelationCalculator can be employed on each of the groups separately to generate partial correlation networks for each condition, this approach limits the number of samples that can be used for network generation. Since a sufficiently large sample size is one of the biggest considerations in data-driven analysis, methods that can leverage all available samples in the data to construct networks are highly desirable. This approach is implemented in the second tool presented here, called Filigree21. Filigree relies on the previously published Differential Network Enrichment Analysis (DNEA) algorithm22. Table 1 shows the applications and the workflow of both tools.
Number of experimental conditions (k) | k = 1 | k = 2 |
Software tool | CorrelationCalculator | Filigree |
Input data | • Metabolites x Samples data matrix | • Metabolites x Samples data matrix • Experimental groups |
Workflow • Pretreatment • Network estimation • Network clustering • Enrichment analysis |
• Log transformation; autoscaling • DSPC • Via external apps • No |
• Log transformation; autoscaling • Joint network estimation • Consensus clustering • NetGSA |
Data visualization | Via external app, e.g., Cytoscape | Via external app, e.g., Cytoscape |
Testing metabolic modules for the association with outcome of interest (optional) | Via external apps | Via external apps |
Table 1: The scope of application and the workflow of CorrelationCalculator and Filigree.
1. CorrelationCalculator
2. Filigree
3. Additional considerations
To illustrate the use of CorrelationCalculator, we constructed a partial correlation network using a subset of the metabolomics data from the KORA population study described in Krumsiek et al.24. The dataset contained 151 metabolites and 240 samples. Figure 1 shows the resulting partial correlation network that was visualized in Cytoscape. The network contains 148 nodes and 272 edges. The color of the nodes represents metabolites that belong to different chemical classes, while the edges represent the adjusted p-value of the partial correlation coefficients (adjusted p-value < 0.05) . Notably, despite not using any prior information CorrelationCalculator was able to group together chemically related metabolites. For example, phosphatidylcholines and lysophosphatidylcholines are closely connected in the network. Visualizing metabolite changes in the context of this type of network can facilitate hypothesis generation, help plan future experiments and enable manuscript preparation. To illustrate a potential workflow utilizing a partial correlation metabolite network, we performed consensus network clustering as described in Ma et al.22, resulting in the identification of 9 subnetworks or metabolic modules. These modules had a good agreement with the chemical classes, i.e., metabolites belonging to the same chemical class tended to be part of the same metabolic module. The user can access the clustering tool clusterNet at https://github.com/Karnovsky-Lab/clusterNet.
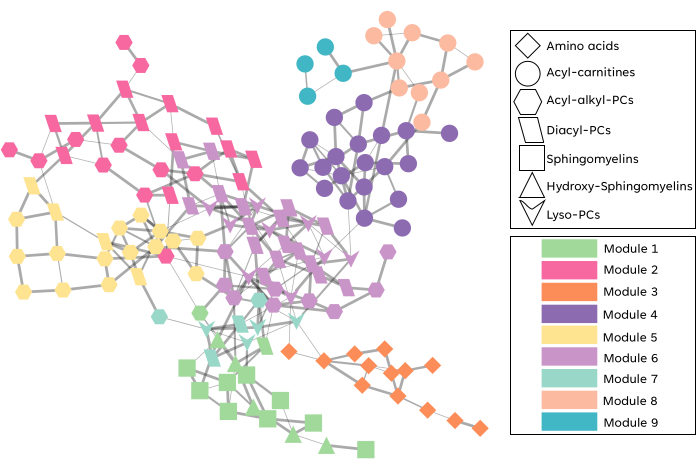
Figure 1: Representative example of a CorrelationCalculator network. The network was constructed from a subset of the KORA population study metabolomics data24 consisting of 151 metabolites across 240 subjects. The nodes represent metabolites, and the edges connecting them are weighted by the adjusted p-value of partial correlation coefficients (adjusted p-value < 0.05). The shape of the nodes represents different metabolic classes, and the color represents metabolic modules obtained by clustering the network using the consensus clustering method. Please click here to view a larger version of this figure.
We illustrate the application of Filigree by analyzing a dataset from a mouse model of type I diabetes (T1D)25,26. Plasma metabolite measurements from T1D and non-diabetic (NOD) mice were used to generate a differential partial correlation network (Figure 2). Notably, we observe a higher degree of network connectivity in the non-diabetic group. The next steps of the analysis identified twelve metabolic modules, nine of which were significantly different between T1D and non-diabetic mice (FDR < 0.05). We refer the reader to the original publication for further insights into biological conclusions that can be drawn from this analysis21.
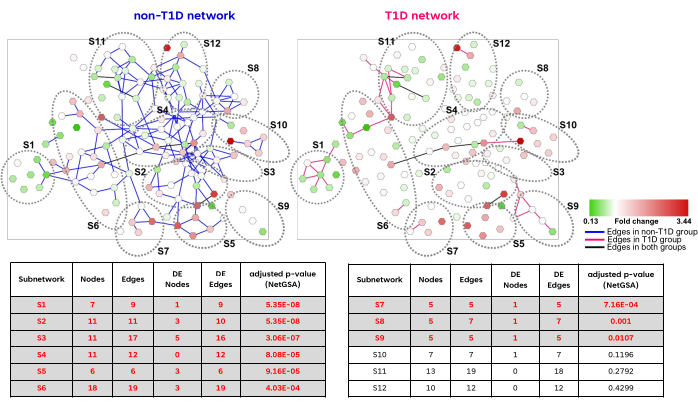
Figure 2: Representative example of a Filigree network. The differential network was constructed utilizing the levels of 163 metabolites from 71 mice (30 T1D and 41 non-T1D)25,26. Differential edges between T1D and non-T1D groups are indicated in pink and blue, respectively. The nodes are colored based on the fold change. The table shows the enrichment results produced by Filigree. Nine out of the twelve identified subnetworks were significantly different between T1D and non-T1D (adjusted p-value < 0.05). Please click here to view a larger version of this figure.
Supplementary Figure 1: CorrCalc_InputTab. Screenshot of the Correlation Calculator's Input tab. Please click here to download this File.
Supplementary Figure 2: CorrCalc_DataNormTab. Screenshot of the Correlation Calculator's Data Normalization tab. Log-2 Transform Data and Autoscale Data are checked. Please click here to download this File.
Supplementary Figure 3: CorrCalc_DataAnalTab. Screenshot of the Correlation Calculator's Data Analysis tab showing filtering to Pearson's Correlation of 0-0.8. In addition, the DSPC Method has been selected. Please click here to download this File.
Supplementary Figure 4: Filigree_DataTab. Screenshot of Filigree's Data tab. Columns, rows, and groups have been specified. The Calculate Feature Groups method has been selected with a feature reduction of 1.25 feature-to-sample ratio. Please click here to download this File.
Supplementary Figure 5: Filigree_AnalysisTab. Screenshot of Filigree's Analysis tab showing the progress of the different analysis components. Please click here to download this File.
Supplementary Figure 6: Filigree_Subnetwork1. A subnetwork generated from Filigree. Node color represents up/down-regulation, and color opacity represents higher/lower fold change. The edge color represents the differential status between groups. Please click here to download this File.
Supplementary Figure 7: Filigree_Subnetwork_SampleGroup. Subnetwork separated by group. The left network represents diabetic samples, and the right network represents non-diabetic samples. Node color represents expression level proportional to the group mean. Please click here to download this File.
Partial correlation-based network analysis methods implemented in CorrelationCalculator and Filigree help overcome some of the limitations of knowledge-based metabolic pathway analyses, especially for the datasets with a high prevalence of unknown metabolites and limited coverage of metabolic pathways (e.g., lipidomics data). These tools have been widely used by the research community to analyze a broad range of metabolomics and lipidomics data14,22,27,28,29,30. For example, CorrelationCalculator has been used to analyze the data from many biological systems ranging from microbiome and plants to human disease31,32,33,34. Here we illustrate how data-driven network analysis, enabled by our tools, can be combined with clustering and regression analysis to pinpoint the metabolic modules associated with the phenotype of interest.
Partial correlation networks generated using CorrelationCalculator and Filigree can be clustered using graph clustering algorithms to produce metabolic modules. These modules tend to comprise metabolites that are chemically or functionally related to each other. Such modules are very useful not just from a visualization perspective but also from a biological relevance standpoint. Studying the relationships between metabolic modules and phenotypic outcomes of interest (e.g., survival outcome) can provide more statistical power and generate additional biological insights compared to testing individual metabolites.
Metabolic modules identified through network clustering approaches can also be used in enrichment analysis. Filigree uses metabolic modules identified through consensus clustering instead of predefined biological pathways. Although partial correlation-based metabolic modules are not identical to pathways, they consistently group chemically and biochemically similar metabolites (e.g., amino acids, acylcarnitines, lipids of the same class, etc.). Filigree further tests the significance of these modules using NetGSA algorithm22,35. In addition to differential nodes, NetGSA accounts for disease-specific differences in network structure.
One of the issues to consider when using CorrelationCalculator and Filigree for the analysis of 'real life' metabolomics and lipidomics data is the relationship between the number of metabolites vs. the number of samples in a given experiment. While large-scale epidemiological studies involving thousands of samples are becoming more common, the sample size in the majority of metabolomics experiments remains modest. This is particularly true for mechanistic studies involving systems where low biological variation is expected (i.e., cell lines or genetically homogeneous animal models). The statistical algorithms implemented in both tools can be applied in situations when the number of metabolites exceeds the number of samples, but the increase in that ratio leads to more sparse networks.
Another important consideration for the application of the tools described here concerns the analysis of untargeted metabolomics data that are known to contain a large number of redundant or degenerate features36, which may include isotopes, chemical adducts, in-source fragments, and contaminants. Since many degenerate features originate from the same metabolite, they tend to have a high degree of correlation. Partial correlation-based analysis of such data may require careful annotation and removal of degenerate features.
In conclusion, the tools presented here provide a viable alternative to knowledge-based pathways analysis tools for the interpretation of metabolomics data.
The authors have nothing to disclose.
This work was supported by NIH 1U01CA235487 grant.
CorrelationCalculator | JAVA | http://metscape.med.umich.edu/calculator.html | |
clusterNet | https://github.com/Karnovsky-Lab/clusterNet | ||
Cytoscape | Cytoscape | https://cytoscape.org/ | |
Filigree | JAVA | http://metscape.med.umich.edu/filigree.html | |
MetScape | Cytoscape | https://apps.cytoscape.org/apps/metscape | Cytoscape application that allows for the creation and exploration of correlation networks. |