A puncture wound procedure for hemostatic thrombus formation is presented here. The formed thrombi are large and are hundreds of microns in diameter. Hence, volume imaging approaches are appropriate. We suggest montaged wide-area transmission electron microscopy as a high-resolution approach available to many and detail a preparative protocol.
Hemostasis, the process of normal physiological control of vascular damage, is fundamental to human life. We all suffer minor cuts and puncture wounds from time to time. In hemostasis, self-limiting platelet aggregation leads to the formation of a structured thrombus in which bleeding cessation comes from capping the hole from the outside. Detailed characterization of this structure could lead to distinctions between hemostasis and thrombosis, a case of excessive platelet aggregation leading to occlusive clotting. An imaging-based approach to puncture wound thrombus structure is presented here that draws upon the ability of thin-section electron microscopy to visualize the interior of hemostatic thrombi. The most basic step in any imaging-based experimental protocol is good sample preparation. The protocol provides detailed procedures for preparing puncture wounds and platelet-rich thrombi in mice for subsequent electron microscopy. A detailed procedure is given for in situ fixation of the forming puncture wound thrombus and its subsequent processing for staining and embedding for electron microscopy. Electron microscopy is presented as the end imaging technique because of its ability, when combined with sequential sectioning, to visualize the details of the thrombus interior at high resolution. As an imaging method, electron microscopy gives unbiased sampling and an experimental output that scales from nanometer to millimeters in 2 or 3 dimensions. Appropriate freeware electron microscopy software is cited that will support wide-area electron microscopy in which hundreds of frames can be blended to give nanometer-scale imaging of entire puncture wound thrombi cross-sections. Hence, any subregion of the image file can be placed easily into the context of the full cross-section.
The formation of a puncture wound thrombus that leads to bleeding cessation is one of the most essential events in life1. Yet despite that essentiality, knowledge of what occurs structurally during thrombus formation, be it in a vein, an artery, an atherosclerotic event, or an occlusive clot, has been limited by resolution and imaging depth. Conventional light microscopy is limited in depth when compared to a fully formed puncture wound thrombus, 200 to 300 µm in Z1, and in resolution level when compared to the size of platelet organelles and their spacing, often less than 30 nm2. Two-photon light microscopy can yield the needed depth of imaging but does not improve resolution significantly. The most recent advances in light microscopy, for example, super-resolution techniques, are still resolution limited, in practice ~20 nm in XY and twice that in Z, and depth limited, no more than conventional light microscopy. Furthermore, super-resolution light microscopy, like much of research light microscopy, is based on fluorescence microscopy, a technique that is inherently biased to a small set of candidate proteins for which good antibodies exist or good tagged constructs3. In conclusion, conventional scanning electron microscopy can, at most, visualize the surface of the forming platelet-rich thrombus.
To overcome these technical limitations to characterizing thrombus structure, we had three goals. First, reproducibly produce a defined puncture wound in a mouse vein or artery that could then be readily stabilized in situ by chemical fixation. Second, apply a preparative procedure that emphasizes membrane preservation, a goal consistent with the aim of defining the position of individual platelets within the forming thrombus. Third, use an unbiased visualization technique that, in a single image, could be scaled between nanometer to near millimeter scale.
Montaged, wide-area electron microscopy was chosen as a major end visualization technique for a single important reason: in electron microscope imaging, one sees a vast array of features within a cell that outlines its organelles and features within the organelles. Small objects such as ribosomes can be recognized. This range of features is seen because the electron-dense heavy metal stains, uranyl, lead, and osmium, that are used for electron microscopy to yield contrast bind to a wide range of molecules. In an electron microscope image, one sees much of what is there, while with immunofluorescence and protein tagging approaches, one only sees what lights up. This means, for example, the antigen sites present on a given individual protein species. In the case of a tagged molecule, often a protein, it is the site(s) where that protein is. All other molecules are dark and not lit up. However, is this choice of electron microscopy practical? A puncture wound thrombus has a size of 300 by 500 µm and, at a pixel size of 3 nm, that is an image of 100,000 by 167,000 pixels. A high-quality electron microscope camera has 4000 by 4000 pixels. That means that approximately 1000 frames must be stitched/blended to give a single image. That is a possibility that has been present in most electron microscopes manufactured in the last 15 years. The microscope stage is computerized, and the images can be stitched together with a computer. That is the rationale that led to choices underlying the formulation of the presented protocol.
Conclusively, we present below a series of steps that give a reproducible wound in the vein or artery of mice that then, following in situ fixation steps and later embedding steps, can be visualized by montaged, wide-area transmission electron microscopy at nm scale and in the stitched image visualized at near mm scale, the scale of the actual in situ fixed thrombus. Scalability of this kind is required for understanding thrombus formation as both a problem in hematology/health and as a developmental biology system in which platelets are the major cell type. These advances deliver a major virtue of electron microscopy, namely, one sees what is there, not only what lights up. For a detailed protocol on the preparation of samples for serial block face scanning electron microscopy (SBF-SEM), the reader is directed to a recent article by Joshi et al.4.
Experiments were reviewed and approved by the Institutional Animal Care and Use Committee (IACUC) at the University of Arkansas for Medical Sciences. Here, 8 – 12-week-old, wild-type male and female C57BL/6 mice were used. These mice are young adults with little accumulation of fat. The same procedures are applicable to mice mutants for various proteins important to hemostasis, such as von Willebrand factor or platelet glycoprotein VI (GPVI)5,6. All equipment, surgical instruments, reagents, and other materials used are shown in Figure 1 and listed in the Table of Materials.
1. Jugular vein/femoral artery puncture wound1,7
2. Collection of samples for electron microscopy
3. Preparation of sample for montaged wide-area transmission electron microscopy (WA-TEM)
NOTE: This step represents a decision point at which the investigator is committing to preparing for WA-TEM. This preparative procedure does not support SBF-SEM. For SBF-SEM volume EM, all staining must be done before embedding in plastic. Please see4 for an SBF-SEM preparation protocol.
Quantitation of drug effects on puncture wound bleeding time
Puncture wound bleeding times provide a physiological model of a drug risk that can be readily carried out in mice. Outcomes that come from a puncture wound experiment are predictive. Here, we show a dabigatran dose-response bleeding curve. Dabigatran, a thrombin inhibitor, is used as an oral direct-acting anti-coagulant, a so-called DOAC12. The jugular vein puncture wound model was used to assess the risk inherent in different doses of dabigatran through potential prolonged bleeding through delayed thrombus formation in mice. A varying dosage of 15, 50, or 150 μg/kg of dabigatran was administered intravenously (i.v.) 20 min before the jugular vein puncture. We show the bleeding time means at various concentrations of dabigatran (Figure 4). At dose level, a significant prolongation of bleeding time is observed, p <0.051. This indicates a significant risk factor in the use of the drug in humans. Experimentally, the drug at these doses has a significant effect on the ultrastructure of the forming thrombus.
Assessing platelet activation state in a forming puncture wound thrombus
The WA-TEM approach provides both an overview of a wound area in a single plane when viewed at lower magnification and much detail at higher magnification (Figure 5). The details obtained can be directly placed within the context of the overview. We have used this approach to assess the recruitment of discoid-shaped platelets to a forming puncture wound thrombus. Circulating platelets are discoid, hence the name, and contain a full set of secretory granules. A key question has been how circulating platelets can be recruited to the growing thrombus without disturbing the free-flowing properties of the remaining platelets. Our work points to a Tether and Activate hypothesis in which circulating platelets are recruited to the thrombus, one by one, through a tethering process as discoid platelets containing a full set of organelles2. The evidence for this comes from WA-TEM of jugular vein thrombi 1 min post-puncture. Following sectioning to yield full thrombus slices from the middle of the still bleeding wound, we imaged 500-800 frames, 4,000 by 4,000 pixels, 3.185 nm pixel size in a rectangular XY raster grid across the complete dimension of the thrombus in cross-section using an automated stage and a transmission electron microscope using SerialEM software10. Frames were then stitched together using eTomo software, part of the IMOD program suite11. This results in a single image of varying size, for example, 120,000 pixels by 90,000 pixels that be full screen at low zoom, 0.02, or at detail at higher zoom, 0.25 to 1.0 using 3DMOD software, again a part of the IMOD program suite (Figure 5). In net, the software-driven analysis found that peripherally bound, thrombus-associated discoid platelets within the puncture hole were spaced apart as beads on a string. A short distance within the thrombus, the discoid shape was less distinct, and the platelets were more tightly associated with one another. Deeper within the thrombus, platelets were rounded, tightly packed, and partially degranulated. A sequence of morphology suggested the initial binding of platelets to the thrombus through a long tether molecule, likely von Willebrand factor, and that any further platelet activation steps were restricted to the interior of the forming thrombus. Hence, platelet recruitment to the thrombus could occur without disturbing the circulation of blood within the jugular vein.
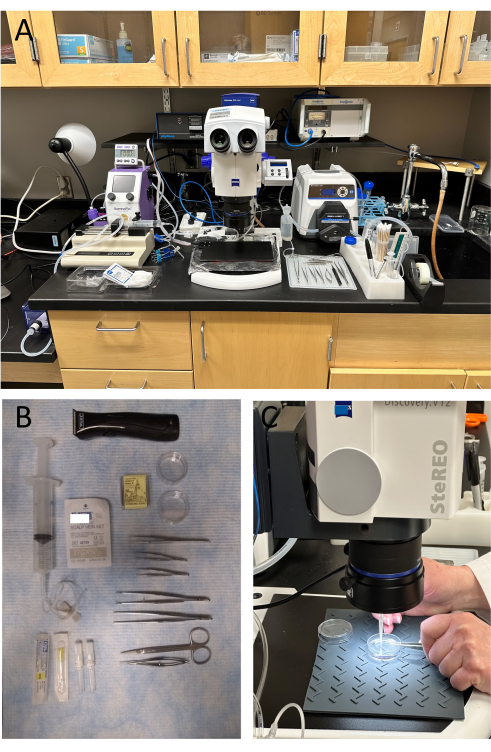
Figure 1: Surgical set-up to perform a jugular vein/femoral artery puncture wound thrombus experiment. Surgical equipment (A) and instruments (B) are carefully arranged for efficiency of movement since timing is critical during the experiment. (C) After perfusion fixation, the portion of the vessel containing the puncture wound thrombus is pinned to a silicone mat in a 35 mm culture dish while viewing under the light microscope. Please click here to view a larger version of this figure.
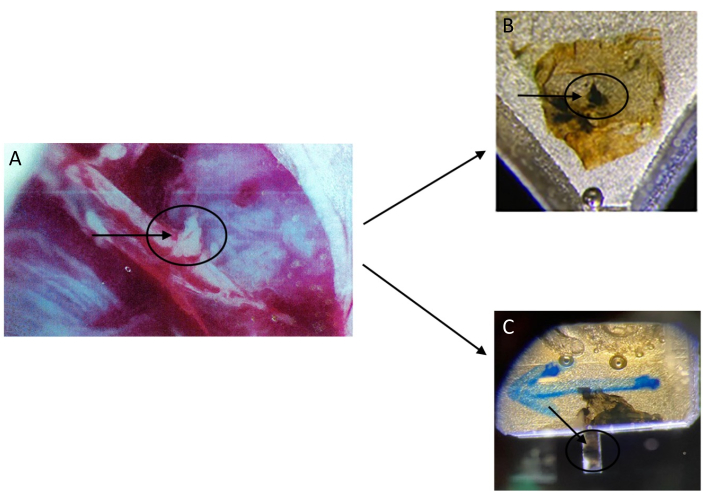
Figure 2: Going from a blood vessel to plastic embedded samples that will be sectioned for either WA-TEM or SBF-SEM. (A) A femoral artery with a puncture wound and accumulating extra-vascular thrombus formation (circle and arrow) is shown. (B) A thrombus (circle and arrow) is embedded in plastic for sectioning for WA-TEM with a microtome for subsequent 2D imaging. (C) A thrombus (circle and arrow) is embedded in plastic, trimmed to give a short stick, less than 1 mm, for attachment to a pin within an SBF-SEM imaging chamber. Please click here to view a larger version of this figure.
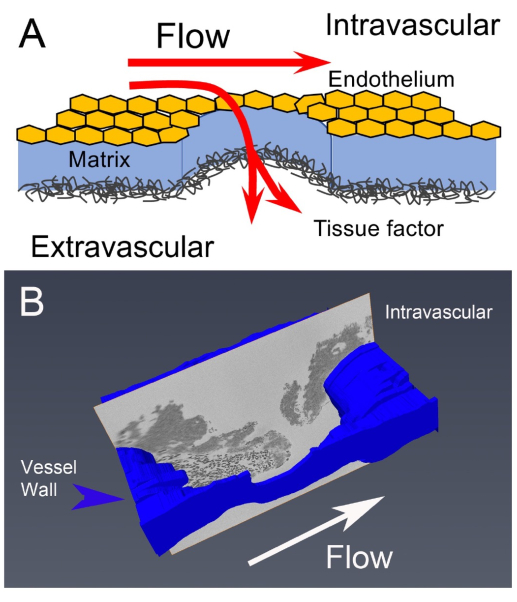
Figure 3: Puncture wound to thrombus formation: A schematic of preparative flow from a puncture wound (A) to an image slice of a 1 min post-puncture jugular vein thrombus (B). The vessel wall is labeled in blue on the image slice, the small black dots near the vessel wall are red blood cells, and the thrombus platelet aggregates appear as dark gray areas. This figure has been modified from1. Please click here to view a larger version of this figure.
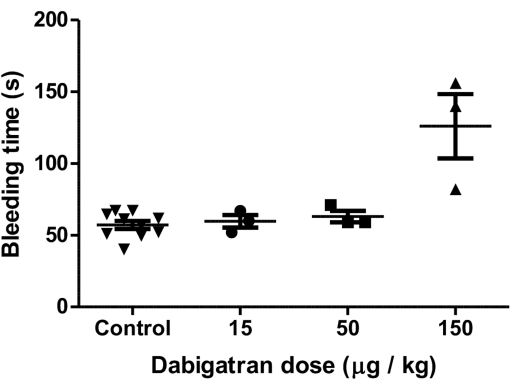
Figure 4: An example of data, in graphic form, generated in a jugular vein puncture wound experiment. A dabigatran dose-response bleeding curve is shown. This figure has been modified from1. The bleeding time means at various concentrations of dabigatran are shown along with error bars indicating plus or minus standard deviation. Statistical analysis using the student's t-test indicated a p-value of <0.05. Please click here to view a larger version of this figure.
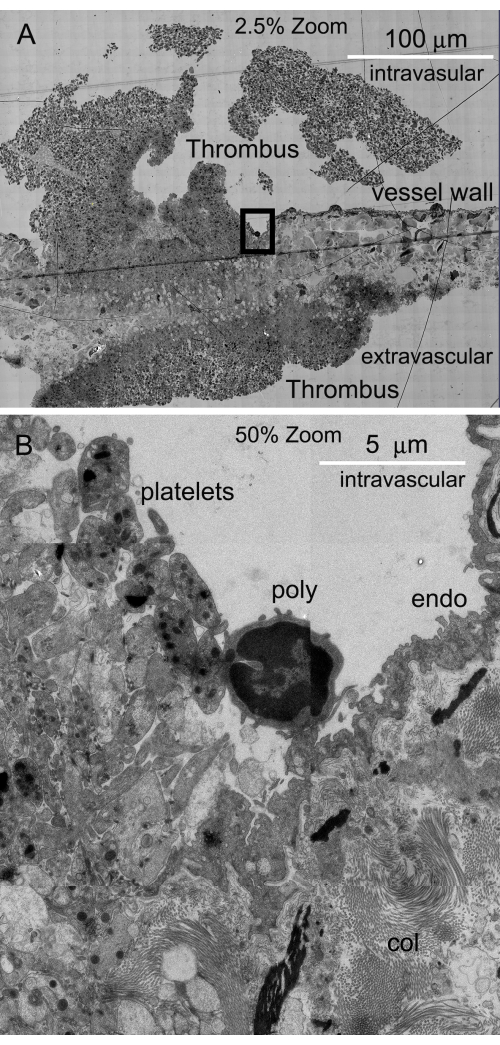
Figure 5: WA-TEM images of a slice stitched together to form a montage. (A) Individual high-resolution frames are collected and then stitched together for the purpose of placing features in a larger context. (B) By zooming up, important details can be brought out in context (poly: polymorphonuclear leukocyte, endo: endothelium, and col: collagen fibers). Please click here to view a larger version of this figure.
We present a detailed puncture wound procedure for producing hemostatic thrombi in jugular veins and femoral arteries, their in situ perfusion fixation, and sample processing for montaged wide-area transmission electron microscopy. The overall procedures are useful for generating hemostatic thrombi for ultrastructural analysis and for comparing bleeding times in experimental mice, for example, mice treated with different types and dosages of pharmaceuticals. It is also useful for comparing bleeding times in control wild-type mice to bleeding times in knockout mice (i.e., knockouts for various glycoproteins in platelets that interact with adhesive ligands) and subsequent high-resolution electron microscopy. The protocol can be readily adapted to immunofluorescence analysis as the primary readout with the loss of features that make electron microscopy a strong choice. On the other hand, immunofluorescence is a prime tool for locating proteins within a structure. As with any technical protocol, there are some steps that are more critical than others and there are steps within the protocol that can be treated as choice points important to subsequent analysis.
The critical steps, choice points for subsequent analysis, and limitations are described as follows. The actual needle puncture step: The puncture wound is made with a syringe needle held at an angle of 25° to the vein or artery. This minimizes the chance of puncturing across both sides of the vein or artery. A 90° angle on the other hand maximizes the chances of not scraping the intravascular endothelial layer or damaging the extravascular collagen matrix on the outside of the blood vessel but carries a greater risk of puncturing both sides of the vein or artery. The choice is one of experience, hands, and confidence.
The primary fixation here is done with perfused paraformaldehyde, a small molecule containing a single reactive aldehyde group. Because it contains a single chemically reactive group, paraformaldehyde has little tendency to cross-link cellular components and little tendency to destroy antigenicity and hence, in sum, is considered to be a comparatively weak fixative to glutaraldehyde, a common fixative for electron microscopy, which contains two reactive aldehydes and hence produces much more molecular cross-linking13. This is an in situ step designed to preserve the structure. The perfusion steps clear non-thrombi-trapped red blood cells from the preparation. That gives a preparation that is free of most red blood cells and makes it easy to focus on platelet properties. We have explored using in situ fixation with a glutaraldehyde/paraformaldehyde mix applied extravascularly. This procedure is effective, particularly in a high flow/pressure situation. However, it does fix circulating red blood cells in place. This can complicate subsequent segmentation analysis of electron micrographs for the shape and composition of the platelet aggregates forming the puncture wound thrombus. The use of glutaraldehyde greatly complicates alternative immunofluorescence procedures because of the high level of autofluorescence generated by the fixative.
The pinning/splaying of the fixed blood vessel out on a silicone pad is crucial to locating the thrombus for embedding purposes. In this step, the orientation of the sample with respect to blood flow is tracked and known for subsequent steps. The puncture hole and formed thrombus can be readily located in the open blood vessel. In contrast, the thrombus is difficult to find in excised, intact blood vessels. That would be especially true in a sample rich in fixed circulating red blood cells. Being able to track where the needle in the haystack is located is crucial.
Post-splaying the blood vessel open and photographing where the formed thrombus, puncture hole, is located presents a choice point. In the overall protocol, the presented subsequent steps are specific to preparing the sample for WA-TEM. At this step, other protocol choices could be made. On the one hand, the sample could be processed for immunofluorescence microscopy rather than electron microscopy. On the other hand, the sample could be processed for serial block face scanning electron microscopy (SBF-SEM or another volume electron microscopy approach) instead of WA-TEM. The processing steps for SBF-SEM are decidedly different because to prepare for this procedure, all heavy metal staining steps for electron microscopy must be done pre-embedding4.
The heavy metal staining steps in this protocol are designed to highlight membranes versus ribosomes and chromosomes, biological complexes rich in nucleic acid. Other heavy metal staining protocols could be used, for example, Storrie and Attardi14 and Liu et al.15.
Attention to differences in veins and arteries is important. The higher pressure of the artery versus the vein must be offset16,17. For example, a smaller diameter needle is used to produce the femoral artery wound versus the jugular wound. This compensates for the higher pressure, giving nearly equal bleeding cessation time. In the jugular vein puncture wound procedure, preference is given to using paraformaldehyde as a fixative under hypertonic conditions because paraformaldehyde, as a small, single aldehyde-containing fixative, acts rapidly but is a weak fixative that tends to leave antigenicity intact. That means that the protocols described here can be complemented by antibody-mediated localization studies at either the light or the electron microscope level18,19. In the case of the femoral artery puncture wound, glutaraldehyde, a stronger cross-linking fixative, is used in conjunction with paraformaldehyde in a 0.1 M sodium cacodylate buffer, pH 7.4, to stabilize and fix arterial thrombi. This modification is necessitated to offset the higher blood pressure of an artery versus a vein. In the arterial case, the sodium cacodylate concentration is half the concentration used in the fixative solution for jugular vein thrombi.
The sample processing procedure for electron microscopy presented here is tailored to WA-TEM and gives limited-volume electron microscopy information. WA-TEM produces a limited series of high-resolution images, 3.185 nm pixel size or smaller, across full thrombi cross sections either parallel or perpendicular to flow1. A combination of glass and diamond knives is used to manually produce a series of cross sections at an estimated 10%, 25%, 50%, 75%, and 90% into the thrombus. Achieving full thrombus cross sections requires imaging hundreds of frames with a 4,000 x 4,000 pixels electron microscope quality camera. The frames are then stitched together. Nearly 400 – 800 frames are required to achieve a full cross-section image. WA-TEM can be complemented by SBF-SEM. SBF-SEM produces a series of sequential images of the block face as it is progressively cut away in small steps with a diamond knife enclosed within the vacuum of the SEM imaging chamber1. These images can be put together to give a full 3-dimensional rendering of the forming thrombus. Because the microtome is inside the SEM imaging chamber, all staining steps for SBF-SEM must be done pre-embedding. The combination of these two electron microscope approaches allows one to image at ~3 nm or more resolution across a limited number of cross-sections, WA-TEM, or across the full depth of the near millimeter size puncture wound thrombus, SBF-SEM. Viewing the stitched WA-TEM images in 3DMOD software10 allows rapid manipulation between various zoom levels so that even high-resolution views can be placed in context within the full thrombus width cross-section.
In conclusion, we present a proven protocol for producing puncture wound thrombi in mice, fixing them in situ, and processing them for electron microscopy in a manner where the thrombus can be readily located within the vein or artery and its orientation with respect to blood flow traced. Various decision points are presented so the user can make choices as to how the samples will be analyzed. We focus on preparation for electron microscopy that highlights membranes versus other components in the cell. In the end, the portion of the protocol that is most general to other investigations is the appreciation by the authors that wide-area transmission electron microscopy (WA-TEM) is a montaging approach that supports nanoscale knowledge of cells, i.e., platelets within a large structure, near millimeter size, here the forming thrombus. The resulting ability to place detail within the overall context is the central strength of combining the various steps into a full procedure.
The authors have nothing to disclose.
The authors extend thanks to colleagues at the University of Arkansas for Medical Sciences (Jerry Ware and Sung W. Rhee), the University of Pennsylvania (Tim Stalker and Lawrence Brass), the University of Kentucky (Sidney W. Whiteheart and Smita Joshi), and the National Institute of Bioimaging and Bioengineering of the National Institutes of Health (Richard D. Leapman and Maria A. Aronova) from whom we have learned much. The authors express appreciation to the American Heart Association and the National Heart Lung and Blood Institute of the National Institutes of Health (R01 HL119393, R56 HL119393, R01 155519 to BS and subawards from NIH grants R01 HL146373 and R35 HL150818) for financial support.
0.9% Normal Saline Solution | Medline | BHL2F7123HH | |
27G x 3/4 EXELint scalp vein set | Medline | NDA26709 | |
30G x 1/2 EXELint hypodermic needles | Medline | NDA264372 | |
33G x 1/2 EXELint specialty hypodermic needles | Medline | NDA26393 | |
50 mL Conical Tubes | Fisher Scientific | 06-443-20 | |
Alcohol Prep Pads (70% Isopropyl Alcohol) | Medline | MDS090670Z | |
Aluminum Foil | Fisher Scientific | 01-213-100 | |
Animal Heating Plate | Physitemp Instruments | HP-1M | |
Araldite GY 502 | Electron Microscopy Sciences | 10900 | |
Axiocam 305 Color R2 Microscopy Camera | Carl Zeiss Microscopy | 426560-9031-000 | |
BD Luer-Lok Syringes, 20 mL | Medline | B-D303310Z | |
Calcium Chloride | Fisher Scientific | C79-500 | |
Cell Culture Dishes 35mm x 10mm | Corning Inc. | 430165 | |
Cotton Tipped Applicators | Medline | MDS202055H | |
DMP-30 Activator | Electron Microscopy Sciences | 13600 | |
Dodecenyl Succinic Anhydride/ DDSA | Electron Microscopy Sciences | 13700 | |
Dressing Forceps, 5", curved, serrated, narrow tipped | Integra Miltex | 6-100 | |
Dressing Forceps, 5", standard, serrated | Integra Miltex | 6-6 | |
EMBED 812 Resin | Electron Microscopy Sciences | 14900 | |
Ethyl Alcohol, anhydrous 200 proof | Electron Microscopy Sciences | 15055 | |
Fisherbrand 4-Way Tube Rack | Fisher Scientific | 03-448-17 | |
Fisherbrand Digital Timer | Fisher Scientific | 14-649-17 | |
Fisherbrand Single Syringe Infusion Pump | Fisher Scientific | 7801001 | |
Gauze Sponges 2" x 2"- 4 Ply | Medline | NON26224H | |
Glutaraldehyde (10% Solution) | Electron Microscopy Sciences | 16120 | |
Isoflurane Liquid Inhalant Anesthesia, 100 mL | Medline | 66794-017-10 | |
Jeweler-Style Micro-Fine Forceps, Style 5F | Integra Miltex | 17-305 | Need 2 pairs. |
L/S Pump Tubing, Silicone, L/S 15; 25 Ft | VWR | MFLX96410-15 | |
L-Aspartic Acid | Fisher Scientific | BP374-100 | |
Lead Nitrate | Fisher Scientific | L-62 | |
Malachite Green 4 | Electron Microscopy Sciences | 18100 | |
Masterflex L/S Easy-Load II Pump Head | VWR | MFLX77200-62 | |
Masterflex L/S Variable Speed Digital Drive | VWR | MFLX07528-10 | |
MSC Xcelite 5" Wire Cutters | Fisher Scientific | 50-191-9855 | |
Osmium Tetroxide 4% Aqueous Solution | Electron Microscopy Sciences | 19150 | |
Paraformaldehyde (16% Solution) | Electron Microscopy Sciences | 15710 | |
Physitemp Temperature Controller | Physitemp Instruments | TCAT-2LV | |
Potassium Ferrocyanide | Sigma-Aldrich | P-8131 | |
Propylene Oxide, ACS Reagent | Electron Microscopy Sciences | 20401 | |
Pyrex Glass Beakers | Fisher Scientific | 02-555-25B | |
Rectal Temperature Probe for Mice | Physitemp Instruments | RET-3 | |
Scotch Magic Invisible Tape, 3/4" x 1000" | 3M Company | 305289 | |
Sodium Cacodylate Buffer 0.2M, pH 7.4 | Electron Microscopy Sciences | 11623 | |
SomnoFlo Low Flow Electronic Vaporizer | Kent Scientific | SF-01 | |
SomnoFlo Starter Kit for Mice | Kent Scientific | SF-MSEKIT | |
Stainless Steel Minutien Pins | Fine Science Tools | 26002-10 | |
Stereomicroscope steREO Discovery.V12 | Carl Zeiss Microscopy | 495015-9880-010 | |
Sylgard 184 Silicone Elastomer | World Precision Instruments | SYLG184 | silicone mat |
Tannic Acid | Electron Microscopy Sciences | 21700 | |
Thiocarbohydrazide (TCH) | Sigma-Aldrich | 88535 | |
Uranyl Acetate | Electron Microscopy Sciences | 22400 | |
Vannas Spring Micro Scissors | Fine Science Tools | 15000-08 | |
Von Graefe Eye Dressing Forceps, 2.75", Curved, Serrated | Integra Miltex | 18-818 | Need 2 pairs. |
Wagner Scissors | Fine Science Tools | 14068-12 | |
Wahl MiniFigura Animal Trimmer | Braintree Scientific | CLP-9868 | |
Zen Lite Software | Carl Zeiss Microscopy | 410135-1001-000 |
.