Part 1: Preparing Drosophila for HRMAS Measurements
- Using standard flylab procedures 1, collect newly eclosing flies for 3 days and transfer them to fly vials containing fresh fly food. Incubate the collected flies for 5 days so that the flies will become 5-8 days old just prior to the experiment. Only one sex (usually males) is used for experiments.
- Use healthy, intact wild type flies to compare with treated e.g. traumatized or genetically altered flies 1.
- Place single flies into 2ml tubes containing a piece (~0.2ml) of fly food 24 hours prior to the experiment. These tubes bear a hole in the tube cup made using a flame-heated insulin needle.
- Weigh the tubes immediately before and after the fly insertion using a high precision balance and define each fly s weight by subtracting the first value from the latter. A single male fly weighs usually 0.7-1 mg.
Part 2: HRMAS Rotor Preparation.
- Place a single tube on ice for less than a minute to anesthetize the fly inside.
- Lay the fly on a layer of aluminum foil placed on ice and push the fly gently into the semispherical hollow space of the NMR rotor insert using a soft brush to ensure complete fly insertion while avoiding fly injury.
- Place the insert into the zirconium oxide (ZrO2) rotor tube (4 mm diameter, 50 μl) to locate the flies between the rotor insert and the bottom of the rotor (see figure1).
- Close the insert with a screw and cover it with parafilm (see figure1) to prevent the contact between the fly and the TSP standard solution (TSP: trimethylsilyl- propionic-2,2,3,3-d4 acid, Mw = 172, δ = 0.00 ppm, 50 mM in deuterated water-D2O, that function as a reference for both resonance chemical shift and quantification).
- Add 8 μl of TSP standard solution on top of the rotor insert. (see figure 1).
- Secure and tighten the whole set up in the rotors with a top cap (see figure 1).
Part 3: HRMAS Data Acquisition
- Introduce the rotor into the HRMAS probe and position it at the magic angle 54.7° (see figure 1).
- Set temperature at 4°C by a BTO-2000 unit in combination with the MAS pneumatic unit. Flies are kept at 4°C while in the spectrometer to maintain anesthesia.
- Set the HRMAS 1H MRS spinning rate at 2 kHz MAS.
- Stabilize the MAS rotation frequency at 2.0 ± 0.001 kHz by a MAS speed controller (Rotation frequency).
- For magnet preparation: tune and match the coil for optimum performance and shim the magnet for optimal quality of spectra.
- Acquire one dimensional 1H spectra using rotor synchronized Carr-Purcell-Meiboom-Gill (CPMG) spin echo pulse sequence 2, [90°-(τ-180°- τ)n-acquisition], which works as a T2 filter to remove the spectral broadening 1H NMR single-fly spectra to acquired one-dimensional data on all samples. Synchronize the inter-pulse delay (τ = 500μs) to the MAS rotation frequency (2 kHz). Set the number of transients at 256 with 32,768 (32k) data points. Acquisition time 9 min.
- Acquire two-dimensional (2D) 1H-1H HRMAS NMR single-fly spectra on all samples using a TOBSY sequence with adiabatic pulses 3. Acquisition parameters are: 2k data points direct dimension (11 ppm spectral width), 1 s water pre-saturation during the relaxation delay, 8 scans per increment, 128 increments, 2 s total repetition time, 45 ms mixing time, and a total acquisition time of 29 min.
Part 4: Data Processing/Analysis
- Analyze the MRspectra of specimens using MestReC software (Mestrelab Research, www.mestrec.com)
- Use a line-broadening apodization function of 0.5 Hz and apply to all HRMAS 1H FIDs prior to Fourier transformation.
- Reference the MR spectra with respect to TSP at δ = 0.0 ppm (external standard).
- Phase spectra manually and apply a Whittaker baseline estimator to subtract the broad components of the baseline prior to peak area calculations.
- Estimate peak areas using MestReC software. Scale peak heights with respect to TSP for each acquired spectrum (TSP peak height = 1). Use t-tests (two-tailed, p<0.05) to compare within-group to between-groups ratios.
- 2D TOBSY process parameters are: QSINE = 2 window function in both dimensions, FT with 2k points in the direct dimension and zero-filling to 1k in the second dimension, phase correction in both dimensions and baseline correction in the second dimension.
- Produce the 2D spectra using Sparky program (T. D. Goddard and D. G. Kneller, SPARKY 3, USCF, http://www.cgl.ucsf.edu/home/sparky/)
Part 5: Representative Spectra from Live Drosophila melanogaster Flies
The procedures described above permit to collect reproducible spectra from live Drosophila melanogaster flies. Figures 2 and 3 show representative MR spectra acquired in wild-type (wt) Oregon-R flies. Figure 2 presents 1D 1H HRMAS CPMG spectra. Principal lipid components [CH3 (0.89 ppm), (CH2)n (1.33 ppm), CH2C-CO (1.58ppm), CH2C=C (2.02 ppm), CH2C=O (2.24 ppm), CH=CH (5.33 ppm)], glycerol (1,3-CH 4.10 ppm and 4.30 ppm; 2-CH2 5.24 ppm), and small metabolites: β-Alanine (β-Ala, 2.57 ppm), acetate (Ac, 1.97 ppm), phosphocholine (PC, 3.22 ppm) and phophoetanolamine (PE, 3.23ppm) were detected and assigned in accordance with prior reports 4, 5. Signals at 2.02 ppm were assigned to methylene protons of the CH2-CH=CH moiety of mono-unsaturated fatty acids (i.e. palmitoleic). The unsaturated acids were identified by a signal at 5.33 ppm produced by protons of the -CH=CH- moiety. Small metabolites that could not be assigned or were not visible using the 1D spectrum were detected using 2D 1H-1H TOBSY HRMAS (see figure 3).
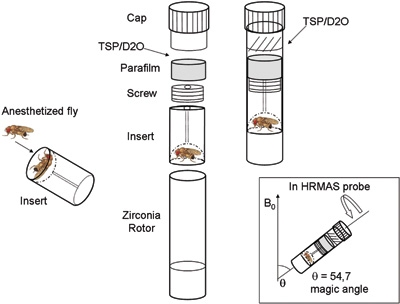
Figure 1. Experimental set up of in vivo HRMAS 1H MRS for the investigation of live Drosophila at 14.1 T. External standard trimethylsilyl- propionic-2,2,3,3-d4 acid in deuterated water (TSP/D2O). In the square: rotor position at the magic angle in HRMAS probe.
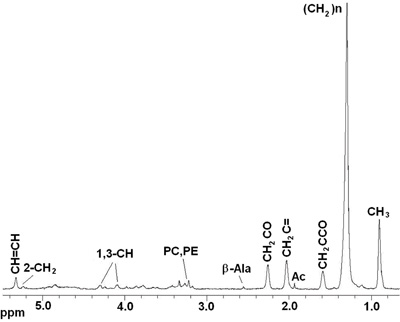
Figure 2. In vivo 1D HRMAS 1H CPMG spectra of a live Drosophila melanogaster wt fly. Lipid components: CH3 (0.89 ppm), (CH2)n (1.33 ppm), CH2C-CO (1.58ppm), Acetate (Ac), CH2C=C (2.02 ppm), CH2C=O (2.24 ppm), β-Alanine (β-Ala), phosphocholine (PC) and phophoetanolamine (PE), Glycerol (1,3-CH 4.10, 4.30 ppm; 2-CH2 5.22 ppm), CH=CH (5.33 ppm).
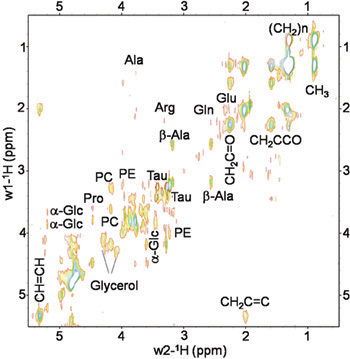
Figure 3. In vivo 2D 1H-1H TOBSY HRMAS spectrum of a live Drosophila melanogaster wt fly at 14.1 T. Small metabolites and lipid components were identified. Metabolites: alanine (Ala), β-Alanine (β-Ala), arginine (Arg), glutamine (Gln), glutamate (Glu), PC phosphocholine (PC), phophoetanolamine (PE), Taurine (Tau), α-Glucose (α-Glc) and Glycerol. Lipids components: CH3 (0.89 ppm), (CH2)n (1.33 ppm), CH2C-CO (1.58 ppm), CH2C=C (2.02 ppm), CH2C=O (2.24 ppm), CH=CH (5.33 ppm).
