Surgical Procedure
- Obtain 8 week-old male C57BL/6 mice and acclimate for one week before any experimental procedures are performed.
- Prior to imaging, pulmonary artery occlusion is performed as described previously14 in accordance with AVMA guidelines and approved IACUC protocols.
Echocardiographic Images Acquisition and Measurements
All abbreviations used are summarized in Table 1.
1. Parasternal Long Axis (PLAX) M Mode View to Obtain RV Chamber Dimension, Fractional Shortening (FS), and RV Wall Thickness
- Use B Mode setting to obtain a full LV parasternal long axis view. With the animal lying in a supine position on the platform (see Note 6.1. and 6.2.), position the 40 MHz ultrasound probe (MS550D) on the animal with about 30° angle counterclockwise to the left parasternal line with the notch pointing caudal direction (Figure 1A). Adjust the probe angle by tilting slightly along y-axis of the probe (Figure 1D) to obtain a full LV chamber view in the center of the screen.
- Once the proper landmarks (RV, LV, MV, Ao, LA) as illustrated in Figures 2A and 2B are clearly visualized, switch to M Mode. An indicator line will show up on the screen in the M Mode setting. The line should be positioned to go through the widest portion of RV chamber using Ao as landmark (Figures 2A and B).
- In this view, the RV wall and IVS should be clearly visible. Please ensure that the focus depth lies in the center of RV chamber. Record the data with cine store for measurement RV chamber dimension, FS and RV wall thickness off line. Examples of M Mode images are shown in Figures 2C and 2D. (See Note 6.3.)
2. Parasternal Short-axis View at Mid Papillary Level to Obtain Fractional Area Changes (FAC)
- From the position described above (Figure 1A), switch to B Mode and turn the probe 90° clockwise to obtain the parasternal short-axis view (Figure 1B). Tip the probe slightly along the x-axis of the probe to prevent the obstructive view of the sternum.
- Move slightly up and down along the y-axis of the probe to obtain the mid papillary level (See Note 6.4.)
- In this view, the papillary muscles are typically located at the 2 and 5 o'clock position (Figure 3).
3. Parasternal Short-axis View at Aortic Valve Level (RV PSAX Aortic Level) to Obtain RV Wall Thickness and PA Peak Velocity
- From the position described above (Figure 1B), move the probe at the y-axis toward cranium until the aortic valve cross section shows in the middle of the window.
- Right ventricular outflow tract (RVOT) should be visible on the top as a crescent-shaped structure with tricuspid valve separating the RV from RA as illustrated in Figures 4A and 2B. Record the data using cine store for the measurement of RV wall thickness off line. (See Note 6.5.)
- Remain at the same position. (See Note 6.6.)
- Switch to Color Doppler Mode and position the yellow PW- dashed line parallel to the direction of flow in the vessel. Note that blue and red colors indicate flow away from and toward the probe, respectively (Figures 4C and 4D).
- Place the PW cursor at the tip of the pulmonary valve leaflets. (See Note 6.7.) Record data using cine store. Measure PA peak velocity off line.
4. Modified Parasternal Long-axis View of RV and PA to Obtain PA Peak Velocity
- Continue on B Mode setting, position the probe (MS550D or MS250) to right parasternal line (Figure 1C) and slowly title the probe about 30-45° angle on the y-axis of the probe (Figure 1D) toward the chest of the mice to clearly visualize the PA crossing over aorta as illustrated in Figures 5A and 5B.
- Switch to Color Doppler Mode and position the yellow PW- dashed line parallel to the direction of flow in the vessel (Figures 5C and 5D). Place the PW cursor at the tip of the pulmonary valve leaflets. (See Note 6.6.) Record data using cine store and measure PA peak velocity off line.
5. Data Calculation and Analysis
- RV wall thickness can be calculated from the B Mode data obtained from RV PSAX aortic level as described above (Protocol 3). Select the 2D area tracing tool to trace the area of the RV wall at diastole (as shown in pink area in Figure 6). Then, use the distance tracing tool to trace the inner and outer circumferences of the wall of RVOT (as shown in blue lines in Figure 6). Take the average of inner and outer circumferences. Using the equation
 , we calculate RV Wall (RVW) thickness. (See Note 6.8.)
 - For other standard parameters, please refer to the manuals from the respective manufactures to perform data analysis.
6. Notes
- All images are collected using the Vevo 2100 system. Similar images may be obtained using ultrasound imaging systems from other manufacturers, and the relative pros and cons of various ultrasound instruments have been previously compared8,12,15. It is recommended that all images should be obtained and analyzed in a blinded fashion whenever possible.
- The proper choice of anesthesia, such as a short duration of inhaled isoflurane (2-3% to induce, and 1.0% to maintain) is crucial in the maintenance of heart beat at normal physiological rates (above 500 beats/min), allowing us to detect reproducible and consistent basal and elevated pulmonary arterial systolic pressure in the study.
- Make sure to collect the data at the highest possible frame rate possible (>200 frames/sec).
- Look for the view with the largest chamber dimension.
- Obstruction due to ribs and the sternum largely due to the RV’s retrosternal position is the single biggest impediment to obtaining excellent images in this method of imaging the RV. By repositioning the animal or the probe, an operator can overcome the sternal block and obtain necessary views of the RV. This may take from 5-15 min, depending on the animal’s physiology.
- You may need to switch probe to MS250 since MS550D probe can be used in sham and mice before PAC and the 40 MHz probe is capable to record peak velocity of 300-1,500 m/sec, whereas MS250 is able to capture the park velocity up to 4,000 mm/sec.
- It is acceptable to have a probe angle less than 20° for accurate measurement of PA peak velocity.
- Consistent measurements of RV wall thickness and area/dimensions were made using multiple acoustic windows, in both the long- and short-axis. The choice of some of these windows will depend on the experience of the operator, and could account for variability that could be contributory to different statistical results.
In this study, baseline echocardiography was performed 48 hr prior to surgery. Mice were randomized into two groups. Mice received pulmonary artery occlusions (PAC) and sham operations (Sham). Echocardiography was performed at day 0, 3, and 7 following surgical procedure. The animals were euthanized immediately following the last echocardiography and hearts were harvested for histological assessment. Catheterization was conducted in subgroup (n=3 and 2 for day 0 and 7, respectively) of PAC mice to measure RVSP via pressure catheter.
All imaging data obtained was analyzed off line. Importantly, sonographers were blinded to the procedures that the animals underwent. The images presented in this study were taken by two independent imagers. The inter- and intra- observer variability was tested, and found to be less than 6 % and 11%, respectively. The measurements were obtained using all available acoustic windows- B Mode, M Mode and Color Doppler images taken together were used in assessment of RV structure and function. All measurements were averaged over 5 cardiac cycles. For each measurement, the mean value and standard deviation (SD) was obtained. Often similar measurements were performed from different imaging windows to obtain complementary information and multiple data-points for comparison of accuracy and reliability.
As shown in Figures 7A and 7B, systolic function of RV can be measured in PLAX view as %FS or in mid papillary muscle view as %FAC, respectively. While the decrease in FAC was already significant at day 0, the decrease in FS was only significant at day 7 (n=6, P<0.01). One major caveat of this view is that because of the retrosternal position of RV and occasionally due to the obstruction posed by the ribs, much care should be taken to obtain the RV image to accurately demonstrate the maximum diameter of the right ventricle without foreshortening the image. Small variations in RV diameter can mask small but significant changes in function. In contrast, %FAC is markedly decreased following PAC, even at day 0 right after the PA occlusion (n=6, P< 0.05) and decreased progressively overtime (n=6, P< 0.001). Thus, %FAC should be used as a primary measure of RV function and %FS as a secondary measure. It is noteworthy that %FAC has been shown to be a reliable predictor of heart failure, sudden death, stroke and/or mortality3,4,10,16.
The RV dilatation can be measured in the long- and short-axis as RV chamber dimension (RVIDd) and RV area in diastole (Figures 7C and 7D). The reliability of echo derived RVIDd in small rodents is indeed not as dependable as those measures in humans. This represents an important caveat in measuring RVID in mice. In small animals, the RVID is more clearly visualized in the long axis view, rather than the apical four-chamber view, as is commonly done in humans. Importantly, though, the endocardial definition of the anterior wall is often suboptimal under the long axis view and oblique imaging may underestimate size measures. We find that RV area measure in the mid papillary muscle view is a more reproducible and reliable surrogate for RV chamber dimension and RV dilatation in mice.
RV free wall thickness, as a marker of RV hypertrophy, can be determined accurately either using M Mode or the area-trace method (Figures 7E and 7F). Similarly, the PA peak velocity can also be obtained with either at PLAX or SAX mode (Figures 7G and 7H, respectively). Reliable measurements of PA peak velocity and thus, peak-pressure gradient within the PA can be obtained using Color Doppler in both short- and long- axis acoustic windows (Figures 7G and 7H). It should be noted that these velocity measurements are angle dependent and hence, it is recommended to obtain velocities using multiple views and with similar sweep speed for all tracings (greater than 100 mm/sec).
Lastly, Figure 8 shows that in noninvasive echocardiography is a viable alternative to the terminal right heart catheterization method used as the gold standard for RVSP measurement9. For the 5 animals, catheterization for comparison of RVSP measurement methods was performed, and calculations of pressure were highly comparable (Pearson correlation coefficient r=0.943, P>0.05). In echocardiography, the PA peak velocity is measured reliably, and it follows that the calculation from the PA peak velocity is also reproducible. Additionally, this method allows for serial measurement of the pulmonary pressure gradient over time.
In summary, the noninvasive echo-based imaging can be a useful tool to follow RV structural and functional remodeling longitudinally similar to what has been commonly used in LV.
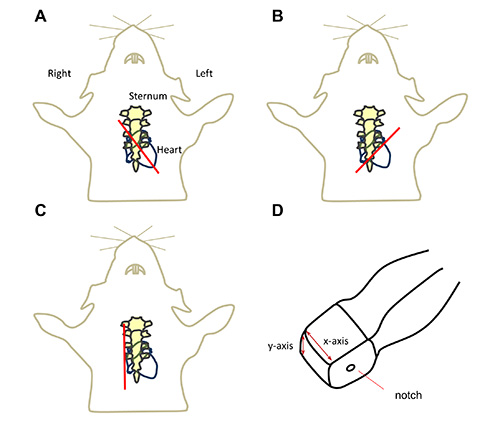
Figure 1. Graphical illustrations of the imaging probe position. Red line indicating the position of the probe for obtaining A, parasternal long axis B, parasternal short axis, C, modified parasternal long-axis view and D, the x-y direction of the probe. Click here to view larger image.
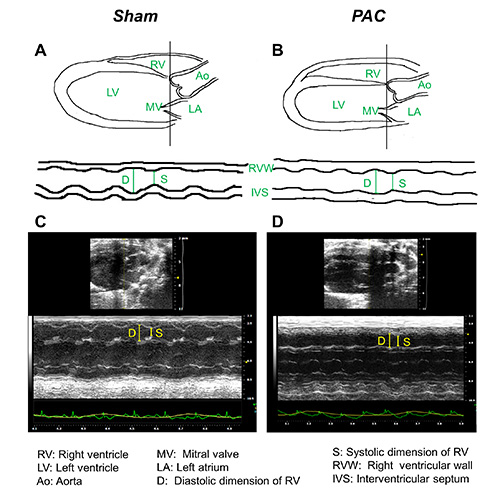
Figure 2. Parasternal long axis (PLAX) view. Graphical illustration and representative PLAX images from A, sham and B, PAC mouse heart. Key landmarks seen in the view areas follows. 1: Right ventricle (RV), 2: Left ventricle (LV), 3: Aorta (Ao), 4: Mitral valve (MV), 5: Left atrium (LA), 6: Diastolic dimension of right ventricle (D), 7: Systolic dimension of right ventricle (S), 8: Right ventricular wall (RVW), 9: Interventricular septum (IVS). Click here to view larger image.
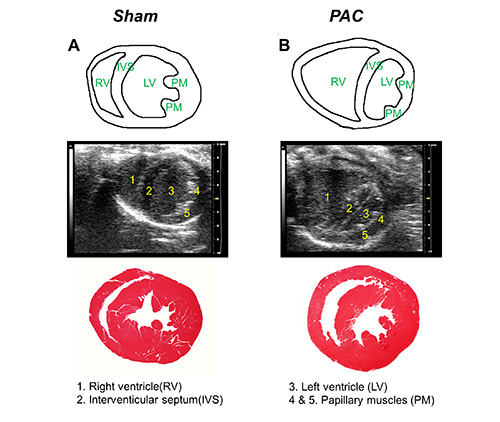
Figure 3. Parasternal short-axis view (PSAX) at mid-pap level of right ventricle (RV). Graphic illustration, representative image in PSAX at mid-papillary muscle level and H&E staining from A, sham and B, PAC mouse heart. Key landmarks seen in the view are as follows. 1: right ventricle (RV), 2: interventricular septum (IVS), 3: left ventricle (LV), and 4 & 5: papillary muscles. Click here to view larger image.
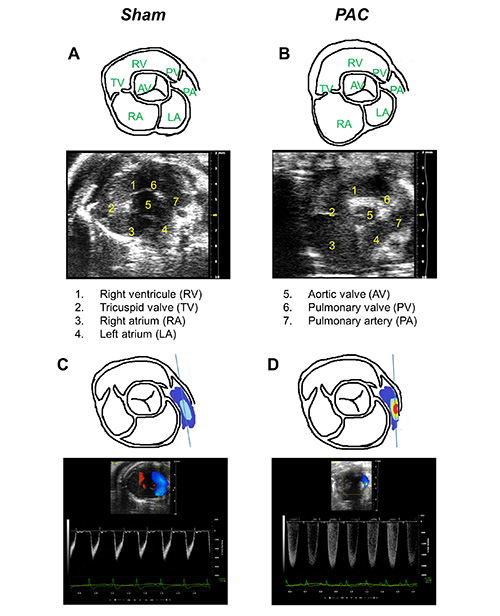
Figure 4. Parasternal short-axis view (PSAX) at aortic-level. Graphic illustration and representative B Mode images from A, sham and B, PAC mouse heart. Graphic illustration and Color Doppler images from C, sham and D, PAC mouse heart. Key landmarks seen in the view are as follows. 1: Right ventricular outflow tract (RVOT), 2: Tricuspid valve (TV), 3: Right atrium (RA), 4: Left atrium (LA), 5: Aortic valve (AV), 6: Pulmonary valve (PV), and 7: Pulmonary artery (PA). Click here to view larger image.
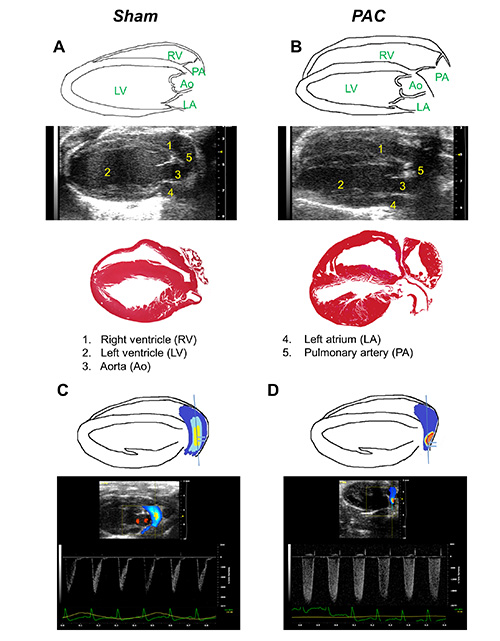
Figure 5. Modified parasternal long-axis (PLAX) view of right ventricle (RV) and pulmonary artery (PA).Graphical illustration, representative modified PLAX images, and H&E histology from A, sham and B, PAC mouse heart. Graphic illustration and Color Doppler images from C, sham and D, PAC mouse heart. Key landmarks seen in the view areas follows. 1: Right ventricle (RV), 2: Left ventricle (LV), 3: Aorta (Ao), 4: Left atrium (LA), and 5: Pulmonary artery (PA). Click here to view larger image.
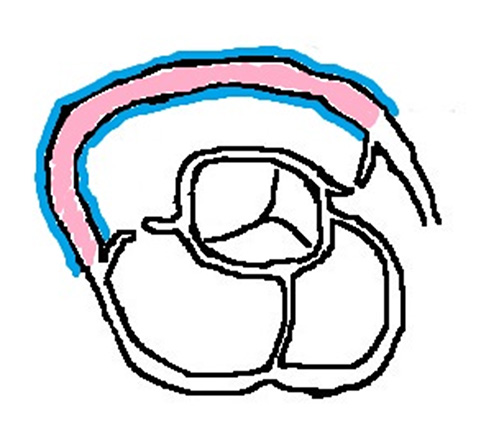
Figure 6. RV wall-thickness from Parasternal short-axis view (PSAX) at aortic level view. Graphical illustration of PSAX-image of heart section at aortic-level. Measurement of RV wall thickness can be derived from the area/length. Pink shade indicates area of RV free wall and blue line indicates inner and outer circumferences of RV.
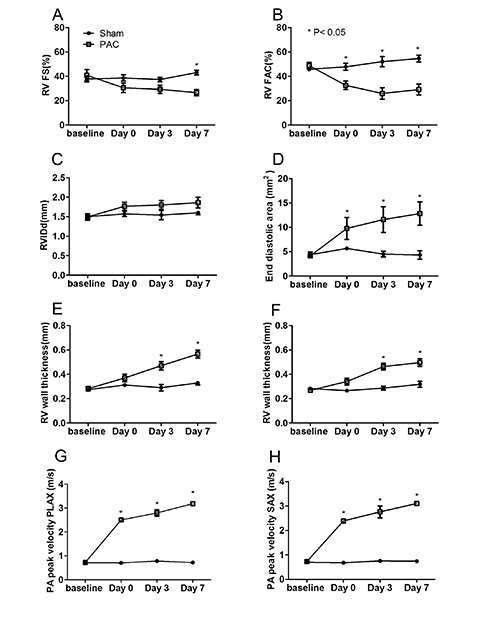
Figure 7. Structural and functional assessments of right ventricle (RV). A, Fractional shortening (FS) obtained using M mode at PLAX. B, Fractional area changes (FAC) obtained using PSAX at mid pap level. C, Right ventricular chamber dimension in diastole (RVIDd) obtained using M mode at PLAX. D, End diastolic right ventricular area obtained using PSAX at mid pap level. E, Right ventricular wall thickness at diastole obtained using M mode at PLAX and F, PSAX at aortic level. Pulmonary artery peak velocity obtained at G, modified PLAX at RV and PA view and H, PSAX at aortic level. Sham, n=6 and PAC, n=6, *, p<0.05. Click here to view larger image.
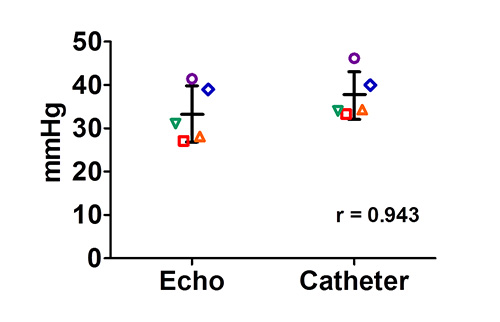
Figure 8. Correlation of pulmonary artery (PA) pressure measured using echocardiography (ECHO) and Millar microtip pressure catheter (Catheter). For echocardiography, peak-pressure gradient were calculated from PA peak velocities using modified Bernoulli’s equation. The peak-pressure gradients (measured at site of constriction) were consistent with RVSP via catheterization with a correlation coefficient 0.943 (n=5).
| Full name | Abbreviation |
| Left atrium | LA |
| Left ventricle | LV |
| Right atrium | RA |
| Right ventricle | RV |
| Aorta | Ao |
| Pulmonary artery | PA |
| Aortic valve | AV |
| Mitral valve | MV |
| Tricuspid valve | TV |
| Pulmonary valve | PV |
| Interventricular septum | IVS |
| Papillary muscle | PM |
| Fractional shortening | FS |
| Fractional area change | FAC |
| Parasternal long axis view | PLAX |
| Parasternal short axis view | PSAX |
| Transthoracic echocardiography | TTE |
| Pulmonary artery constriction | PAC |
| Right ventricular systolic pressure | RVSP |
| Pulmonary arterial hypertension | PAH |
| Right Ventricular outflow tract | RVOT |
| Right ventricular internal dimension in diastole | RVIDd |
Table 1.
