Methods to Classify Cytoplasmic Foci as Mammalian Stress Granules
Summary
Stress Granules (SGs) are nonmembranous cytoplasmic structures that form in cells exposed to a variety of stresses. SGs contain mRNAs, RNA-binding proteins, small ribosomal subunits, translation-related factors, and various cell signaling proteins. This protocol describes a workflow that uses several experimental approaches to detect, characterize, and quantify bona fide SGs.
Abstract
Cells are often challenged by sudden environmental changes. Stress Granules (SGs), cytoplasmic ribonucleoprotein complexes that form in cells exposed to stress conditions, are implicated in various aspects of cell metabolism and survival. SGs modulate cellular signaling pathways, post-transcriptional gene expression, and stress response programs. The formation of these mRNA-containing granules is directly connected to cellular translation. SG assembly is triggered by inhibited translation initiation, and SG disassembly is promoted by translation activation or by inhibited translation elongation. This relationship is further highlighted by SG composition. Core SG components are stalled translation pre-initiation complexes, mRNA, and selected RNA-binding Proteins (RBPs). The purpose of SG assembly is to conserve cellular energy by sequestering translationally stalled housekeeping mRNAs, allowing for the enhanced translation of stress-responsive proteins. In addition to the core constituents, such as stalled translation preinitiation complexes, SGs contain a plethora of other proteins and signaling molecules. Defects in SG formation can impair cellular adaptation to stress and can thus promote cell death. SGs and similar RNA-containing granules have been linked to a number of human diseases, including neurodegenerative disorders and cancer, leading to the recent interest in classifying and defining RNA granule subtypes. This protocol describes assays to characterize and quantify mammalian SGs.
Introduction
Cells employ many mechanisms to respond to stress. Some responses occur at the post-transcriptional level and involve regulating mRNA translation and/or stability1,2. Stress-modulated mRNA translational arrest and degradation are associated with the formation of specific nonmembranous cellular foci, the most well characterized being Stress Granules (SGs)3. SGs are cytoplasmic foci that concentrate nontranslating mRNPs in translationally-arrested cells responding to stress (e.g., oxidation, heat shock, nutrient starvation, and viral infection)4. In addition to nontranslating mRNAs, SGs contain translation initiation factors, RNA-binding proteins, and various signaling proteins5. SGs are biomarkers of inhibited protein translation and altered RNA metabolism and have been linked to cell survival and apoptosis, signaling pathways, and nuclear processes5.
SGs are dynamic entities, and their formation is tightly connected to the status of cellular translation6. Despite their seemingly solid appearance, most SG protein components rapidly shuttle in and out, with a residence time of seconds. While SGs persist for minutes to hours, most of their components are in rapid flux. The inhibition of translation initiation and the consequent disassembly of translating polysomes promote the formation of SGs; thus, SGs are in equilibrium with translating polysomes. This polysome/SG equilibrium is key to distinguishing bona fide SGs from other stress-induced foci6,7.
Arresting translation initiation entails the conversion of translation-competent pre-initiation complexes that contain mRNA, translation initiation factors (eIF), and 40S ribosomal subunits (so-called 48S complexes) into translationally stalled complexes (so-called 48S* complexes) that can coalesce into SGs4,6. SGs are promoted by translational arrest at two different steps upstream of 48S complex formation: interference with the functions of the cap-binding eIF4F complex (e.g., targeting its eIF4A subunit) or phosphorylation of the α subunit of translation initiation factor eIF2, mediated by one or more of the four eIF2 kinases. The presence of stalled 48S complexes (i.e. 40S ribosomal subunits and selected translation initiation factors) is a hallmark of SGs8,9.
SGs have been linked to various pathological states, such as viral infections, neurodegeneration, autoimmunity, and cancer3,10,11,12,13. Mutated forms of several SG components are associated with neurodegenerative diseases (e.g., amyotrophic lateral sclerosis) in which neurons display intracellular pathological inclusions that may play active roles in neuronal death13. Some viruses hijack SG components to inhibit SG formation and to enhance viral replication14. Recent studies also link SGs to cancer15 and to cancer cell survival under chemo- and radiotherapy treatments10,16,17,18,19,20. While such findings have stimulated great interest in SG biology, many of the published reports lack important controls to distinguish the formation of bona fide SGs from other stress-induced foci.
SGs were initially described as nonmembranous cytoplasmic foci composed of selected mRNA-binding Proteins (RBPs), including T-cell ntracellular antigen 1 (TIA-1) and Poly-A-binding Protein (PABP); translation initiation factors; polyadenylated mRNA; and small ribosomal subunits4,6,21,22. Traditionally, their composition has been determined by techniques such as immunostaining and the ectopic expression of fluorescently tagged proteins23,24. Due to their highly dynamic nature, the immunolocalization of SG proteins and/or mRNAs remains the defining methodology for detecting SGs23,24. To date, many RBPs and other proteins (over 120 distinct proteins) are described as SG components11. As many SG-localized proteins change their localization in both a stress-dependent and an independent manner and can accumulate at other intracellular compartments and foci, it is important to choose correct SG markers and to employ functional criteria to distinguish SGs from other types of stress-induced foci. Bona fide SGs contain mRNA, translation initiation factors, and small ribosomal subunits and are in dynamic equilibrium with translation.
This simple workflow is designed to determine whether stress-induced foci are bona fide SGs. This workflow includes several experimental approaches using U2OS cells, cells commonly used to study SGs. These cells are ideal, as they have a large cytoplasm, are relatively flat, and attach strongly to glass coverslips. Other cell types can be used to study SGs, but it is important to be aware that differences in timing, drug concentration, and abundance of SG-nucleating proteins can alter the kinetics and composition. Additionally, some cells respond to paraformaldehyde fixation by forming cell surface blebs, giving then a ruffled appearance that causes the punctate localization of some SG markers; without careful analysis, these can be misclassified as SGs. This highlights the necessity of assessing all criteria required to identify stress-induced foci as bona fide SGs. Vinorelbine (VRB), a cancer therapeutic that promotes SGs20, as well as Sodium Arsenite (SA), a robust and well-characterized SG inducer, are used as stresses for the experiments in this protocol.
Canonical SGs contain multiple SG markers (both proteins and mRNAs) that colocalize in cytoplasmic foci. This protocol uses both immunofluorescence and fluorescence in situ hybridization (FISH) to detect the localization of protein markers and polyadenylated mRNA22, respectively. Briefly, indirect immunofluorescence uses antibodies (i.e. primary antibodies) specific for a given protein to detect it within the cell. Then, secondary antibodies (usually species-specific) attached to fluorochromes recognize the primary antibody and reveal the target protein localization. Fluorescent microscopy is used to detect the localized signal within the cell. Using antibodies produced in different species and detecting them with differently colored secondary antibodies allows for the detection of the colocalization of multiple antibodies, indicating that their protein targets are found in the same location23. It is important to select markers that have been verified to colocalize at bona fide SGs.
FISH uses a labeled probe that base-pairs to a specific RNA or DNA sequence25. To detect mRNA, this protocol uses a biotinylated oligo(dT)40 probe that hybridizes (or base-pairs) to the polyA tail of mRNA (i.e. polyA FISH). The biotinylated probe is then detected using fluorescently conjugated streptavidin, as streptavidin has a high affinity for biotin. When assessing SGs, it is important to couple polyA FISH with immunofluorescence detecting an SG marker, as in bona fide SGs, the two signals should colocalize.
Using this protocol, colocalization is assessed in multiple ways. In a multi-channel (i.e. RGB: red, green, and blue) image, colocalization will alter the color of the overlapped signal (e.g. colocalized red and green appear yellow)23. Additionally, colocalization is quantified graphically using line scan analysis, where the intensity of each of color is measured across a given line8,20. This protocol describes two line scan analysis procedures using ImageJ26. One procedure is manual and goes through the entire process, while the other uses a macro, or a simple program that automates the manual steps. It is important to go through the manual program to understand the macro procedure.
SGs form in cells where translation is repressed; therefore, cells with SGs should display decreased levels of global translation compared to untreated cells. Experimentally, ribopuromycylation is used. Puromycin and emetine are added to cells for a short duration prior to fixation, allowing the puromycin to incorporate into actively forming polypeptides, causing termination27,28. Treatment with emetine is required to prevent re-initiation29. Puromycin can then be detected using anti-puromycin antibody, giving a snapshot of active translation. This method is used because it is quick, does not require pre-starving with a medium lacking a particular amino acid (and potentially prestressing the cells), and reveals the subcellular localization of protein translation. Other methods, notably using modified amino acid analogs, such as the methionine analog L-azidohomoalaine (AHA), coupled with "click-it" chemistry30, have been used to show that cells containing SGs exhibit much lower translation than neighboring cells31. However, this technique requires methionine starvation followed by pulse-labeling for 15-30 min. Methionine starvation constitutes an additional stress, while the long labeling time (i.e. 15-30 min) results in the measurement of cumulative rather than ongoing translation and also allows the newly-synthesized proteins to move from their site of synthesis to their final destination within the cell. In contrast, ribopuromycylation is much faster and is compatible with any medium, such as the glucose-free medium used to induce SGs via glucose starvation.
Canonical SGs are in dynamic equilibrium with actively translating polysomes. This can be assessed experimentally by treating samples with the drugs that stabilize or destabilize polysomes, thus tipping the balance between SGs and polysomes23. Cycloheximide (or emetine, which behaves similarly) blocks elongation by "freezing" ribosomes onto mRNA, thus decreasing the pool of available non-polysomal mRNPs able to form SGs. Experimentally, this can be used in two ways: by adding cycloheximide (or emetine) before stress to prevent SG formation or by adding cycloheximide (or emetine) after the SGs have formed, even without removing the stressing agent, causing SG disassembly, as stalled preinitiation complexes are slowly admitted into the polysome fraction. In contrast, puromycin causes premature termination and promotes polysome disassembly, increasing the pool of initiating mRNAs capable of assembling into SGs. Experimentally, puromycin treatment increases the number of SGs or lowers the threshold at which they form in response to graded stress or drug dosage. When assessing the effect of puromycin, it is important to use a sub-maximal level of the drug of interest, as puromycin is expected to augment the effect of the drug and to increase the percent of cells displaying SGs – this cannot occur if the drug/stress causes SGs in 100% of the cells initially. This contrasts with cycloheximide treatment, which disassembles SGs and works best when ~95% of the cells initially display SGs so that the largest possible decrease can be observed and accurately quantified.
This protocol provides a framework to study SGs in mammalian cells. Methods include: (1) immunofluorescent staining and ImageJ analysis to assess the colocalization the classic SG-associated markers eIF4G, eIF3b, and Ras GTPase-activating protein-binding protein 1 (G3BP1) in putative SGs; (2) oligo(dT) fluorescence in situ hybridization (polyA FISH) to detect polyadenylated mRNA; (3) cycloheximide and puromycin treatment to determine whether stress-induced foci are in dynamic equilibrium with polysomes; and (4) ribopuromycylation to assess the translational status of cells containing putative SGs. Together, these assays can determine whether stress-induced foci can be classified as bona fide SGs.
Protocol
1. Cell Preparation
- Add autoclaved coverslips to 12 wells of a 24-well plate, as indicated in Figure 1A; this can be done using a sterile Pasteur pipette attached to a vacuum to pick up each coverslip. Gently tap the coverslip on the side of the well to release the suction, allowing the coverslip to fall into the well.
- Plate 1 x 10⁵ U-2 OS (U2OS) osteosarcoma cells per well at a final volume of 500 µL of medium. Move the plate side to side and up and down several times to ensure that the cells are evenly distributed.
- Gently press the coverslips down with a clean P1000 tip to ensure that the coverslip is on the bottom of the well and that there are no bubbles under the coverslip.
2. Stressing Cells
- The following day, visually check the plate to ensure that the cells are evenly dispersed and evenly confluent across the coverslip, as variations between samples may adversely impact the reproducibility of results. Use a 10X objective on an inverted tissue-culture microscope.
- Preheat the medium to 37 °C. Avoid applying cold or hot media to the cells, as these cause cold shock or heat shock, respectively.
- Dilute drugs in preheated media. For each different drug concentration, prepare 2 wells containing 500 µL of medium. Prepare an additional 500 µL to allow for loss while pipetting. Aliquot 4 tubes, each containing 1.5 mL.
- For sodium arsenite: to each well containing 500 µL, add 1.5 µL of 100 mM sodium arsenite (final concentration: 100 µM) or add 0.75 µL of 100 mM sodium arsenite (final concentration: 50 µM).
- For vinorelbine: to each well containing 500 µL, add 22.5 µL of 10 mM vinorelbine (final concentration: 150 µM) or add 18.75 µL of 10 mM vinorelbine (final concentration: 100 µM).
NOTE: Sodium arsenite is a well-characterized and commonly used stress granule inducer and is therefore classically used as a positive control.
- Remove and discard the media from wells B1 – 4 and C1 – 4. Add the media with drugs and wait for 60 min (Figure 1A).
- Add 500 µL of medium with 100 µM sodium arsenite to wells B1 and B2. Add 500 µL of medium with 50 µM sodium arsenite to wells B3 and B4.
- Add 500 µL of medium with 150 µM vinorelbine to wells C1 and C2. Add 500 µL of medium with 125 µM vinorelbine to wells C3 and C4.
- 30 min prior to fixation, treat the wells in column 2 with 5 µL of cycloheximide (1 mg/mL stock) and the wells in column 4 with 2 µL of puromycin (1.25 mg/mL stock). Gently rock the plate to mix before placing the plate back in the 37 °C incubator.
3. Cell Fixation and Immunofluorescence
NOTE: Before the experiment, ensure that the methanol is cooled to -20 °C. Make buffers, including Phosphate-buffered Saline (PBS), 5% Normal Horse Serum (NHS) in PBS, and 4% paraformaldehyde (PFA) in PBS.
- Discard the media and wash the wells containing coverslips with PBS. Depending on the drugs used, it might be important to properly discard the media containing drugs; contact the local environmental safety office for specific instructions. To wash efficiently, fill a squeeze bottle with PBS, cut back the tip in order to allow a gentle flow rather than a tight stream, and use this to add PBS to each well after aspirating the original PBS.
- Fix the cells using ~250 µL of 4% PFA for 15 min at RT under gentle agitation. Completely cover the top of the coverslip with PFA; 250 µL should be sufficient, but if not, add more. Always avoid pipetting directly onto the coverslips, as some cells (or stress treatments of cells) can alter attachment, and the force from pipetting can dislodge the cells.
- Remove the PFA and discard properly. Contact the local environmental safety office for details on how to properly discard paraformaldehyde.
- Add ~250 µL of methanol (-20 °C) and incubate for 5 min at RT under gentle rocking; this both permeabilizes and flattens the cells.
- Remove and discard the methanol and block the cells by applying ~250 µL of 5% NHS for 1 h at RT O/N at 4 °C. Contact the local environmental safety office for details on how to properly discard of methanol.
- For primary antibodies, dilute the antibodies in 5% NHS.
NOTE: The use of multiple SG markers is key to confirming whether the granules observed are bona fide SGs. The number of SG markers that can be used depends on the filters available in the microscope. If standard green, red, and far-red filter sets are available, use G3BP1, eIF4G, and eIF3b at a 1/250 dilution.- For this experiment (12 coverslips at 250 µL each-Total: 3 mL of 5% NHS), add 12 µL of each of the following: anti-G3BP1, anti-eIF3b, and anti-eIF4G. Incubate the primary antibodies using gentle agitation for at least 1 h at RT or O/N at 4 °C.
- Wash the wells 3x with PBS, and incubate each wash for 5 min.
- For secondary antibodies, dilute all secondary antibodies (1/250 dilution) and Hoechst dye (1/1,000 dilution) in 5% NHS.
- For this experiment (12 coverslips at 250 µL each-Total: 3 mL of 5% NHS), add 12 µL of each of the following: Cy2-Mouse, Cy3-Rabbit, and Cy5-Goat (a 1/250 dilution of each) and add 3 µL of Hoechst dye.
- Incubate the coverslips with the secondary antibodies for 1 h at RT. During this and the following steps, protect the samples from light by covering the plate with a box or by placing foil over the top of the tissue culture dish.
- Wash the wells three times with PBS for 5 min each.
- Mount the coverslips onto labeled glass slides using mounting medium. Heat the mounting medium in a 37 °C heat block for 10 min; this decreases the viscosity and makes it easier to pipette. With a cut P200 tip, pipette 25 µL of mounting medium per coverslip onto a glass slide; 4-8 coverslips can fit on one glass slide, assuming that the microscope stage allows this. Using fine forceps, transfer the coverslip from the well to the slide, making sure to put the cell side down on the mounting medium. Using a clean P200 tip, press the coverslip down.
- Once all the coverslips have been mounted, use folded lab tissue to clean up excess mounting medium by pressing the lab tissue very firmly onto the slide. Use a squeeze bottle containing H2O to flush off the excess mounting medium and then repeat the blotting with folded lab tissue to remove the water.
4. Fluorescence In Situ Hybridization (FISH)
- Plate and treat the cells, using steps 1 and 2.1-4 as a guide; it is only necessary to plate the cells in column 1, as only 3 coverslips are needed in the following experiment.
- Ensure that all buffers are prepared (i.e. 4% PFA in PBS, 70% ethanol in water, 2x Saline-Sodium-Citrate (SSC), and 5% NHS), that the methanol is cooled down to -20 °C, and that the hybridization oven is warmed up to the appropriate temperature.
- Carry out steps 3.1-3.3 to wash and fix the cells.
- Permeabilize cells by adding -20 °C methanol for 10 min.
- Remove the methanol and incubate the coverslips in 70% ethanol. Place the plate at 4 °C overnight. Seal the plate using parafilm to prevent evaporation.
- The following day, remove the ethanol and rehydrate the cells by adding 500 µL of 2x SSC. Incubate the coverslips for 5 min with gentle agitation at RT.
- Remove the 2x SSC and add 500 µL of 2X SSC. Incubate for 5 min under gentle agitation.
- Place a piece of parafilm flat on the bottom of the hybridization oven. Pipette 25 µL of hybridization buffer onto the parafilm for each coverslip. Remove the coverslip from the 24-well dish (at this point, the coverslips are cell-side up) and place the coverslip cell-side down on the hybridization buffer. Do this at 42 °C or optionally at 65 °C for 15 min.
NOTE: Completing this step at 65 °C will denature cellular RNAs; this can improve the signal if the polyA is masked by interactions with proteins. - Dilute the Biotin-Oligo(dT) probe (100 ng/µL) in hybridization buffer to a concentration of 2 ng/µL; 25 µL per coverslip is sufficient.
- For each coverslip, pipette 25 µL of hybridization buffer containing Biotin-Oligo(dT) onto the parafilm. Pick up the coverslip with forceps and gently touch the edge of the coverslip onto a lab tissue to remove excess hybridization buffer. Transfer the coverslip to the hybridization buffer with Biotin-Oligo(dT); remember to keep the cell side down.
- Place the coverslips in a hybridization box to limit evaporation. Incubate the coverslips with Biotin-Oligo(dT) in hybridization buffer for 60 min at 42 °C.
- Place 2x SSC in the hybridization oven to allow it to equilibrate to 42 °C.
- Add ~500 µL of warmed 2x SSC to the wells in the 24-well dish and use forceps to transfer the coverslips to the well. Incubate for 10 min.
- Repeat the above wash step twice at 42 °C and then twice at RT.
- Complete steps 3.5-3.10, making sure to use a streptavidin fluorochrome to detect the Biotin-Oligo(dT) instead of one conventional antibody.
5. Ribopuromycylation Assay to Assess Translational Status
- Plate U2OS cells on coverslips, as indicated in step 1, but only plate one coverslip per condition (in this case, 3 coverslips: nontreated, 100 µM sodium arsenite, and 150 µM vinorelbine) (Figure 1A).
- Stress cells using the protocol in step 2, completing steps 2.1-2.4.
- 5 min before fixation, add 2 µL of puromycin (stock: 1.25 mg/mL; dilute 2 µL in 500 µL to obtain a final puromycin concentration of 5 µg/mL) and 2.9 µL of emetine (stock: 20 µg/mL; add 2.9 µL to the same solution already containing the puromycin) to each well containing 0.5 mL.
- Complete steps 3.1-3.10 as indicated above, using an anti-puromycin antibody (1/1000 dilution) to detect puromycin. Ideally, use two other SG markers in the remaining channels.
- When quantifying the puromycin signal, take all images using the same exposure. Choose this exposure by using the brightest (unstressed) sample and taking an image as bright as possible without saturation.
NOTE: The intensity of the anti-puromycin fluorescent signal represents ongoing translation, as puromycin substitutes for an amino acid, incorporates into the nascent protein, and enforces the premature termination of the protein.
6. Image Acquisition and Analysis
- Quantifying Stress Granules
- To quantify SGs, acquire 3 – 5 images totaling >100 cells per sample using a 40X objective. Alternatively, acquire images using other objectives, but ensure that >100 cells are counted per coverslip and that the magnification is large enough to clearly visualize the granules. Do this by dividing the coverslip into five roughly equal regions and randomly selecting a field from each region (Figure 1B); images of the same field should include all channels to assess the colocalization of markers.
- Once all images have been acquired, merge the channels. Some camera software will automatically do this, while others require manual merging; this can be done with ImageJ by opening all the images and then selecting [Image | Color | Merge Channels].
- Manually count the total number of cells by counting the number of nuclei, using Hoechst as the nuclei marker. Manually count the number of cells that contain more than two SGs per cell.
NOTE: For example, using a merged three-channel image displaying G3BP1 (green), eIF4G (red), and Hoechst (blue), count the nuclei (or number of cells) using the blue channel. Then, count SG-positive cells as those with two or more yellow foci per cell. The granules will appear yellow, as green from G3BP1 and red from eIF4G appear yellow if colocalized. - Determine the percentage of cells that are SG positive by combining the data from the 3-5 independent regions and then calculate:
number of SG positive / number of nuclei) *100 = percent of SG-positive cells
- Assessing Colocalization by Line Scan Analysis – Manual Method
- Open ImageJ. Download it for free from ()
- Open the ROI manager: [Analyze | Tools | ROI manager…].
- Open the merged image in ImageJ: [File | Open].
- Using the line tool located in the ImageJ toolbar, add a line that goes through an SG, making sure to include before and after the SG. Add this line to the ROI manager by clicking [Add] in the ROI manager window.
- Split the merged image into separate channels to assess the localization of each marker to the granule: [Image | Color | Split Channel]; this will split the merged image into three black-and-white images.
- In the black-and-white image, make sure that the line is selected; the line is selected if it appears in the image. If not, in the ROI manager window, click on the line in the panel; this will highlight the line in blue in the ROI manager window and will make the line visible on the black-and-white image. If the line still does not appear, be sure that "show all" is checked in the ROI manager and then click on the line in the image.
- Analyze the intensity of the line: [Analyze | Plot Profile]; this will bring up the "Plot Profile" window, which plots the intensity of the signal across the line.
- Within the "Plot Profile" window, click [List], which brings up a window containing the raw data from the graph. Copy all the data in this window and paste it into a spreadsheet file. To do this, select all the data in the window: [Edit | Select All]. Copy the date: [Edit | Copy]. Open a spreadsheet file and paste the data: [Edit | Paste].
- Complete steps 6.2.6 – 6.2.8 for each channel separately. Be sure to keep track of the channel being assessed.
- In a spreadsheet, generate a line graph of the results. Select the columns that include data by pressing [control] and clicking on the letter at the top of each column. Then, select line graph: [Insert | Line graph].
- Repeat this analysis for multiple stress granules across multiple independent experiments.
- Assessing Colocalization by Line Scan Analysis – ImageJ Plugin
- Download and install the RGB profile tool from the ImageJ website (https://imagej.nih.gov/ij/macros/tools/RGBProfilesTool.txt); when correctly installed, a red, green, and blue (RGB)-lined icon should appear in the toolbar.
- Open the image (e.g., Tiff, JPG) in ImageJ: [File | Open].
- Click on the RGB icon located in the ImageJ toolbar.
- Click and drag to add a line that extends through an SG, making sure to include adjacent regions; an image of the histogram will appear in a pop-up window.
- Save the data as an image: [File | Save As | Tiff]. Alternatively, export and then graph the data in another graphing program using step 6.2.8 from above.
Representative Results
Stress-induced foci are not necessarily SGs. SGs are classified as cytoplasmic foci that contain mRNAs, translation initiation factors, and RNA-binding proteins and are in equilibrium with active translation. The above protocol can be used as a template to characterize whether a given stress induces bona fide SGs.
SGs colocalize with other known SG markers, including both proteins and mRNA. SA and VRB induce cytoplasmic foci that contain G3BP1, eIF4G, and eIF3b (Figure 2A). The colocalization of these markers is confirmed using line scan analysis and single channel images with increased magnification (Figure 2A). Additionally, these foci contain Mrna, as indicated by polyA FISH, and the oligo(dT) signal colocalizes with the G3BP1 immunofluorescence signal (Figure 2B). It is critical to show that the polyA-FISH signal overlaps with a known SG marker, as a stress could promote multiple types of foci.
SGs occur during a translationally inhibited state. Both VRB and SA promote a translationally repressed state, as experimentally assessed with ribopuromycylation (Figure 3). Bona fide SGs are in dynamic equilibrium with actively translating polysomes. SA- and VRB-induced SGs are dissolved with CHX, which traps polysomes on mRNAs, thus stopping polysome disassembly and preventing SGs (Figure 4A, 4B). Conversely, more SA and VRB SGs are induced after treatment with puro, as puro promotes polysome disassembly, thus favoring SG formation (Figure 4A, 4C).
In summary, as with the positive-control SA, VRB induces bona fide SGs that: (1) colocalize with known SG markers, (2) include both protein and mRNA (Figure 2), (3) are found in cells where translation is repressed (Figure 3), and (4) are in dynamic equilibrium with active translation (Figure 4A-4C).
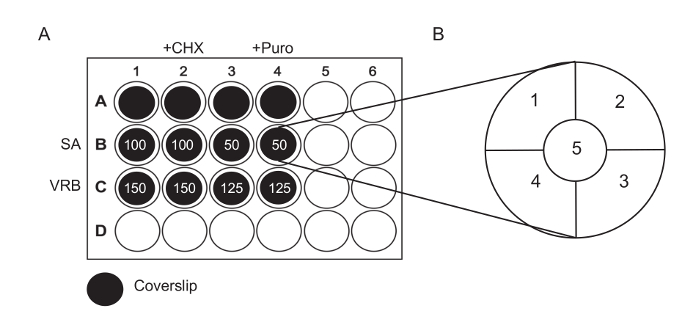
Figure 1: Experimental Diagrams. (A) Seed cells onto coverslips previously placed in a 24-well plate, as indicated. Treat Rows A and B for 60 min with SA or VRB using the concentration in µM as indicated. After 60 min, add CHX (final concentration: 20 µg/mL for column 2) or puro (20 µg/mL puromycin for column 4) to the drug-containing medium. Continue incubation for an additional 30 min prior to fixation and staining. (B) Diagram of a coverslip, indicating the fields that should be imaged for counting. The coverslip is divided into five roughly equal regions; one image is taken in each region. Please click here to view a larger version of this figure.

Figure 2: SA and VRB Induce Cytoplasmic Foci that Contain SG Markers anPoly(A) mRNA. (A) U2OS cells immunostained for G3BP1 (green), eIF3b (red), and eIF4G (blue). Cells were treated with 100 µM SA or 150 µM VRB for 60 min or were not treated (control). Zoomed regions are enlarged (2X) and shown as separate channels in black and white (below). The graph indicates the line scan analysis of a region (white line) granule and shows the extent of overlap or colocalization. The scale bar represents 10 µm. (B) PolyA-FISH coupled with immunostaining detects polyA mRNA with an oligo(dT)40 probe (red), G3BP1 (green) is detected using an anti-G3BP antibody, and nuclear DNA is detected using Hoechst dye (blue). Zoomed regions (2X), single-channel images, and the line scan analysis show colocalization. Scale bar = 10 µm. Please click here to view a larger version of this figure.
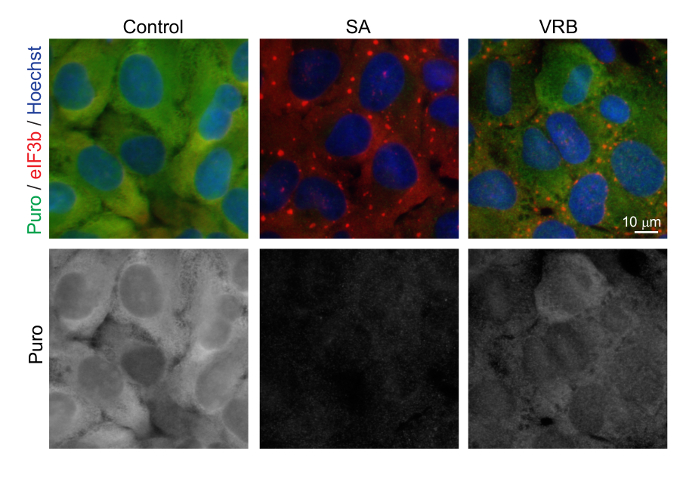
Figure 3: SA and VRB Treatment CauseTranslation Repression. The immunofluorescence of U2OS cells pulse-labeled with puromycin for 5 min following the indicated treatments. Puromycin (green), eIF3b (red), and nuclear DNA stained with Hoechst (blue). The cells were treated with 100 µM SA or 150 µM VRB for 60 min or were not treated (control). Scale bar = 10 µm. Please click here to view a larger version of this figure.
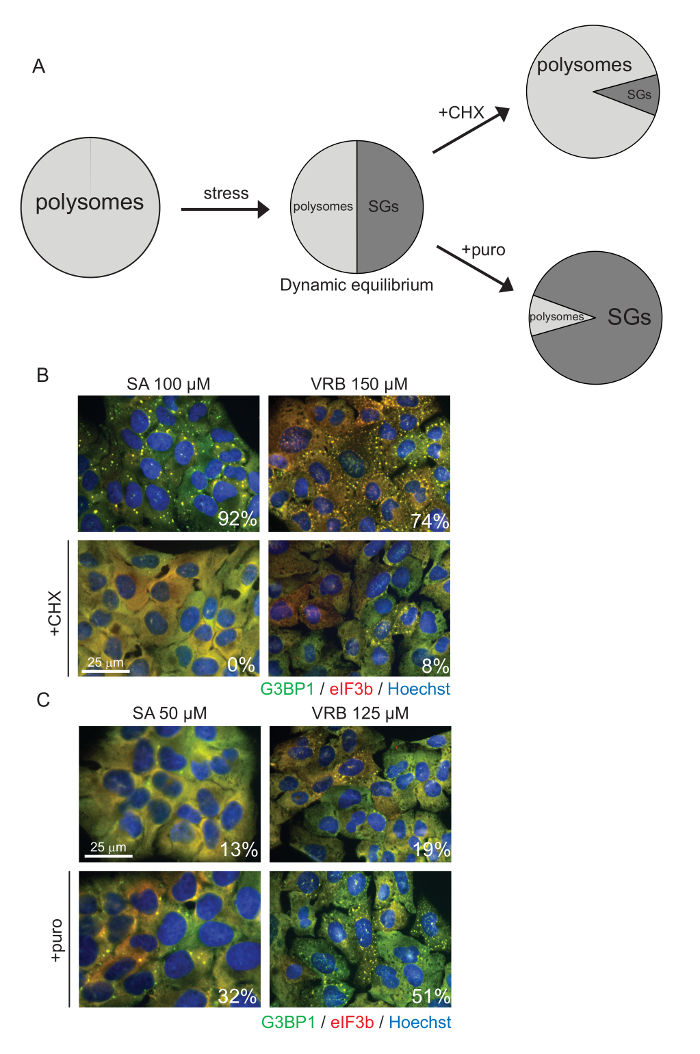
Figure 4: SA and VRB Induce Cytoplasmic Foci that are in Dynamic Equilibrium with Polysomes. (A) General scheme describing the polysome/SG relationship. (B-C) U2OS cells stained for G3BP1 (green), eIF3b (red), and nuclear DNA using Hoechst (blue). Cells were treated with 100 µM SA or 150 µM VRB for 60 min or were not treated (control) prior to the addition of (B) CHX (cycloheximide, 20 µg/mL), (C) puro (Puromycin, 10 µg/mL), or no additive for an additional 30 min of incubation. The numbers correspond to the percentage of cells with SGs in a representative experiment. Scale bar = 25 µm, in (B-C). Please click here to view a larger version of this figure.
Discussion
As evidenced by immunohistological studies in multiple diseases, chronic stress leads to the formation of different intracellular foci. For example, most neurodegenerative diseases are characterized by intracellular aggregates of insoluble proteins. The presence of SG-associated proteins in such aggregates is often the basis for concluding that such foci are SGs. A similar conclusion is also drawn when SG marker-positive cytoplasmic foci are observed in cells treated with new stress stimuli. This protocol provides a simple workflow to identify bona fide SGs.
Several criteria must be met for putative SGs to be confirmed as such, including the characterization of both composition and dynamics. First, SGs are cytoplasmic foci that contain translationally stalled mRNPs. Thus, the first approach is to characterize their composition using two microscopy-based techniques, namely polyA-FISH and IF. FISH is a reliable method to visualize mRNAs that colocalize with SGs. An oligo(dT)40 probe is used to detect polyadenylated mRNAs that pack into SGs under stress conditions. Since oligo(dT) will not detect deadenylated mRNAs, which are core components of Processing Bodies (PBs), the presence of a strong oligo(dT) signal in cytoplasmic foci is a first indication (although not enough for definition) that these foci are SGs. The second test is to demonstrate the colocalization of a poly(A) signal with other SG markers (e.g., G3BP1) (Figure 2A). This is done by performing IF against SG marker proteins. The SG markers eIF3b, eIF4G, and G3BP1 are routinely used because eIF3b and eIF4G are translation initiation factors known to be components of 48S* complexes and G3BP1 is required for SG formation (Figure 2B). It is important to emphasize that more than one SG marker is required, as different stresses recruit different SG-associated factors to SGs, and some stresses can cause protein aggregation that could be mistaken for SG formation.
Second, SGs are formed because of translation inhibition. While the inhibition of translation can be detected by different approaches (e.g., by traditional [35S]Met chase labeling), ribopuromycylation is preferred, as it detects ongoing protein translation in treated cells. This technique is also compatible with standard immunofluorescence against SG markers, thus allowing for the simultaneous monitoring of SGs and of the degree of translation inhibition in individual cells. As seen in Figure 3, SA and VRB both promote SG formation to different degrees. While SA causes SGs in nearly 100% of cells, VRB promotes SG formation in approximately 75% of cells. The ability to promote SGs correlates with the degree of translation inhibition: while untreated cells have a high basal level of translation, SA inhibits translation completely, but VRB only partially inhibits translation (Figure 3).
Third, SGs are dynamic and are in equilibrium with translating polysomes. Treating cells with cycloheximide prior to stress or concurrently with stress prevents polysome disassembly and SG formation. The SG-polysome equilibrium is bidirectional, as stressed cells exhibiting SGs can be treated with cycloheximide to enforce SG disassembly by trapping mRNAs in polysomes or monosomes whenever they are productively initiated. An important control is to use puromycin, which inhibits elongation by promoting premature termination, thus increasing the amount of non-polysomal mRNPs available for SG formation. Dramatic changes in SGs are observed when SA or VRB treatment is coupled with CHX or puro treatment (Figure 4). Thus, assessing whether putative SGs are dissolved upon cycloheximide treatment but are augmented or unaffected by puromycin is a key experimental parameter to use in SG identification. The emetine-enforced SG disassembly in very small, non-adherent, primary human bone marrow CD34+ cells was successfully demonstrated by treating the cells in suspension prior to cytospinning32.
Sodium arsenite is widely used to trigger SGs by inducing eIF2-α phosphorylation33, but it should be carefully titrated, as it targets many proteins and activates a number of signaling pathways34,35. Different cell lines exhibit varying degrees of sensitivity to sodium arsenite. U2OS are relatively sensitive (100 µM), while COS7, MEFs, and HeLa require 200 µM. DU-1456, primary normal human bone marrow CD34+ cells32, human lymphoblasts36, mouse cortical neurons37, and Huh7 cells31 require 500-1,000 µM.
As classification of SGs is mainly a microscopy-based methodology, it is important to acquire unbiased, quality images. It is important to take images in an unbiased manner, as selecting regions that have high or low numbers of SGs can skew findings. Other considerations include taking the images in each channel using the same exposure; this will ensure that any changes in intensity across coverslips are indicative of changes in that marker. Additionally, take all images at non-saturating levels of intensity so that intensity can be assessed across the entire experiment. Acquire all images on the same day using the same microscope/camera, as changes in bulb intensity can vary day-to-day and between microscopes. Lastly, it is important to check the filters and settings of the microscope that will be used to image the slides. This protocol is set up for a microscope with filter sets enabling the visualization of UV, green, red, and far-red channels. Adjustments may be necessary for different microscopes.
The experimental workflow described here permits the detection of SGs in different cells and under different stresses. The major advantage of this workflow is that it is simple and allows for the unambiguous detection of bona fide SGs, as well as for the simultaneous probing of cellular translation in stress-treated cells. This protocol uses U2OS cells, but it can be amended for different cell lines or even for primary cells. A recent and comprehensive list of cells used for stress granule studies is review11. The number of cells should be adjusted to reach 80% confluency on the day of drug treatment. The concentration and duration of drug treatment should be adjusted as well, as cells respond differently. Additionally, while this protocol is set up for a 24-well format, it can be adjusted to any size plate or dish where coverslips (of any size) can lay flat during plating and drug treatment. Cell lines stably expressing SG/PB markers have been used in high-throughput, siRNA-based screens33 and live-cell imaging38. Image-based screening was employed using HeLa cells stained for the endogenous SG marker PABP to detect chemical compounds blocking SG assembly39. It is anticipated that this workflow will be useful in future studies and applications.
Offenlegungen
The authors have nothing to disclose.
Acknowledgements
We thank members of the Ivanov and Anderson labs for their helpful discussion and feedback on this manuscript. This work was supported by the National Institutes of Health [GM111700 and CA168872 to PA, NS094918 to PI], the National Science Centre in Poland [grant UMO-2012/06/M/NZ3/00054 to WS]. WS also acknowledges the Ministry of Science and Higher Education in Poland (Mobility Plus Program) and the Polish-American Fulbright Commission for their financial support of his research in the USA.
Materials
| U-2 OS | ATCC | ATCC®HTB-96™ | – commonly written as "U2OS" – culture at 37 °C under 5% CO2 in 10% FBS/DMEM |
| Dulbecco's Modification of Eagle's Medium | Corning | 10-013-CV | – abbreviated DMEM – contains 4.5 g/L glucose, pyruvate, and phenol red – supplemented with 10% FBS, 10 mM HEPES, and penicillin/steptomycin – prewarm prior drug(s) dilution |
| Fetal Bovine Serum | Sigma | F2442-500ml | – abbreviated FBS – used to supplement media |
| HEPES (1 M) | Thermo Fisher Scientific | 15630-080 | – used to supplement media |
| penicilline streptomycine | Sigma | P0781-100ml | – used to supplement media |
| 24 well plate | Costar | 3524 | |
| lab tissues | KIMTECH SCIENCE | 34120 | – commonly called "kimwipes" |
| Coverglass for Growth Cover Glasses | Fisher Scientific | 12-545-82 | – autoclaved before used – keep sterile in the tissue culture hood |
| Sodium (meta)arsenite ≥90% | Sigma | S7400-100G | – commonly called sodium arsenite and abbreviated SA – dissolution in water at 1 M concentration, then dilute to 100 µM as a working stock |
| Vinorelbine | TSZ CHEM | RS055 | – abbreviated VRB – dissolve in water to 10 mM |
| Puromycin | Sigma | P9620 | – used to assess translation level (ribopuromycylation) – used to assess SG connection with active translation – dilute in water to 10 mg/mL |
| Emetine dihydrochloride hydrate | Sigma | E2375 | – used in combination with puro to assess general translation level – used to assess SG connection with active translation – dilute in water to 10 mg/mL |
| Cycloheximide | Sigma | C4859 | – abbreviated CHX – used to assess SG connection with active translation – dilute in water to 10 mg/mL |
| Phosphate Buffered Saline | Lonza / VWR | 95042-486 | – abbreviated PBS – wash buffer for immunofluorescence |
| Paraformaldehyde reagent grade, crystalline | Sigma | P6148-500G | – make a 4% solution in hot PBS in fume hood, stir until dissolved – aliquots can be stored at – 20 °C for several months – hazardous, use ventilation – discard in special waste |
| Methanol, ACS | BDH / VWR | BDH1135-4LP | – pre-chilled to -20°C before use – discard in special waste |
| Normal Horse Serum | Thermo Fisher Scientific | 31874 | – abbreviated NHS – dilute to 5% in PBS – add sodium azide for storage at 4°C – blocking solution for immunofluorescence |
| Ethanol, Pure, 200 Proof (100%),USP, KOPTEC | Decon Labs / VWR | 89125-188 | – dilute to 70% with water |
| Fisherbrand Superfrost Plus Microscope Slides | Fisherbrand | 12-550-15 | |
| mouse anti G3BP1 antibody (TT-Y) | Santa Cruz | sc-81940 | – store at 4 °C – use at 1/100 dilution |
| rabbit anti eIF4G antibody (H-300) | Santa Cruz | sc-11373 | – store at 4 °C – 1/250 dilution |
| goat anti eIF3η (N-20) antibody | Santa Cruz | sc-16377 | – eIF3η is also known as eIF3b – store at 4 °C – 1/250 dilution |
| mouse anti puromycin 12D10 antibody | Millipore | MABE343 | – store at 4 °C – 1/1000 dilution |
| Cy2 AffiniPure Donkey Anti-Mouse IgG (H+L) | Jackson Immunoresearch | 715-225-150 | – reconstitute in water as per manufacturer’s instructions then store at 4°C – 1/250 dilution |
| Cy3 AffiniPure Donkey Anti-Rabbit IgG (H+L) | Jackson Immunoresearch | 711-165-152 | – reconstitute in water as per manufacturer’s instructions then store at 4°C – 1/2500 dilution |
| Cy5 AffiniPure Donkey Anti-Goat IgG (H+L) | Jackson Immunoresearch | 705-175-147 | – reconstitute in water as per manufacturer’s instructions then store at 4°C – 1/250 dilution |
| Hoechst 33258 solution | Sigma | 94403-1ML | – incubate with secondary antibodies -stock solution 0.5 mg/mL in dH20, protect from light – Store at 4 °C |
| Cy3 Streptavidin | Jackson Immunoresearch | 016-160-084 | – reconstitute in water as per manufacturer’s instructions, then store at 4°C – 1/250 dilution |
| oligo-(dT)40x probe biotinilated | Integrated DNA Technologies (IDT) | / | – reconstitute in water to 100 ng/mL, aliquot and store at -20°C – dilute in hybridation buffer 1/50 prior to use – custom order |
| hybridation box | / | / | – make a moisture chamber with any storing slide box by adding humidified paper on the bottom – prewarm the box prior use |
| 20 x SSC buffer | Thermo fisher Ambion | AM9763 | – dilute to 2X SSC using RNase Free water (DEPC treated) – store at room temperature – wash buffer for FISH |
| PerfectHybPlus Hybridization Buffer | Sigma | H7033-50ml | – block and probe incubation buffer for FISH |
| slide mounting media | home made | / | – mix 5 g of “cold-soluble” poly(vinyl alcohol) in 20 ml of PBS – mix by sonication, followed by stirring overnight at RT – Add 5 ml of glycerol and 0.2 ml of 20 % sodium azide, and stir for 16 h at RT – centrifugation at 20,000 g for 20 min, discard large pellet – aliquot viscous liquid, long-term storage at -20°C, 1 week at 4°C |
| Parafilm "M" | Sigma | P7793-1EA | – usually referred as "parafilm" |
| Poly(vinyl alcohol) | Sigma | P-8136-250G | – reagent to make vinol |
| Glycerol | Sigma | G5516-100ML | – reagent to make vinol |
| sodium azide | Fisher Scientific | S2002-5G | – preservative agent for blocking solution and vinol – make a 20 % dilution in water |
Referenzen
- Holcik, M., Sonenberg, N. Translational control in stress and apoptosis. Nat Rev Mol Cell Biol. 6 (4), 318-327 (2005).
- Yamasaki, S., Anderson, P. Reprogramming mRNA translation during stress. Curr Opin Cell Biol. 20 (2), 222-226 (2008).
- Buchan, J. R. mRNP granules: Assembly, function, and connections with disease. RNA Biol. 11 (8), (2014).
- Kedersha, N., et al. Evidence that ternary complex (eIF2-GTP-tRNA(i)(Met))-deficient preinitiation complexes are core constituents of mammalian stress granules. Mol Biol Cell. 13 (1), 195-210 (2002).
- Kedersha, N., Ivanov, P., Anderson, P. Stress granules and cell signaling: more than just a passing phase?. Trends Biochem Sci. 38 (10), 494-506 (2013).
- Kedersha, N., et al. Dynamic shuttling of TIA-1 accompanies the recruitment of mRNA to mammalian stress granules. J Cell Biol. 151 (6), 1257-1268 (2000).
- Bley, N., et al. Stress granules are dispensable for mRNA stabilization during cellular stress. Nucleic Acids Res. 43 (4), e26 (2015).
- Kedersha, N., et al. G3BP-Caprin1-USP10 complexes mediate stress granule condensation and associate with 40S subunits. J Cell Biol. 212 (7), 845-860 (2016).
- Panas, M. D., Ivanov, P., Anderson, P. Mechanistic insights into mammalian stress granule dynamics. J Cell Biol. 215 (3), 313-323 (2016).
- Anderson, P., Kedersha, N., Ivanov, P. Stress granules, P-bodies and cancer. Biochim Biophys Acta. 1849 (7), 861-870 (2015).
- Aulas, A., Van de Velde, ., C, Alterations in stress granule dynamics driven by TDP-43 and FUS: a link to pathological inclusions in ALS?. Front Cell Neurosci. 9, 423 (2015).
- Ivanov, P., Anderson, P. Post-transcriptional regulatory networks in immunity. Immunol Rev. 253 (1), 253-272 (2013).
- Wolozin, B. Physiological protein aggregation run amuck: stress granules and the genesis of neurodegenerative disease. Discov Med. 17 (91), 47-52 (2014).
- Lloyd, R. E. Regulation of stress granules and P-bodies during RNA virus infection. Wiley Interdiscip Rev RNA. 4 (3), 317-331 (2013).
- Somasekharan, S. P., et al. YB-1 regulates stress granule formation and tumor progression by translationally activating G3BP1. J Cell Biol. 208 (7), 913-929 (2015).
- Adjibade, P., et al. Sorafenib, a multikinase inhibitor, induces formation of stress granules in hepatocarcinoma cells. Oncotarget. , (2015).
- Fournier, M. J., Gareau, C., Mazroui, R. The chemotherapeutic agent bortezomib induces the formation of stress granules. Cancer Cell Int. 10, 12 (2010).
- Mazroui, R., Di Marco, S., Kaufman, R. J., Gallouzi, I. E. Inhibition of the ubiquitin-proteasome system induces stress granule formation. Mol Biol Cell. 18 (7), 2603-2618 (2007).
- Moeller, B. J., Cao, Y., Li, C. Y., Dewhirst, M. W. Radiation activates HIF-1 to regulate vascular radiosensitivity in tumors: role of reoxygenation, free radicals, and stress granules. Cancer Cell. 5 (5), 429-441 (2004).
- Szaflarski, W., et al. Vinca alkaloid drugs promote stress-induced translational repression and stress granule formation. Oncotarget. 7 (21), 30307-30322 (2016).
- Gilks, N., et al. Stress granule assembly is mediated by prion-like aggregation of TIA-1. Mol Biol Cell. 15 (12), 5383-5398 (2004).
- Kedersha, N. L., Gupta, M., Li, W., Miller, I., Anderson, P. RNA-binding proteins TIA-1 and TIAR link the phosphorylation of eIF-2 alpha to the assembly of mammalian stress granules. J Cell Biol. 147 (7), 1431-1442 (1999).
- Kedersha, N., Anderson, P. Mammalian stress granules and processing bodies. Methods Enzymol. 431, 61-81 (2007).
- Kedersha, N., Tisdale, S., Hickman, T., Anderson, P. Real-time and quantitative imaging of mammalian stress granules and processing bodies. Methods Enzymol. 448, 521-552 (2008).
- Langer-Safer, P. R., Levine, M., Ward, D. C. Immunological method for mapping genes on Drosophila polytene chromosomes. Proc Natl Acad Sci U S A. 79 (14), 4381-4385 (1982).
- Schneider, C. A., Rasband, W. S., Eliceiri, K. W. NIH Image to ImageJ: 25 years of image analysis. Nat Methods. 9 (7), 671-675 (2012).
- David, A., et al. Nuclear translation visualized by ribosome-bound nascent chain puromycylation. J Cell Biol. 197 (1), 45-57 (2012).
- Panas, M. D., Kedersha, N., McInerney, G. M. Methods for the characterization of stress granules in virus infected cells. Methods. 90, 57-64 (2015).
- David, A., Bennink, J. R., Yewdell, J. W. Emetine optimally facilitates nascent chain puromycylation and potentiates the ribopuromycylation method (RPM) applied to inert cells. Histochem Cell Biol. 139 (3), 501-504 (2013).
- Dieterich, D. C., et al. In situ visualization and dynamics of newly synthesized proteins in rat hippocampal neurons. Nat Neurosci. 13 (7), 897-905 (2010).
- Ruggieri, A., et al. Dynamic oscillation of translation and stress granule formation mark the cellular response to virus infection. Cell Host Microbe. 12 (1), 71-85 (2012).
- Ghisolfi, L., Dutt, S., McConkey, M. E., Ebert, B. L., Anderson, P. Stress granules contribute to alpha-globin homeostasis in differentiating erythroid cells. Biochem Biophys Res Commun. 420 (4), 768-774 (2012).
- Ohn, T., Kedersha, N., Hickman, T., Tisdale, S., Anderson, P. A functional RNAi screen links O-GlcNAc modification of ribosomal proteins to stress granule and processing body assembly. Nat Cell Biol. 10 (10), 1224-1231 (2008).
- Porter, A. C., Fanger, G. R., Vaillancourt, R. R. Signal transduction pathways regulated by arsenate and arsenite. Oncogene. 18 (54), 7794-7802 (1999).
- Shen, S., Li, X. F., Cullen, W. R., Weinfeld, M., Le, X. C. Arsenic binding to proteins. Chem Rev. 113 (10), 7769-7792 (2013).
- McDonald, K. K., et al. TAR DNA-binding protein 43 (TDP-43) regulates stress granule dynamics via differential regulation of G3BP and TIA-1. Hum Mol Genet. 20 (7), 1400-1410 (2011).
- Aulas, A., et al. G3BP1 promotes stress-induced RNA granule interactions to preserve polyadenylated mRNA. J Cell Biol. 209 (1), 73-84 (2015).
- Martin, S., Tazi, J. Visualization of G3BP stress granules dynamics in live primary cells. J Vis Exp. (87), (2014).
- Wippich, F., et al. Dual specificity kinase DYRK3 couples stress granule condensation/dissolution to mTORC1 signaling. Cell. 152 (4), 791-805 (2013).
