The protocol describes a reproducible method designed for use with cell culture supernatants to detect surface epitopes on small extracellular vesicles (EV). It utilizes specific EV immunoprecipitation using beads coupled with antibodies that recognize surface antigen CD9, CD63, and CD81. The method is optimized for downstream flow cytometry analysis.
Flow cytometry (FC) is the method of choice for semi-quantitative measurement of cell-surface antigen markers. Recently, this technique has been used for phenotypic analyses of extracellular vesicles (EV) including exosomes (Exo) in the peripheral blood and other body fluids. The small size of EV mandates the use of dedicated instruments having a detection threshold around 50-100 nm. Alternatively, EV can be bound to latex microbeads that can be detected by FC. Microbeads, conjugated with antibodies that recognize EV-associated markers/Cluster of Differentiation CD63, CD9, and CD81 can be used for EV capture. Exo isolated from CM can be analyzed with or without pre-enrichment by ultracentrifugation. This approach is suitable for EV analyses using conventional FC instruments. Our results demonstrate a linear correlation between Mean Fluorescence Intensity (MFI) values and EV concentration. Disrupting EV through sonication dramatically decreased MFI, indicating that the method does not detect membrane debris. We report an accurate and reliable method for the analysis of EV surface antigens, which can be easily implemented in any laboratory.
Cells secrete extracellular vesicles (EV) of different sizes including microvesicles (MV) and exosomes (Exo). The latter can be distinguished from MV by both size and the subcellular compartment of origin. MV (200–1,000 nm in size) are released from parent cells by shedding from the plasma membrane. Conversely, Exo (30–150 nm) originate from endosomal membranes and are released into the extracellular space when the multivesicular bodies (MVB) fuse with the cell membrane1,2.
EV are increasingly used as diagnostic biomarkers as well as, potentially, therapeutic tools in many fields including oncology, neurology, cardiology, and musculoskeletal diseases3,4,5. A vast majority of ongoing studies using EV as therapeutic agents exploit the isolation of vesicles from cell-conditioned medium (CM) of in vitro cultured cells. Mesenchymal stem cells (MSCs) exert beneficial effects in several contexts, and MSC-derived EV have shown benefits in models of myocardial ischemia/reperfusion injury6 and brain injury7. MSC-derived EV also exhibit immune modulatory activities that can be exploited to treat immune rejection, as demonstrated in a model of therapy-refractory graft-versus-host disease8. Amniotic fluid stem cells (hAFS) actively enrich CM with MVs and Exo, heterogeneously distributed in size (50–1,000 nm), which mediate several biological effects, such as proliferation of differentiated cells, angiogenesis, inhibition of fibrosis, and cardioprotection4. We have recently shown that EV, and particularly Exo, secreted by human cardiac-derived progenitor cells (Exo-CPC) reduce myocardial infarct size in rats5,9.
Exo share a common set of proteins on their surface, including tetraspanins (CD63, CD81, CD9) and major histocompatibility complex class I (MHC-I). In addition to this common set of proteins, Exo also contain proteins specific for the EV subset of the producer cell type. Exo markers are gaining paramount importance because they play a crucial role in inter-cellular communication, thereby regulating many biological processes5,10. Because of their small size, finding an easy way to analyze EV using classical flow cytometry (FC) remains a challenging task.
Here, we present a simplified protocol for EV analysis using FC, which can be applied to pre-enriched samples obtained through ultracentrifugation or directly to CM (Figure 1). The method uses beads coated with a specific antibody that binds canonical Exo-associated surface epitopes (CD63, CD9, CD81) without additional washes. FC analyses can be performed using a conventional cytometer with no need for adjustments prior to measurements. Methods for the characterization of antigens on individual small particles using flow cytometers have been described by other groups with respect to various applications11,12,13. Here, we used functionalized magnetic beads for the capture of small particles and Exo, followed by phenotyping of captured particles by FC. Although this method can be used to characterize the antigenic composition of small vesicles released by any cell type in vitro, here we provided specific cell culture conditions that apply for the culture of human cardiac progenitor cells (CPC) and the most appropriate environment for the production of EV by these cells.
1. Collection and Processing of Conditioned Media
2. Extracellular Vesicles Enrichment by Ultracentrifuge (Optional)
3. Nanoparticle Tracking Analysis (NTA) Quantification
4. Sample Preparation
5. Acquisition
6. Data Analysis
7. Extracellular Vesicle Number Titration
NOTE: Sections 7 to 10 can be performed to set up the number of particles, antibodies concentration and specificity, but can be skipped if the cell type, from which EV are derived, and antibodies remain the same.
8. Antibody Titration
NOTE: Antibody titration is usually performed by adding a single antibody for each tube.
9. Incubation Time
10. Protocol Validation
Total number of particles for single staining
Since a single bead can bind more than one particle, we tested different conditions to set the smallest amount of total EV (single antibody per tube) to reach the early exponential phase of MFI curve. A fixed concentration of antibody was used while the total number of particles ranged from 5 x 10⁵ to 2.5 x 10⁸. As shown in Figure 3A, the number of particles that allows us to ensure that the antibody performs within an acceptable MFI, avoiding the use of an excess of EV, is 1 x 10⁸ particles/staining.
Antibody titration
We selected the proper concentration of antibody resulting in the highest signal preventing the nonspecific antibody binding. This test has been optimized for 1 x 10⁸ particles, as determined in the previous setting. Anti-CD9_FITC, anti-CD63_PE, and anti-CD81_PE were tested with concentrations ranging from 1 to 50 µg/mL (Figure 3B). Anti-CD9_FITC and anti-CD63_PE antibodies gave a good resolution of signal (7.5 and 130-fold change of MFI vs. beads alone, respectively) when used at concentration of 10 µg/mL while the selected concentration for the anti-CD81_PE antibody was 5 µg/mL (465.3 Fold Change MFI).
Method validation
In order to confirm that our method is suitable to analyze only "cup-shaped" extracellular vesicles and not membrane debris, we applied different sonication steps, at 10% of amplitude, to the solution containing particles. 100 µL of 1x PBS solution containing 1 x 10⁸ particles underwent different sonication steps from 30 seconds to 5 minutes and the resulting preparation containing both broken and well-shaped EV were analyzed as described (experimental protocol from point 3.3). As a result, we found that 30 seconds of sonication decrease MFI that was completely dumped after 1 minute. At this timepoint, no fluorescence is detectable for any of the EV markers (Figure 3D).
Flow cytometry characterization of HEK293- and CPC-derived exosomes
These results were generated following the protocol presented above with the ultracentrifuge isolation method. The isolated exosomes are quantified by NTA technology and loaded overnight with 1 µL of mixed beads (1x anti-CD9:1x anti-CD63:1x anti-CD81). The complex beads + Exo were stained with the proper amount of antibody anti-CD9_FITC, anti-CD63_PE, and anti-CD81_PE (Figure 3E,F and Table 2).
Furthermore, by using EV-CPC we compared FC analysis with or without pre-enrichment by ultracentrifugation. Figure 4 shows that both methods are suitable to profile Exo surface markers. Pre-enrichment of extracellular vesicles fraction greatly improves fluorescence intensity especially for CD63_PE and CD81_PE staining (Figure 4 and Table 3).
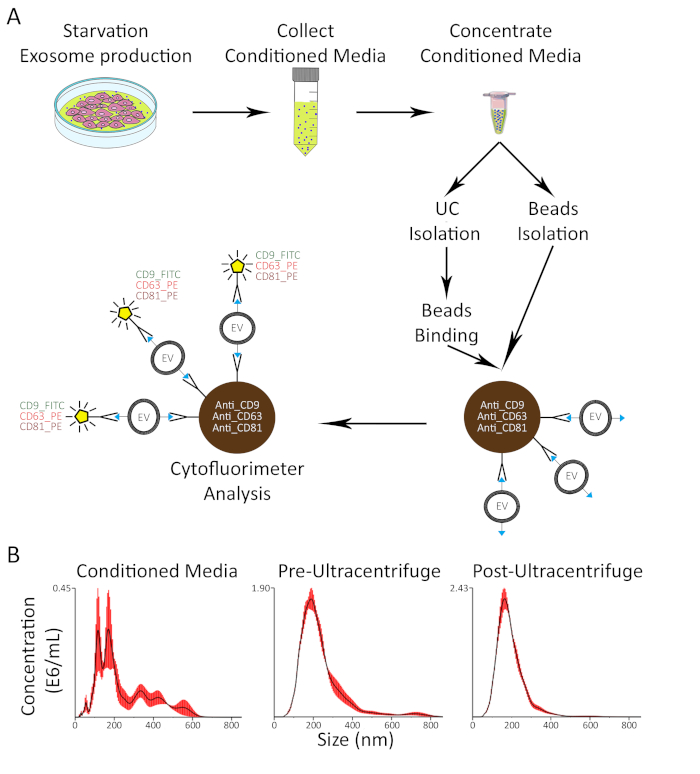
Figure 1: Protocol and NTA plots. (A) Schematic representation of the experimental protocol. (B) Representative NTA plots for Conditioned Media, Pre-Ultracentrifuge and Post-Ultracentrifuge step. Please click here to view a larger version of this figure.
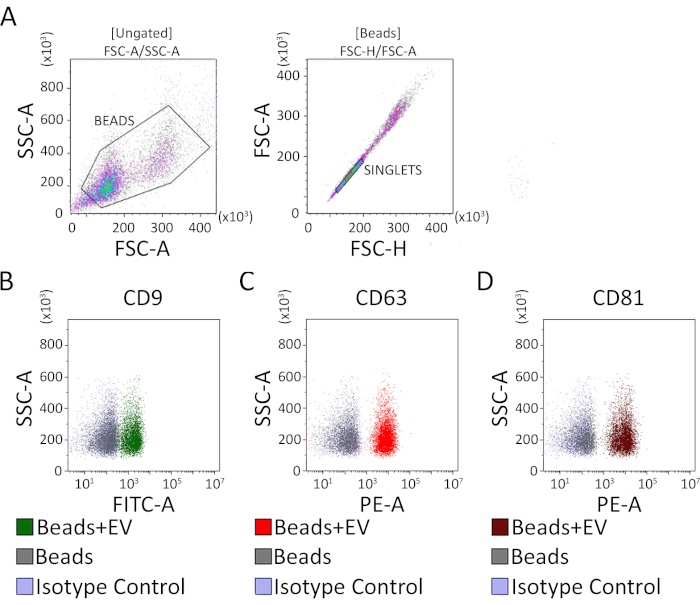
Figure 2: Acquisition and data analysis. (A) Flow cytometry analysis begins with creating a first gate to the whole beads population "beads" (excluding debris) and then a second gate to distinguish "singlets" events. Singlets are gated on a plot set up with FSC-H as x-axis and FSC-A as y-axis. (B-D) Representative dot plots showing right-shift of fluorescence intensity for the positive populations of beads-exosomes complexes (green, CD9+; red CD63+; brown CD81+). Isotype control (violet) overlap negative gray colored beads. Please click here to view a larger version of this figure.
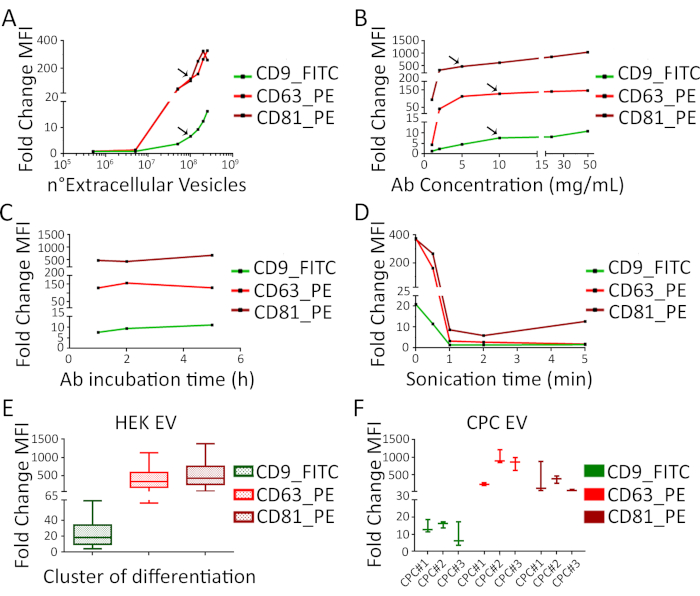
Figure 3: Titration curves for number of particles (arrows show the selected amount of particles, 1 x 10⁸). (A) Antibody concentrations (arrows show the selected concentration for each used antibody). (B) Both number of particles and antibody concentration are plot vs. mean fluorescence intensity (MFI). (C) Curve showing 3 different acquisition of the preparation with 1–2 h or 5 h of antibody incubation. (D) Curve showing the decrease of fluorescence following sonication at different time-points. (E-F) Fold change (mean ± SD) of MFI for CD9, CD63 and CD81 vs negative control (beads + antibodies, no EV) are shown for HEK293 EV (n = 3 independent replicates) and for CPC EV (n = 3 primary cell lines from 3 different patients) Please click here to view a larger version of this figure.
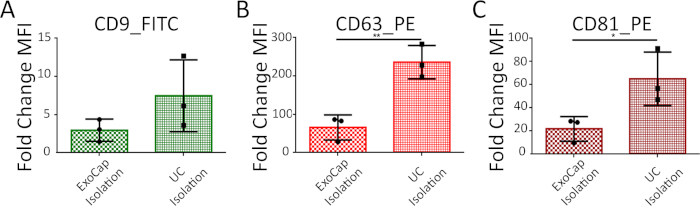
Figure 4: MFI analysis and comparison between two procedures: direct EV-binding with beads (Capture Beads Isolation) and pre-enrichment with ultracentrifuge (Ultracentrifuge Isolation). Data are shown as fold change (mean ± SD) of MFI for (A) CD9, (B) CD63, and (C) CD81 vs. negative control (beads + antibodies, no EV). N = 3 primary cell lines from 3 different patients. Please click here to view a larger version of this figure.
CPC | CONC NTA (part/µL) | CONC (µg/µL) |
CPC#1 Pre-Ultracentrifuge | 5.02E+06 | 2.01 |
CPC#1 Post-Ultracentrifuge | 6.10E+07 | 1.04 |
CPC#2 Pre-Ultracentrifuge | 5.74E+06 | 2.30 |
CPC#2 Post-Ultracentrifuge | 7.43E+07 | 0.79 |
CPC#3 Pre-Ultracentrifuge | 2.02E+06 | 1.90 |
CPC#3 Post-Ultracentrifuge | 2.91E+07 | 0.42 |
Table 1: Comparison between NTA concentration and protein concentration for 3 different patient derived CPC before and after ultracentrifuge.
FOLD CHANGE OF MFI ± SD | CD9 | CD63 | CD81 |
HEK293 | 24.44 ± 19.17 | 430.7 ± 344.9 | 535.2 ± 410.3 |
CPC#1 | 14.15 ± 3.72 | 236.05 ± 43.40 | 353.30 ± 452.43 |
CPC#2 | 15.76 ± 1.87 | 983.06 ± 195.63 | 374.45 ± 108.05 |
CPC#3 | 8.94 ± 7.19 | 830.50 ± 184.73 | 60.05 ± 23.18 |
Table 2: Value of fold change (mean ± SD) of MFI for HEK293 EV (n = 3 independent replicates) and CPC EV (n = 3 primary cell lines from 3 different patients).
FOLD CHANGE OF MFI ± SD | CD9 | CD63 | CD81 |
Capture Beads Isolation | 2.96 ± 1.45 | 65.65 ± 18.87 | 21.85 ± 6.12 |
Ultracentrifuge Isolation | 7.47 ± 2.71 | 236.00 ± 25.06 | 65.05 ± 13.38 |
Table 3: Value of fold change of MFI (mean ± SD) for CPC EV (n = 3 primary cell lines from 3 different patients) isolated by capture beads or ultracentrifuge.
Table 4: Single product specification.
Conventional FC technique remains the most straightforward analytic method to characterize markers expressed onto the surface of EV. In this regard, selecting the most appropriate protocol is crucial to obtain useful information on individual particle fractions of interest by avoiding limitations due to instrument sensitivity. We described a method using magnetic particles coupled with antibodies that recognize Exo and small EV surface antigens which are suitable for downstream FC application. We validated the method using two different cell types: primary human CPC that are emerging as a major cell source for Exo-based therapeutic approaches for heart disease; and HEK293 cells, an immortalized cell line widely used in cell biology research because of reliable cell growth and plasticity.
The method can be applied to ultracentrifuge-enriched EV and, for faster analysis, also directly on in vitro cell-derived CM with no pre-enrichment by ultracentrifugation. The starting material is critical when comparing samples. Adding capturing beads directly to the CM will speed up the procedure but at the same time decrease fluorescence intensity, as shown in Figure 4A. It is also critical to use an appropriate amount of PBS to mix beads and EV during the “capturing” step 4.4. When using a constant incubation time, an increased volume will decrease fluorescence intensity due to inefficient EV coupling.
A limitation of the protocol is that a single capture bead can bind multiple EV/Exo particles on its surface. This will limit the possibility of identifying subsets of EV expressing peculiar combination of antigens using a multiple staining. The bead-based method therefore yields semi-quantitative data. Using beads carrying a single capturing Ab (CD9, CD63 or CD81) will allow at maximum the characterization of particles that express two epitopes: the one present on the bead and recognized by the capturing antibody and the one detected by the antibody that is subsequently added.
The current gold standard for Exo analyses using FC is a protocol developed by van der Vlist et al. in 201215. It allows for a high-resolution analysis of EV using an optimized configuration of the commercially available high-end FC (e.g., BD Influx). This protocol is extremely detailed and useful but still needs a complex hardware setting with specific FC calibration before use. Three years later, Pospichalova et al.16 proposed a simplified protocol for FC analysis of Exo using a dedicated cytometer specifically developed for analysis of small particles (e.g., Apogee A50 Micro)17. With respect to this protocol and others that have used special threshold setting11, here we propose a basic protocol to perform small EV phenotyping using magnetic binding beads that is suitable for conventional FC instruments and does not require any special setting. Different protocols have described bead-based methods to characterize small EV found in bodily fluids by FC12. Here, we show the immunocapture of discrete sub-populations of vesicles positive for CD9, CD63, and CD81 that are commonly used as Exo markers18. Aldehyde-sulfate latex19,20 and polystyrene12beads remain valid alternatives for binding of EV present in CM and blood plasma fluid; however, aldehyde groups exposed on the surface of the polymer particle enable coupling of unspecific proteins and other materials to the latex particles, thus increasing the risk of contamination by lipoprotein or apoptotic bodies during isolation and detection process21,22.
Beads used in the protocol bind only entire, well-shaped EV. We proposed to disrupt EV structure by sonication to quench the signal (section 4, “protocol validation”). Indeed, one minute of sonication results in diminished fluorescence intensity, thus showing that a positive signal cannot be affected by membrane debris adsorbed on beads.
The authors have nothing to disclose.
L.B. was supported by research grants of Helmut Horten Stiftung and Velux Stiftung, Zurich (Switzerland). G.V. was supported by research grants of Swiss National Science Foundation, the Cecilia-Augusta Foundation, Lugano, and the SHK Stiftung für Herz- und Kreislaufkrankheiten (Switzerland)
IMDM | Gibco | 12440061 | |
Amicon Ultra-15, PLHK Ultracel-PL Membran, 100 kDa | Millipore | UFC910024 | |
CytoFlex, Flow Cytometer Platform | Beckman Coulter | CytoFlex | |
DMEM, high glucose, HEPES, no phenol red | Gibco | 21063045 | |
Dulbecco's PBS (PBS) Ca- and Mg-free | Lonza | BE17-512F | |
ExoCap CD63 Capture Kit | JSR Life Sciences | Ex-C63-SP | |
ExoCap CD81 Capture Kit | JSR Life Sciences | Ex-C81-SP | |
ExoCap CD9 Capture Kit | JSR Life Sciences | Ex-C9-SP | |
Exosome-Depleted FBS | Thermofisher | A2720801 | |
Exosome-depleted FBS Media Supplement | SBI | EXO-FBS-250A-1 | |
FBS-Fetal Bovine Serum | Gibco | 10270106 | |
FITC anti-human CD9 Antibody | Biolegend | 312104 RRID: AB_2075894 | |
Flow Cytometer analysis software | Beckman Coulter | Kaluza | |
NanoSight LM10 | Malvern | NanoSight LM10 | |
NanoSight Software | Malvern | NTA 2.3 | |
Optima Max-XP | Beckman Coulter | 393315 | |
PE anti-human CD63 Antibody | Biolegend | 353004 RRID:AB_10897809 | |
PE anti-human CD81 (TAPA-1) Antibody | Biolegend | 349505 RRID:AB_10642024 | |
Penicillin-Streptomycin | Gibco | 15140122 | |
Thermomixer C | Eppendorf | 5382 000 015 | |
TLA-110 | Beckman Coulter | TLA-110 rotors |