Co-translational interactions play a crucial role in nascent-chain modifications, targeting, folding, and assembly pathways. Here, we describe Selective Ribosome Profiling, a method for in vivo, direct analysis of these interactions in the model eukaryote Saccharomyces cerevisiae.
In recent years, it has become evident that ribosomes not only decode our mRNA but also guide the emergence of the polypeptide chain into the crowded cellular environment. Ribosomes provide the platform for spatially and kinetically controlled binding of membrane-targeting factors, modifying enzymes, and folding chaperones. Even the assembly into high-order oligomeric complexes, as well as protein-protein network formation steps, were recently discovered to be coordinated with synthesis.
Here, we describe Selective Ribosome Profiling, a method developed to capture co-translational interactions in vivo. We will detail the various affinity purification steps required for capturing ribosome-nascent-chain complexes together with co-translational interactors, as well as the mRNA extraction, size exclusion, reverse transcription, deep-sequencing, and big-data analysis steps, required to decipher co-translational interactions in near-codon resolution.
Selective Ribosome Profiling (SeRP) is the only method, to date, that captures and characterizes co-translational interactions, in vivo, in a direct manner1,2,3,4,5,6. SeRP enables global profiling of interactions of any factor with translating ribosomes in near codon resolution2,7.
The method relies on flash freezing of growing cells and preserving active translation. Cell lysates are then treated with RNase I to digest all mRNA in the cell except ribosome-protected mRNA fragments termed "ribosome footprints". The sample is then split into two parts; one part is directly used for the isolation of all the cellular ribosomal footprints, representing all ongoing translation in the cell. The second part is used for the affinity-purification of the specific subset of ribosomes associated with a factor of interest, for example: modifying enzymes, translocation factors, folding chaperones, and complex-assembly interactions. The affinity-purified ribosomal footprints are collectively termed the interactome. Then, the ribosome-protected mRNAs are extracted and used for cDNA library generation, followed by deep sequencing.
Comparative analysis of the total translatome and interactome samples allows for the identification of all orfs which associate with the factor of interest, as well as characterization of each orf interaction profile. This profile reports the precise engagement onset and termination sequences from which one can infer the decoded codons and the respective residues of the emerging polypeptide chain, as well as on the ribosome speed variations during the interaction7,8. Figure 1 depicts the protocol as a schematic.
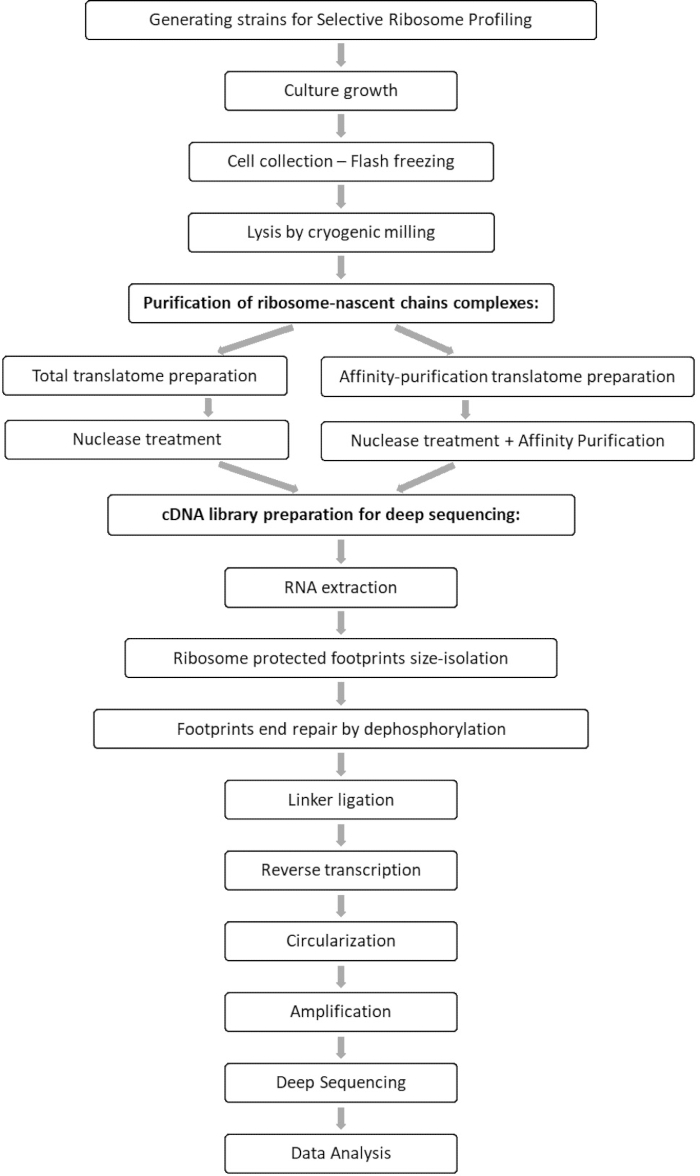
Figure 1: An overview of the SeRP protocol. This protocol can be performed in its entirety within 7-10 days. Please click here to view a larger version of this figure.
1. Generating strains for Selective Ribosome Profiling
NOTE: Selective Ribosome Profiling (SeRP) is a method that relies on affinity purification of factors of interest, to assess their mode of interaction with ribosomes-nascent chain complexes. Homologous recombination9, as well as CRISPR/Cas910 based methods are utilized to fuse various factors of interest with tags for affinity purifications. Such tags are GFP, for GFP-trap affinity purifications, TAP-tag for IgG-Sepharose beads purifications as well as AVI-Tag purified by avidin or streptavidin, to list a few successful examples from recent years.
2. Culture growth
3. Cell collection and lysis
Reagent | Amount per sample (µL) | Final concentration |
10 mg/mL CHX (cycloheximide) | 220 | 0.5 mg/mL |
1M Tris-HCl pH 8.0 | 88 | 20 mM |
3M KCl | 205.7 | 140 mM |
1M MgCl2 | 26.4 | 6 mM |
1M PMSF | 4.4 | 1 mM |
NP-40 | 4.4 | 0.10% |
Protease inhibitor | 2 tablets | |
DNase I | 8.8 | 0.02 U/mL |
Final volume | 4,400 |
Table 1: Recipe for the lysis buffer master mix.
NOTE: Lysis buffer can be altered to contain more protease inhibitors (such as bestatin, leupeptin, aprotinin, etc.) in case the protein of interest is very unstable, but it is important to avoid EDTA in order to maintain the ribosome's small and large subunits assembled during the following steps. For similar reasons, always maintain at least 6 mM MgCl2 in the buffer solution.
CAUTION: HCl is highly corrosive and PMSF is toxic. Wear gloves and handle with care.
4. Purification of ribosome-nascent-chains complexes for SeRP
Reagent | Amount per sample (µL) | Final concentration |
50% Sucrose | 200 | 25% |
1M Tris-HCl pH 8.0 | 8 | 20 mM |
3M KCl | 18.7 | 140 mM |
1M MgCl2 | 4 | 10 mM |
100 mg/mL CHX | 0.4 | 0.1 mg/mL |
Protease inhibitor | 1 tablet | |
Final volume | 400 |
Table 2: Recipe for sucrose cushion master mix.
Reagent | Amount per sample (µL) | Final concentration |
10 mg/mL CHX | 50 | 0.1 mg/mL |
1M Tris-HCl pH 8.0 | 100 | 20 mM |
3M KCl | 233 | 140 mM |
1M MgCl2 | 50 | 10 mM |
1M PMSF | 5 | 1 mM |
NP-40 | 0.5 | 0.01% |
Protease inhibitor | 2 tablets | |
50% Glycerol | 1,000 | 10% |
Final volume | 5,000 |
Table 3: Recipe for the wash buffer master mix.
5. cDNA library preparation for deep sequencing
Reagent | Amount per sample (µL) | Final concentration |
50% sterile-filtered PEG 8000 | 16 | 20% |
DMSO | 4 | 10% |
10× T4 RNA ligase 2 buffer | 4 | 1x |
SUPERase-In RNase Inhibitor | 2 | 2 U |
10 mM adenylated linker 3-L1 | 0.1 | 25 µM |
DEPC-treated water | 2.9 | |
Final volume | 29 |
Table 4: Recipe for 3' end ligation master mix.
Reagent | Amount per sample (µL) | Final concentration |
10 mM dNTPs | 1 | 0.5 mM |
25 µM Linker L(rt) | 0.5 | 625 nM |
DEPC-treated water | 1.5 | |
Final volume | 3 |
Table 5: Recipe for the reverse transcription buffer master mix prior to nucleic acids' denaturation.
Reagent | Amount per sample (µL) | Final concentration |
5× FS buffer | 4 | 1x |
SUPERase-In RNase Inhibitor | 1 | 2 U |
DTT 0.1 M | 1 | 5 mM |
Final volume | 6 |
Table 6: Recipe for the reverse transcription buffer master mix after nucleic acids' denaturation.
Reagent | Amount per sample (µL) | Final concentration |
10× CircLigase II buffer | 2 | 1x |
5 M Betaine (optional) | 1 | 0.25 M |
50 mM MnCl2 | 1 | 2.5 mM |
Final volume | 4 |
Table 7: Recipe for ssDNA circularization master mix.
Reagent | Amount per sample (µL) | Final concentration |
DEPC-treated water | 61.6 | |
5× Phusion HF reaction buffer | 17.6 | 1x |
10 mM dNTPs | 1.8 | 200 µM |
100 µM PCR forward primer | 0.2 | 225 nM |
HF Phusion polymerase | 0.8 | 1.6 U |
Final volume | 82 |
Table 8: Recipe for PCR amplification master mix.
Cycle | Denature (98 °C) | Anneal (60 °C) | Extend (72 °C) |
1 | 30 s | ||
2-16 | 10 s | 10 s | 5 s |
Table 10: PCR program for PCR reaction.
6. Data analysis
As illustrated in the flow chart of this protocol (Figure 1), cells were grown to log phase, and then collected swiftly by filtration and lysed by cryogenic grinding. The lysate was then divided into two: one for total ribosome-protected mRNA footprints and the other for selected ribosome-protected mRNA footprints, on which we performed affinity purification to pull-down the tagged protein-ribosome-nascent chains complexes. We ensured tagged protein expression and the success of the pull-down by western blot analysis, as can be seen in Figure 2. We validated the isolation of ribosome-protected footprints, which are typically 20-45 nt long by small RNA electrophoresis (2100 BioAnalyzer system), allowing for 5-10 nt shift in size detection, according to the system manual (Figure 3). Then, we generated a cDNA library for deep sequencing and big-data analysis. While generating the cDNA library, note that under-cycling can lead to low yield (as can be seen in lane 2 in Figure 3), but re-amplification is possible in order to recover the generated library. Over-cycling may occur when PCR primers are depleted but the reaction continues. When dNTPs are still present, the reaction proceeds, generating longer PCR artifacts with chimeric sequences due to PCR products priming themselves13 (as can be seen in lanes 3-4 in Figure 3, indicated by the visible smear). If the dNTPs' concentration also becomes limiting, products indicating the presence of heteroduplexes composed of only partially homologous library fragments can appear. Figure 4 acts as a reference, with lane 2 representing optimal amplification, and lane 3 an acceptable amplification. Samples from lanes 4 and 5 (cycles 10 and 11) should not be used due to the possibility of introducing PCR duplicates and artifacts. The generated library was further validated by high sensitivity DNA electrophoresis (the same BioAnalyzer system was used) for exact size distribution and quantification (Figure 5). After 3' end linker ligation, reverse transcription and PCR amplification, a cDNA length distribution as such is expected, with a sharp peak around 175 nt.
We trimmed and removed adapters and barcodes from the sequenced library, and only the reads between 20 and 45 nt were selected for further analysis. Figure 6 shows the resulting length distribution. The reads were divided into different groups of: coding sequences, introns, and intergenic sequences (Figure 7), and further classified as shown in Figure 8.
Final analysis for detection and characterization of co-translational interactions was performed based on the enrichment of ribosome-protected mRNA fragments, producing the graphs in Figure 9. We compared the normalized ribosome occupancy (at each nucleotide along each orf) of the total translatome to its corresponding selected translatome (nascent-interactome). Per nucleotide comparison eliminates translation rates artifacts. Reproducibility between biological replicates was evaluated by Pearson correlation (threshold > 0.6). We present Selective Ribosome Profiles, analyzing co-translational interactions of Vma2p with three proteins: the ribosome-associated chaperone Ssb1p, Pfk2p (Phosphofructokinase) and Fas1p (Fatty acid synthase), with each protein C` terminally tagged by GFP. We performed the protocol in biological replicates. Figure 9 A, D and G shows the experimental scheme of each affinity purification. We next show the ribosome occupancy of total translatomes compared to Ssb1 interactomes along the Vma2p orf, encoding for a subunit of the vacuolar H+-ATPase (Figure 9 B, E and H). Finally, we performed ratio-based ribosome-enrichment profiling (IP/Total) at each ribosome position in [codon/aa] along the orf (Figure 9 C, F and I). Comparing the co-translational interactions of these three proteins with Vma2p, which is being synthesized by the ribosome, revealed that Ssb1 chaperone engages the nascent Vma2p at four different regions along the orf, as we identified four significant enrichment peaks by SeRP. Differently, Pfk2p shows only one significant enrichment peak, as identified by SeRP, in a different position compared to the co-translational chaperone Ssb1. Analysis of Fas1 co-translational interactions with nascent Vma2p did not detect any significant enrichment. Thus, the comparison of these ratio-based enrichment ribosome profiles demonstrates this protocol`s power in detection and characterization of various co-translational interactions in near codon-resolution.
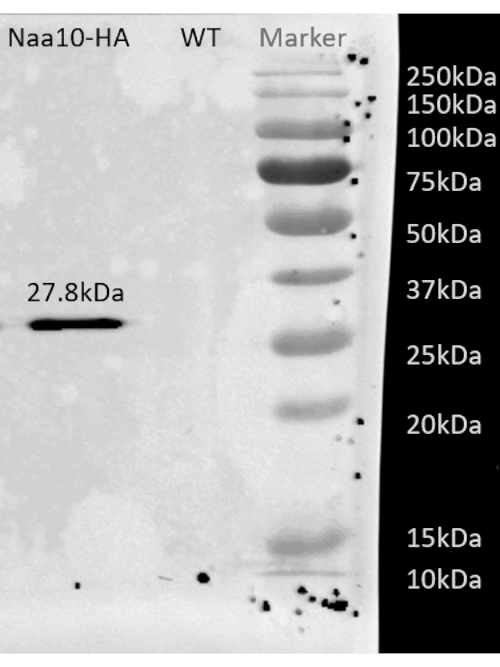
Figure 2: Representative western blot result after affinity purification of BY4741 strain with HA-tagged Naa10. Representative western blot result after affinity purification of BY4741 strain with HA-tagged Naa10 showing a band around 27.8 kDa, while the wild-type, as a negative control, shows no band. Please click here to view a larger version of this figure.
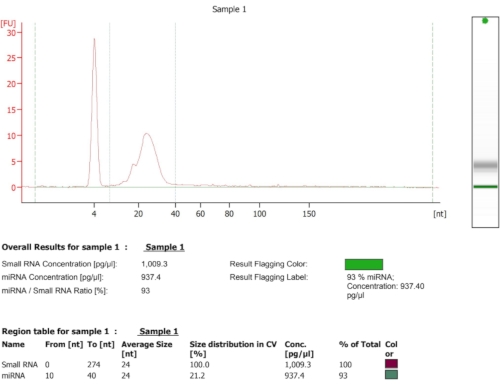
Figure 3: Representative BioAnalyzer result after footprint isolation and RNA extraction with acid-phenol:chloroform, and an average size of 25 nt. Please click here to view a larger version of this figure.
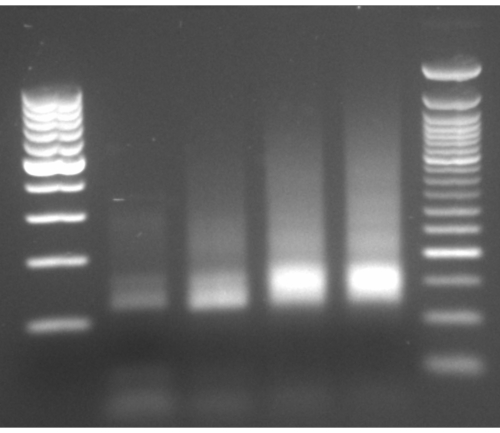
Figure 4: Representative gel-electrophoresis of PCR amplification. Representative gel-electrophoresis of PCR amplification with lanes 2-5 loaded with PCR products from cycles 8-11, and ladders on both sides. Please click here to view a larger version of this figure.
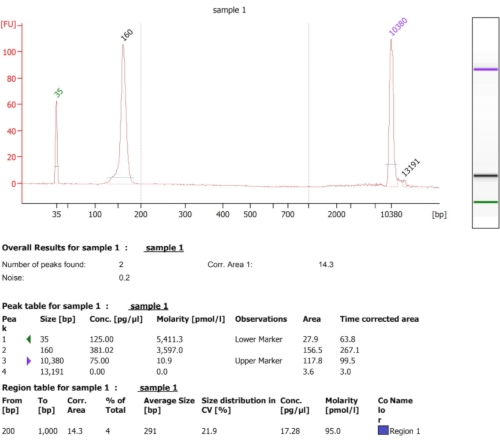
Figure 5: Representative BioAnalyzer result obtained following the creation of a cDNA library. Please click here to view a larger version of this figure.
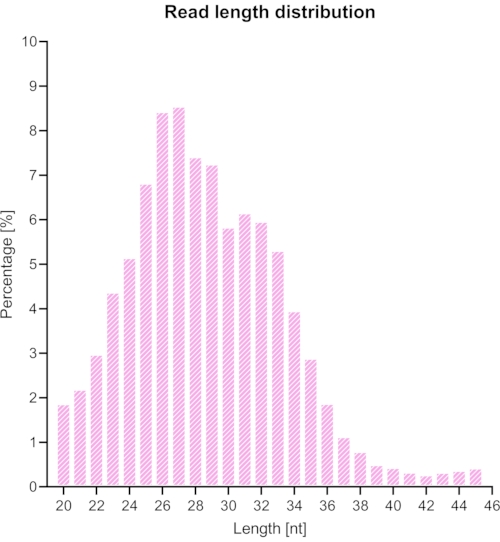
Figure 6: Expected length distribution of reads after the removal of the adaptors with Cutadapt (removing reads shorter than 20 or longer than 45). Please click here to view a larger version of this figure.
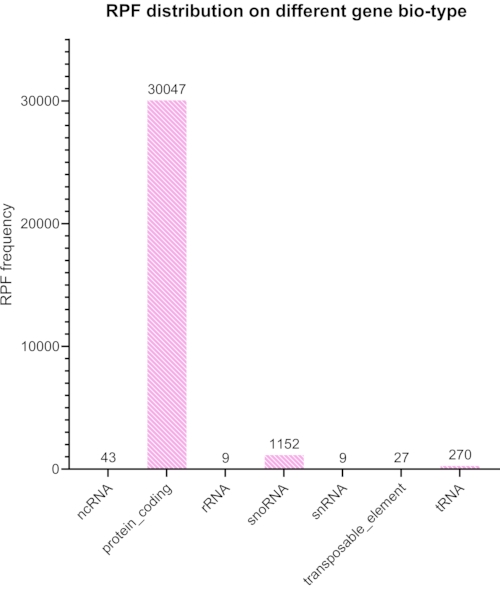
Figure 7: Expected alignment success percentage after removing non-coding RNA reads with Bowtie2 and using TopHat to align the remaining reads to different organisms. The sample was taken from S. cerevisiae (a mutated variant of BY4741). Please click here to view a larger version of this figure.
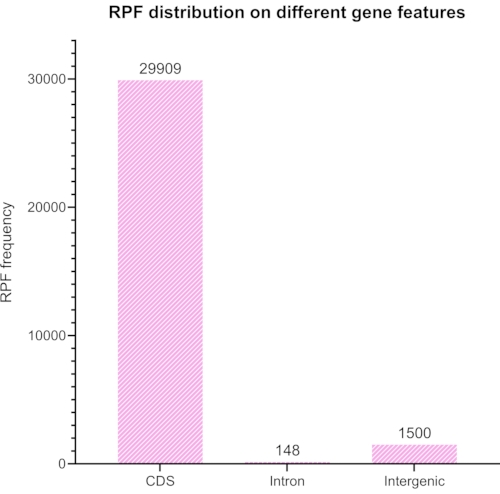
Figure 8: A graph generated with RiboToolkit representing expected coding versus non-coding ratio of aligned reads after using Bowtie2 to remove rRNA elements in the reads. Please click here to view a larger version of this figure.
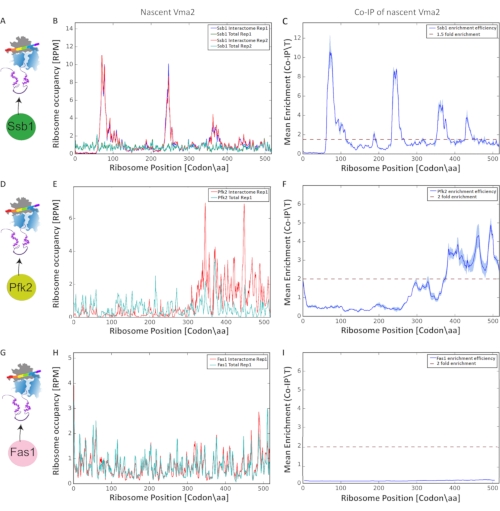
Figure 9: Co-translational interactions of three different proteins: Ssb1p, Pfk2p, and Fas1p with Vma2p, which is being synthesized by the ribosome, analyzed by SeRP. All y axes are shown in reads per million (RPM) reads.(A, D, G) Experimental scheme of SeRP of Ssb1p, Pfk2p, and Fas1p C` terminally tagged by GFP, respectively. (B, E, H) Ribosome occupancy along the orf of total translatomes compared to Ssb1, Pfk2p, and Fas1p interactomes, respectively (in biological replicates). (C, F, I) Mean enrichment of Ssb1p, Pfk2p, and Fas1p (IP/Total ratio) at each ribosome position in [codon/aa] along the orf, respectively. Variation between biological replicates is indicated by the shaded area. Please click here to view a larger version of this figure.
Table 9: 3' Linker and primer sequences. 3' Linker L1: Linker 3-L1 with 5ʹ adenylation and 3ʹ dideoxy-cytidine unique molecular identifiers ('NN…') (RNase-free HPLC purification; Reverse transcription linker: reverse transcription (L(rt)) with 5ʹ phosphorylated, unique molecular identifiers (RNase-free HPLC purification); PCR forward primer: PCRf; HPLC purified. Please click here to download this Table.
Supplementary File. Please click here to download this File.
Here, the protocol details the Selective Ribosome Profiling approach for capturing co-translational interactions in near codon resolution. As the ribosome rises as a hub for coordinating the nascent-chain emergence into the crowded cytoplasm, this is a crucial method to identify and characterize the various co-translational interactions required to ensure a functional proteome, as well as for studying various diseases. To date, SeRP is the only method that can capture and characterize these interactions, in a direct manner, in vivo14,15,16.
The first and most critical step is cell collection and lysis. It is imperative to capture, within seconds, ongoing translation, by flash-freezing followed by lysis in a frozen state. Cells collection must be done with haste in order to avoid ribosomal runoff as well as inducing stress translational responses, which can occur rapidly. The second critical step is the affinity purification step. It is imperative to reduce background binding by stringent washing while making sure the co-translational interactions are maintained, which can be facilitated by in vivo cross-linking. As this protocol is based on the highly sensitive NGS (Next Generation Sequencing) high background in the first steps can be amplified in the following cDNA library preparation steps, leading to low signal-to-noise ratios.
Nuclease treatment, to digest all non-protected mRNAs should be evaluated by polysome profiling17 together with careful evaluation of the isolated ribosomal footprints size distribution (as detailed above) to avoid over or under RNA digestion. Calibration of Nuclease concentration and digestion times can facilitate accurate footprint recovery, as over-digestion can lead to ribosomal rRNA digestion, leading to loss of ribosome-protected footprints. It is important to note that under-digestion can also lead to lower discovery rates of ribosome-protected footprints, as the cDNA library preparation steps, as well as data analysis steps described here discard long, uncharacteristic reads.
While rRNA depletion not always constitutes a critical step and is not mandatory, it has some advantages such as cleaner samples and, therefore, a higher rate of genome-mapped reads. On the other hand, there is the possibility of biases, as many rRNA depletion protocols might also cause depletion of the desired ribosome-protected fragments. One should also take into consideration the costs of the rRNA depletion kits. rRNA depletion can be performed after the ribosome-foot print isolation step or after the cDNA circularization step.
cDNA library preparation steps as described here, have been optimized for low mRNA input, as the affinity and ribosome purification steps highly reduce the mRNA input amount, as compared to RNA-seq expression studies. Upscaling the initial amount of cell cultures can greatly facilitate cDNA library generation. Alternatively, any cDNA library protocol of choice can fit with the affinity purification and footprint isolation steps described here. It is important to note that the Nuclease treatment generating the ribosomal footprints requires the resulting mRNA ends repair (cDNA library preparation, Dephosphorylation step) to allow following linker ligation steps in the cDNA protocol described here on in your protocol of choice.
During sequencing, it is important to differentiate SeRP from RNA-Seq, as the generated libraries' heterogeneity greatly varies, depending on the affinity tagged factors. Molecular chaperones and targeting factors are often more promiscuous in binding, interacting with hundreds or thousands of substrates during translation, leading to highly diverse cDNA libraries. However, highly specific interactors, such as co-translational complex assembly interactors can often lead to the generation of much less diverse cDNA libraries. Spike in of diverse and non-diverse libraries on the same lane can greatly improve sequencing and following data analysis results.
Another unique feature of SeRP is its ability to capture local variations in ribosome occupancies along the orf allowing for the discovery of ribosomal shifts in translation rate associated with each set of interactions. It is therefore imperative to compare ribosome occupancies in each codon along the orf to correctly identify enrichment. Utilizing orfs averages can lead to loss of transient interactions or false discovery.
Correct use of the SeRP method opens many co-translational pathways to direct analysis, discovering novel mechanistic features as well as novel ribosome-associated factors, revolutionizing the protein-biosynthesis field.
The authors have nothing to disclose.
We would like to thank all the lab members for fruitful discussions and Muhammad Makhzumy for the critical reading of the manuscript. This work was funded by ISF (Israeli Science Foundation) grant 2106/20.
3'-Phosphorylated 28 nt RNA control oligonucleotide | IDT | custom order | RNase free HPLC purification; 5'-AUGUAGUCGGAGUCGAGGCGC GACGCGA/3Phos/-3' |
Absolute ethanol | VWR | 20821 | |
Acid phenol–chloroform | Ambion | AM9722 | |
Antibody: mouse monclonal anti-HA | Merck | 11583816001 | 12CA5 |
Aprotinin | Roth | A162.3 | |
ATP* | NEB | P0756S | 10 mM |
Bacto agar | BD | 214030 | |
Bacto peptone | BD | 211820 | |
Bacto tryptone | BD | 211699 | |
Bacto yeast extract | BD | 212720 | |
Bestatin hydrochloride | Roth | 2937.2 | |
Chloroform | Merck | 102445 | |
CircLigase II ssDNA Ligase* | Epicentre | CL9025K | 100 U/μL |
Colloidal Coomassie staining solution | Roth | 4829 | |
cOmplete, EDTA-free protease inhibitor cocktail tablets | Roche Diagnostics | 29384100 | |
Cycloheximide | Biological Industries | A0879 | |
DEPC treated and sterile filtered water* | Sigma | 95284 | |
D-Glucose anhydrous | Merck | G5767-500G | |
Diethylpyrocarbonate | Roth | K028 | |
Dimethylsulfoxide* | Sigma-Aldrich | 276855 | |
DNA ladder, 10 bp O'RangeRuler* | Thermo Fisher Scientific | SM1313 | |
DNA loading dye* | Thermo Fisher Scientific | R0631 | 6× |
DNase I, recombinant | Roche | 4716728001 | RNAse free |
dNTP solution set* | NEB | N0446S | |
EDTA* | Roth | 8043 | |
Glycerol | VWR | 24388.260. | |
Glycine solution | Sigma-Aldrich | 67419-1ML-F | 1 M |
GlycoBlue | Ambion | AM9516 | 15 mg/mL |
HEPES | Roth | HN78.3 | |
HF Phusion polymerase* | NEB | M0530L | |
HK from S. cerevisiae | Sigma-Aldrich | H6380-1.5KU | |
Hydrochloric acid | AppliChem | A1305 | |
Isopropanol | Sigma-Aldrich | 33539 | |
Isopropyl β-D-1-thiogalactopyranoside | Roth | CN08 | |
Kanamycin | Roth | T832.4 | |
KCl | Roth | 6781.1 | |
KH2PO4 | Roth | 3904.1 | |
Leupeptin | Roth | CN33.4 | |
Linker L(rt) | IDT | custom order | |
Liquid nitrogen | |||
MgCl2 | Roth | KK36.3 | |
Na2HPO4 | Roth | P030.2 | |
Na2HPO4·2H2O | Roth | T879.3 | |
NaCl* | Invitrogen | AM97606 | 5 M |
NaH2PO4·H2O | Roth | K300.2 | |
NHS-activated Sepharose 4 fast-flow beads | GE Life Sciences | 17090601 | |
Nonidet P 40 substitute | Sigma | 74385 | |
Pepstatin A | Roth | 2936.2 | |
Phenylmethyl sulfonyl fluoride | Roth | 6367 | |
Precast gels | Bio-Rad | 5671034 | 10% and 12% |
RNase I | Ambion | AM2294 | |
SDS, 20% | Ambion | AM9820 | RNase free |
Sodium acetate* | Ambion | AM9740 | 3 M, pH 5.5 |
Sodium azide | Merck | S8032-100G | |
Sodium chloride | Roth | 9265 | |
Sodium hydroxide* | Sigma | S2770 | 1 N |
Sucrose | Sigma-Aldrich | 16104 | |
SUPERase-In RNase Inhibitor | Ambion | AM2694 | |
Superscript III Reverse Transciptase* | Invitrogen | 18080-044 | |
SYBR Gold* | Invitrogen | S11494 | |
T4 polynucleotide kinase* | NEB | M0201L | |
T4 RNA ligase 2* | NEB | M0242L | |
TBE polyacrylamide gel* | Novex | EC6215BOX | 8% |
TBE–urea polyacrylamide gel* | Novex | EC68752BOX | 10% |
TBE–urea polyacrylamide gel* | Novex | EC6885BOX | 15% |
TBE–urea sample buffer* | Novex | LC6876 | 2× |
Tris | Roth | 4855 | |
Tris* | Ambion | AM9851 | 1 M, pH 7.0 |
Tris* | Ambion | AM9856 | 1 M, pH 8.0 |
UltraPure 10× TBE buffer* | Invitrogen | 15581-044 | |
* – for library preparation | |||
gasket and spring clamp , 90 mm, | Millipore | XX1009020 | |
ground joint flask 1 L , | Millipore | XX1504705 |