This methodology article presents a software-assisted quantitative measurement protocol to quantify histologic subchondral bone thickness in murine osteoarthritic knee joints and normal knee joints as controls. This protocol is highly sensitive to subtle thickening and is suitable for detecting early osteoarthritic subchondral bone changes.
Subchondral bone thickening and sclerosis are the major hallmarks of osteoarthritis (OA), both in animal models and in humans. Currently, the severity of the histologic subchondral bone thickening is mostly determined by visual estimation based semi-quantitative grading systems. This article presents a reproducible and easily executed protocol to quantitatively measure subchondral bone thickness in a mouse model of knee OA induced by destabilization of the medial meniscus (DMM). This protocol utilized ImageJ software to quantify subchondral bone thickness on histologic images after defining a region of interest in the medial femoral condyle and the medical tibial plateau where subchondral bone thickening usually occurs in DMM-induced knee OA. Histologic images from knee joints with a sham procedure were used as controls. Statistical analysis indicated that the newly developed quantitative subchondral bone measurement system was highly reproducible with low intra- and inter-observer variabilities. The results suggest that the new protocol is more sensitive to subtle or mild subchondral bone thickening than the widely used visual grading systems. This protocol is suitable for detecting both early and progressing osteoarthritic subchondral bone changes and for assessing in vivo efficacy of OA treatments in concert with OA cartilage grading.
Osteoarthritis (OA), characterized radiographically by joint space narrowing due to the loss of articular cartilage, osteophytes, and subchondral bone (SCB) sclerosis, is the most common form of arthritis1,2. Although the role of peri-articular bone in the etiology of OA is not fully understood, osteophyte formation and SCB sclerosis are generally thought to be the results of the disease process rather than causative factors, but changes in peri-articular bone architecture/shape and biology may contribute to the development and progression of OA3,4. The development of an accurate and easily executed OA grading system, including SCB measurement, is critical for comparative studies among research laboratories and in evaluating the efficacy of therapeutic agents designed to prevent or attenuate OA progression.
SCB is built with a thin dome-like bone plate and an underlying layer of trabecular bone. The SCB plate is the cortical lamella, lying parallel to and immediately under the calcified cartilage. Small branches of arterial and venous vessels, as well as nerves, penetrate through the channels in the SCB plate, communicating between the calcified cartilage and the trabecular bone. The subchondral trabecular bone contains blood vessels, sensory nerves, bone marrow and is more porous and metabolically active than the SCB plate. Therefore, SCB exerts shock-absorbing and supportive functions and is also important for cartilage nutrient supply and metabolism in normal joints5,6,7,8.
SCB thickening (in histology) and sclerosis (in radiography) are the major hallmarks of OA and key research areas of OA pathophysiology. Measuring SCB thickening is an important component of histologic assessments of OA severity. Previously reported digital microradiography for measuring rodent SCB mineral density9 as well as micro-computed tomography (micro-CT) based quantitative SCB measurement in rodent models of OA10,11,12,13 have improved our understanding of SCB structure and the role of SCB changes in OA pathophysiology. SCB area and thickness has also been quantified with histological slides using a sophisticated computer system with specific and expensive bone histomorphometry software14. Nevertheless, visual estimate-based semi-quantitative OA grading systems, including SCB thickening grading, are more widely used than micro-CT at the present time because the grading systems are easy to use, particularly for screening numerous histologic images. However, most existing OA grading systems focus mainly on cartilage changes15,16,17. A widely used osteoarthritic SCB thickness grading method that categorizes SCB thickening as mild, moderate, and severe is largely subjective, and its reliability has not been fully validated15. A reliable and easily executed step-by-step osteoarthritic SCB thickness measurement protocol is either not fully developed or un-standardized.
This study aimed to develop a reproducible, sensitive, and easily executed protocol to quantitatively measure the SCB thickness in a mouse model of OA. Our rigorous measurement tests and statistical analysis demonstrated that this ImageJ software-assisted quantitative measurement protocol could quantify the SCB thickness in both normal and osteoarthritic knee joints. The newly developed protocol is reproducible and more sensitive to mild SCB changes than the widely used visual grading systems. It can be used for detecting early osteoarthritic SCB changes and for assessing in vivo efficacy of OA treatments in concert with OA cartilage grading.
All animal procedures included in this protocol were approved by the Institutional Animal Care and Use Committee (IACUC) at the University of Kansas Medical Center, in compliance with all federal and state laws and regulations.
1. Creation of knee OA in mice
2. Preparation of tissue sections and histologic images
3. Quantitative measurement of osteoarthritic subchondral bone with ImageJ software
4. Statistics
Reproducibility comparison between visual estimate grading and ImageJ-assisted quantitative measurement:
SCB thickness in 48 regions of interest (ROI) (24 MFC and 24 MTP), defined from a mid-section of each knee from 24 knees/animals was scored by three independent individuals using the existing 0-3 visual scoring scheme as described in the literature15,23, where 0 = normal (no SCB thickening), 1 = mild, 2 = moderate, and 3 = severe SCB thickening. These images were selected from three different postoperative time points at 2, 8, and 16 weeks after the DMM or sham procedure. Usually, mice with DMM procedure showed visual SCB thickening score 0 at 2 weeks post-operation, scores 1-2 at 8 weeks, and scores 2-3 at 16 weeks. The SCB thickness of these histologic images were then quantitatively measured by three other independent observers using ImageJ software to validate the reproducibility and sensitivity of the new scheme. Representative histologic images with or without an outlined ROI in MFC and MTP for visual grading or quantitative measurements are presented in Figure 2, in which examined images were divided into three groups: sham knee (visual score 0), DMM knee (visual score 0), and DMM knee (visual score 1-3).
Detailed comparative analyses of reproducibility between ImageJ-assisted quantitative measurement and visual estimate grading of SCB thickness are presented in Table 1. Correlation coefficient tests suggest that the quantitative measurement was relatively more reproducible than the visual estimate grading system.
Inter- and intra-observer reproducibility:
Correlation coefficient tests demonstrated high reproducibility of the ImageJ-assisted measurements with inter-observer correlation coefficients of >0.93 between Observer A, B, and C for the average of the first and second measurements in the MTP and MFC regions (Figure 3). Intra-observer variability analysis of the same set of histologic images also showed high reproducibility between the first and second measurement scores for each of the three observers with an intra-observer correlation coefficient of >0.95 for all observers (Figure 4).
Sensitivity:
To assess if the new quantitative SCB measurement system is more sensitive to osteoarthritic SCB thickening changes than the widely used visual grading system, 48 areas of interest of histologic images (24 MFC and 24 MTP) from 24 knees/animals were first assessed by three independent individuals who are experienced in OA histopathology and existing OA grading systems. SCB thickening was graded using a 0-3 visual scoring scheme as described above. ImageJ-assisted quantitative measurement was then performed on the same set of visually graded histologic images by another three individuals who were blinded to the visual OA grading results. SCB thickness of the MFC and MTP of each image was quantitatively measured with ImageJ as described in the Protocol section. The results demonstrated that the average SCB thickness (mm2/1.0 mm2) of the DMM images with visual SCB thickening scores 1-3 was significantly higher than that of the Sham images with a "0" visual thickening score. More importantly, the average SCB thickness of the DMM images with a "0" visual SCB thickening score was also significantly higher than that of the Sham images with a "0" visual score (Figure 5). The data strongly suggest that the ImageJ-assisted quantitative SCB measurement is more sensitive to the early and mild SCB thickening changes than the visual grading method.
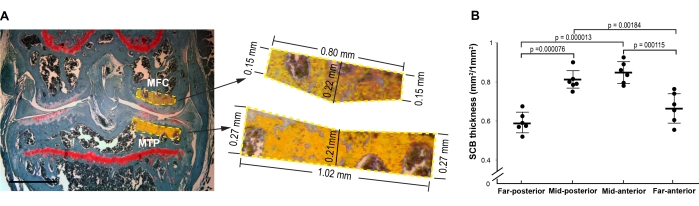
Figure 1: Histologic images with Safranin-O and fast green staining from Sham and DMM groups for ImageJ-assisted quantitative SCB measurement. (A) The boxes outlined with a dotted yellow line define the SCB region of interest (ROI). The area of bone substance within the boxes is highlighted in orange. The SCB thickness in the medial femoral condyle (MFC) and medial tibial plateau (MTP) can be quantified using ImageJ software. The exact dimensions of the ROI in MFC and MTP are enlarged to enhance the visibility. (B) SCB thickness of histologic images from far-posterior, mid-posterior, mid-anterior, and far-anterior areas of the MTP at 16 weeks post-DMM was quantified to assess area-specific SCB thickness. N = 6. Please click here to view a larger version of this figure.
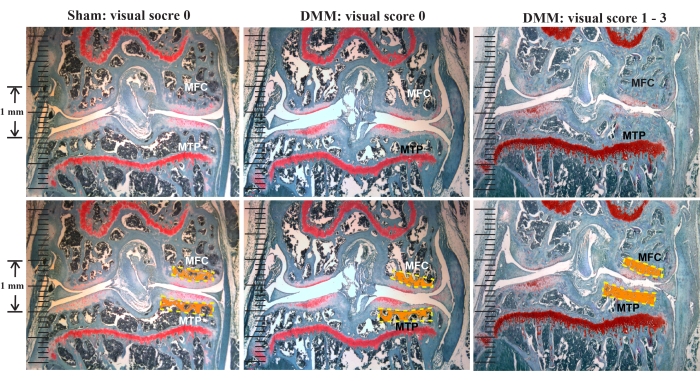
Figure 2: Representative histologic images with Safranin-O and fast green staining from Sham and DMM groups for visual SCB grading and quantitative SCB measurement. Upper panels: Photomicrographs of Sham and DMM groups for visual SCB grading. Lower panels: Photomicrographs of Sham and DMM groups for ImageJ-assisted quantitative SCB measurement. The boxes outlined with a dotted yellow line (made with Adobe illustrator) in MFC and MTP define the SCB region of interest. The area of bone substance (excluding bone marrow) within the boxes is highlighted in orange. Please click here to view a larger version of this figure.
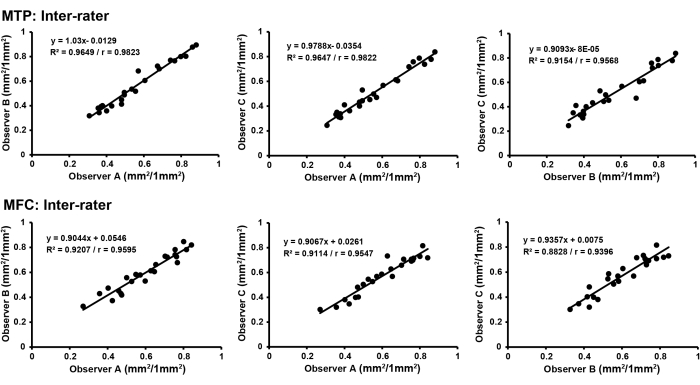
Figure 3: Inter-observer variation tests. Correlation coefficient analyses indicate a high reproducibility between three observers (Observers A, B and C) for SCB thickness averaged from the 1st and 2nd measurements in the MTP and MFC regions of interest. Please click here to view a larger version of this figure.
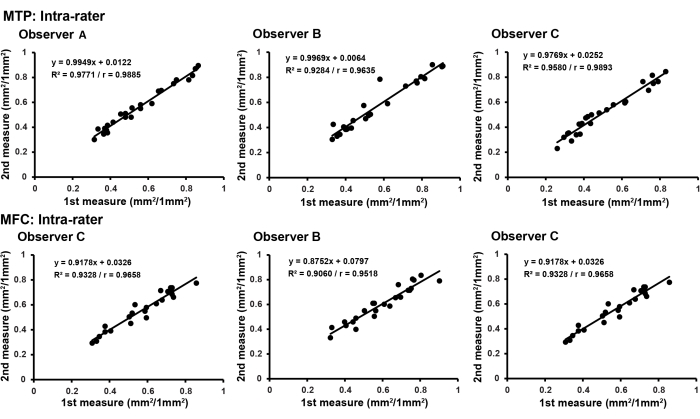
Figure 4: Intra-observer variation tests. Correlation coefficient analyses indicate a high reproducibility between the 1st and 2nd SCB thickness measurements in the MTP and MFC regions of interest for each of Observers A, B, and C. Please click here to view a larger version of this figure.
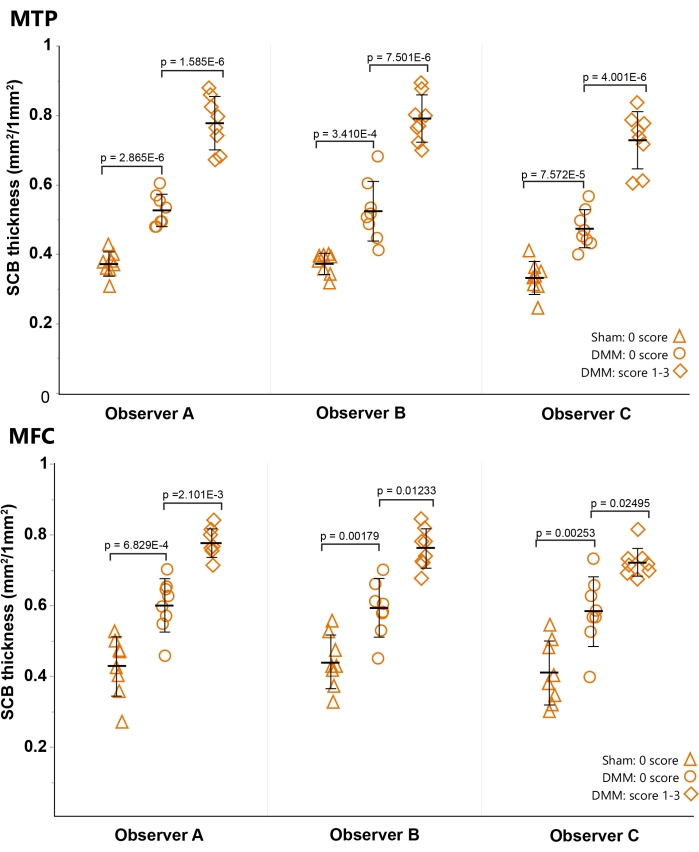
Figure 5: Comparative sensitivity analyses of visual grading and ImageJ-assisted quantitative measurement of SCB thickness in the MFC and MTP. The histologic images for visual estimate grading were divided to three groups (Sham with "0" SCB thickening score, DMM with "0" SCB thickening score, and DMM with SCB thickening score 1-3). Note: The quantitative SCB thickness values from all three observers for the DMM images with a "0" visual SCB thickening score were significantly higher than that of the Sham images with a "0" visual score, indicating that the quantitative measurement is more sensitive than the visual grading to mild SCB thickening. N = 6. Please click here to view a larger version of this figure.
Method | Observer/scorer | MTP | MFC |
Inter-observer correlation coefficient (r) | |||
Quantitative measurement | A vs. B | 0.9685 | 0.9421 |
A vs. C | 0.9413 | 0.9427 | |
B vs.C | 0.9109 | 0.9288 | |
Visual grading | D vs. E | 0.6455 | 0.6031 |
D vs. F | 0.6 | 0.7419 | |
E vs. F | 0.6454 | 0.603 | |
Intra-observer correlation coefficient (r) | |||
Quantitative measurement | A | 0.9818 | 0.9662 |
B | 0.9361 | 0.9177 | |
C | 0.9748 | 0.9357 | |
Visual grading | D | 0.4286 | 0.6396 |
E | 0.5 | 0.7746 | |
F | 0.7071 | 0.6396 |
Table 1: Reproducibility comparison between software-assisted quantitative measurement and visual estimate grading for SCB thickness.
Measuring SCB thickening is an important component of histologic assessments of OA severity. Most existing OA grading systems focus mainly on cartilage changes15,16,17. A widely used murine osteoarthritic SCB thickness grading method that categorizes SCB thickening as mild, moderate, and severe is largely subjective, and its reliability has not been fully validated15. The present study has developed and validated a new measurement protocol to quantify SCB thickness, which includes the following steps: creation of knee OA in mice, preparation of tissue sections and histologic images, quantitative measurement of osteoarthritic subchondral bone with ImageJ software, and statistical analysis to validate the sensitivity and reproducibility of the protocol.
Although the general techniques of this protocol follow the instruction of ImageJ software, we have included step-by-step technical details to make new users easier to follow and validate the reproducibility. The BoneJ program, a plug-in of ImageJ software, works well for measuring 2D black and white images but does not function well for excluding bone marrow area from the total area of SCB due to the similarity of shade between bone marrow and SCB substance in black and white. In contrast, the step-wise methods described in the current protocol can be applied to all color histologic images using the color threshold function to automatically separate the SCB substance from bone marrow, thereby measuring net SCB thickness. A new method (not a part of ImageJ) for calculating SCB density (net SCB area mm2/1.0 mm2 of ROI) is included in the current protocol.
The protocol presented in this article has several advantages. First, ImageJ is a free software system and is readily available on the NIH website. Second, the new system is easy to learn and apply; the quantitative measurement takes only 5-6 min per SCB ROI. Third, the results from the new system are highly reproducible with very low inter- and intra-observer variabilities. Finally, the new system is more sensitive to mild SCB thickening changes than existing visual grading systems.
A minor limitation of the new system is the need for control images as calibrators for statistical analysis. However, this should not be an issue for most OA projects as control images are almost always included for data analysis. Another potential limitation is that the ImageJ software can separate SCB substances from bone marrow based upon their color pixels, which relies on appropriate staining methods to show distinct colors for bone substance and bone marrow.
The new quantitative SCB measurement system is suitable for quantifying SCB thickness at all levels. For histologic images with remarkable SCB thickening, the new system can accurately quantify the exact area of bone substance and then convert it to bone density (net SCB mm2/1.0 mm2 of ROI) representing bone thickness per unit area. For histologic images with non-remarkable SCB thickening that cannot be detected by visual grading, the new system can identify a subtle or mild thickening that often occurs at an early phase of OA. Therefore, the new system can be used for monitoring OA progression and in vivo efficacy of OA therapies in concert with OA cartilage grading. Moreover, this protocol could also be used for measuring SCB thickness in other species after adjusting the size of SCB ROI.
The authors have nothing to disclose.
This work was supported by the National Institute of Arthritis and Musculoskeletal and Skin Diseases of the National Institutes of Health (NIH) under Award Number R01 AR059088, the Department of Defense (DoD) under Research Award Number W81XWH-12-1-0304, and the Mary and Paul Harrington Distinguished Professorship Endowment.
Safranin-O | Sigma-Aldrich | S8884 | |
Fast green | Sigma-Aldrich | F7252 | |
Hematoxylin | Sigma-Aldrich | GHS216 | |
Eosin | Sigma-Aldrich | E4382 | |
illustrator | Adobe | Not applicable |