All experiments followed the ARRIVE guidelines and were approved by the University of Cambridge Animal Welfare Ethical Review Body (AWERB).
NOTE: All sample preparation steps prior to droplet generation must be performed in a clean pre-PCR work area, ideally in a UV-sterilized cabinet where possible. The protocol described here uses specific droplet generation PCR equipment (see Table of Materials), and while the general method should be applicable to other systems, it is recommended to consult the manufacturer's guidelines regarding primer/probe concentrations, PCR cycling conditions, etc., as they may differ from those described here. Cell lines/primary cells used in this study were as follows: Human HeLa cells (commercially obtained), human HEK 293T cells (commercially obtained), primary human dermal fibroblast cells (obtained from the Newcastle Biobank), human cybrids (WT & ΔH2.1 deletion15, obtained from C. Moraes, University of Miami), mouse embryonic fibroblasts (immortalized, from C57Bl/6 mice, obtained from J. Stewart, Newcastle University), mouse primordial germ cells (obtained from C57Bl/6 mouse embryos), and mouse MII oocytes (obtained from adult female C57Bl/6 mice). All cultured cells were maintained in High Glucose (4.5g/L) DMEM supplemented with 10% fetal bovine serum at 37 °C with 5% CO2. Primary mouse cells used in this study were isolated from animals kept according to the Animal (Scientific Procedures) Act 1986 under Home Office Project License P6C97520A.
1. Design and synthesize primer & probe sets targeting DNA sequences of interest
NOTE: Droplet generation PCR can also be performed using a dsDNA binding dye in place of the amplicon-specific probes.
- Design the primer and probe sequences according to the guidelines given by the system manufacturer. Validated primer and probe sequences suitable for measuring single-cell mtDNA copy number/deletion heteroplasmy in both human16,17 and mouse18 cells are provided in Table 1. When selecting alternative target sequences, consider the following points.
- Multiplex two primer/probe sets in a single PCR assay but ensure that the two assays utilize one FAM-labeled probe and one HEX-labeled probe so that the target amplicons can be differentiated by the droplet reader. This protocol presents a duplex probe assay. With careful experimental design, multiplexing can be increased up to four targets, and alternative platforms can achieve higher-dimensional multiplexing.
- When multiplexing primer/probe sets targeting separate mtDNA sequences, ensure that the amplicons generated by the two primer sets do not overlap.
- When measuring heteroplasmy in samples carrying mtDNA deletions, ensure that one target amplicon falls within the expected deleted region and the other falls outside of the expected deleted region.
NOTE: Optimal PCR cycling conditions for alternative assays may differ from those quoted in Step 5.1; see the Discussion for further details on assay optimization.
2. Isolation of DNA from single cells
NOTE: This method can also be used for small bulk samples of up to 100 cells.
- Collect single cells using an appropriate method, such as Fluorescence-Activated Cell Sorting (FACS)19 or laser capture microdissection20, in as small a volume as possible into a suitable receptacle (e.g., 96-well plate). Use of a cell viability dye prior to or during single-cell isolation will minimize the likelihood of isolating dead cells. Sort the single cells directly into lysis buffer if desired and store at -80 °C (up to 6 months) prior to analysis.
- Lyse the cells in a small volume (<10 µL) of a suitable lysis buffer (the buffer used in this study is described in step 2.2.1.).
NOTE: All data obtained from cells in this study are from single-cell lysates or pools of 20 cells (sample sizes are stipulated in the figure legends). Efficient formation of an oil/droplet emulsion during the droplet generation step of the droplet generation PCR protocol can be significantly affected by the presence of detergents in the sample; therefore, it is recommended to validate the compatibility of all cell-lysis buffers with droplet generation at the intended input concentration before proceeding with experimental samples and using the smallest practical volume of lysis buffer. The following lysis protocol results in minimal impact on droplet generation efficiency.- Prepare the lysis buffer containing 50 mM Tris-HCl pH 8.3, 1% TWEEN-20, and 200 µg/mL Proteinase K.
- Add 2.5 µL of the lysis buffer to each sample, seal the plate with an adhesive plate seal, and then centrifuge the samples at 1,000 x g for 1 min at 4 °C.
- Incubate the samples at 37 °C for 30 min on the thermocycler with the heated lid set at 105 °C to prevent the condensation of liquid on the plate cover.
- Add 7.5 µL of nuclease free water to each sample to get a final sample volume of 10 µL, re-seal the plate, and then centrifuge the samples at 1,000 x g for 1 min at 4 °C.
- Incubate on the thermocycler at 80 °C for 15 min (heated lid set to 105 °C) to inactivate Proteinase K.
- Centrifuge the samples at 1,000 x g for 1 min at 4 °C and then keep on ice.
- Proceed to step 3 below.
NOTE: Cell lysates can be stored at -20 °C prior to continuing with step 3; however, use freshly eluted DNA where possible to eliminate the risk of freeze-thaw cycles resulting in DNA degradation.
3. Preparation of samples
NOTE: Ensure that technical replicates of samples and non-template controls (NTCs) are included on each assay plate to ensure the accuracy of results. The dynamic range of the droplet generation PCR assay is up to 120,000 copies of the target amplicon per reaction. For single-cell or small bulk-cell sample lysates, dilution is unlikely to be necessary, and the lysate mixture can be input directly to the reaction for the measurement of mtDNA copy number (e.g., a lysate sample of 10 µL can be split and run in triplicate with 3 µL input directly into each assay). However, using undiluted lysate from cells with very high copy mtDNA numbers (e.g., oocytes) or containing larger numbers of cells (e.g., 50-100) may exceed this dynamic range. In such cases, an initial serial dilution is required to identify an appropriate dilution factor that avoids saturation of the assay for that specific cell type/cell number (see Representative Results for further details).
- Defrost all reagents on ice, vortex, and spin down briefly before use.
- Prepare the master mix (minus sample DNA) on ice as described in (Table 2).
NOTE: If only one target amplicon is being measured, add an additional 2.55 µL of nuclease-free water per sample to achieve the final volume of 22 µL. Prepare sufficient master mix for the number of samples and NTCs to be analyzed, plus enough to account for any 'blank' wells required on the droplet generation PCR plate (see next step). - Vortex the prepared master mix briefly to mix and aliquot the required volume (22 µL minus input DNA volume) into each well of a droplet generation PCR 96-well plate. Arrange the samples in full columns on the 96-well plate; fill any empty wells in incomplete columns with master mix and use them as NTCs.
- Add the input DNA to each sample well and nuclease-free water/elution buffer to NTC wells to bring the total volume of each up to 22 µL.
- Seal the plate with an adhesive plate seal and place on a shaker at 2,000 rpm for 1 min, and then centrifuge at 1,000 x g for one min at 4 °C.
- Place the plate on ice and proceed to Step 4.
NOTE: Prepared plates can be stored on ice and protected from light for short periods of time (e.g., 1-2 h) before proceeding with droplet generation.
4. Generation of droplets
NOTE: Refer to Figure 1A for the schematic of the droplet generator instrument deck referenced in this section.
- Power on the droplet generator.
- Check that a bottle of droplet generating oil is loaded to position E of the instrument deck. If prompted, follow the on-screen instructions to replace the bottle.
- Click Configure Sample Plate on the touch screen. Select all columns on the sample plate that contain samples/blanks.
NOTE: Entry of plate name and details of the experiment at this step is optional and not required to continue setting up the experiment. - Click OK to confirm the plate configuration; orange lights will illuminate on the instrument deck to indicate positions where consumables need to be loaded.
- Load the droplet generator cartridges to position B on the instrument deck so that all lights turn green.
- Place an empty tip waste trough into position C on the instrument deck.
- Remove lids from filter tip boxes and load to position D on the instrument stage so that all lights turn green.
- Remove the adhesive plate seal from the sample plate and load to position F of the instrument deck so that the light turns green.
- Place an empty droplet collection 96-well plate into a cool block (pre-chilled at -20 °C) and load to position G of the instrument deck so that the light turns green.
- Click Start Droplet Generation on the instrument touch screen.
- Click Start Run on the instrument touch screen. The instrument lid will close automatically. After initializing, the time remaining until droplet generation is complete will display on the instrument touch screen.
- Once the droplet generation is complete, check the sample collection plate visually to confirm that a droplet emulsion layer is present above the oil phase in each well (Figure 1B).
NOTE: If a droplet emulsion layer is not visible, do not proceed further with the experiment and check for any errors that may have occurred during previous steps of the protocol. - Clear the used consumables from the instrument deck and empty the tip-waste trough.
- Power on the plate sealer, set the temperature to 180 °C and seal time to 5 s, and allow the machine to reach the operating temperature.
- Put the sample collection plate into the plate sealer plate-holder and place a fresh foil seal on top of the plate with the red line facing upwards. Take care not to touch the underside of the foil seal.
NOTE: The plate holder should be stored at room temperature (RT) and only placed into the plate sealer drawer when a foil seal is being applied to prevent heat transfer to the sample collection plate. - When the plate sealer has reached operating temperature, press Eject on the instrument touchscreen; the drawer will open automatically.
- Place the plate holder into the plate sealer drawer and press Seal. The drawer will close automatically and then open again once sealing is complete.
- Replace the sealed plate on the cold block, turn off the plate sealer, and proceed immediately to Step 5.
NOTE: At this stage, the droplets are unstable, so ensure that the PCR step is commenced within 1 h of droplet generation finishing.
5. PCR
- Place the sealed droplet collection plate onto a PCR cycler equipped with a 96-deep-well block and run the thermal cycling protocol described in Table 3.
NOTE: Set heated lid temperature to 105 °C and sample volume to 40 µL. Denaturation and annealing/extension steps must include a temperature ramp-rate of 2 °C/s to ensure that the oil has time to equilibrate to the correct temperature. - Proceed to Step 6.
NOTE: Once the thermal cycling protocol is complete, the droplets are more stable, and the plate can be stored for up to 4 days at 4 °C before proceeding with the next step.
6. Droplet reading
- Power on the droplet reader and connected computer.
- Check the fluid levels in the droplet reader oil and droplet reader waste bottles and fill/empty these, respectively, if required.
- Load the plate containing the post-PCR samples into the droplet reader plate holder, place the cover on top of the holder and secure it in place with the black locking clips. Do not remove the foil lid from the sample plate.
- Press the Open/Close button on the lid of the droplet reader to open it.
- Load the droplet reader plate holder containing the sample plate into the reader chamber and locate it securely onto the magnetic base.
- Press the Open/Close button on the lid of the droplet reader to close it.
- Open the analysis software interface, select the Add Plate tab and prepare a new sample plate as follows:
- Click Add Plate and then Configure Plate.
- In the Plate Information tab enter a Plate Name, select Supermix for Probes (no dUTP) from the Supermix drop-down menu and enter a file name under Save Data File As.
- In the Well Selection tab highlight the wells to be analyzed and click Include Selected Wells.
NOTE: Steps 6.7.4 – 6.7.7 are optional. - In the Well Information tab, select the wells to be annotated.
NOTE: Refer to Figure 1D for an example of the Well Information tab interface. - Select Direct Quantification (DQ) from the Experiment Type drop-down menu, populate the Sample Description, Sample Type & Target Name boxes, and add Well Notes and/or Plate Notes as required.
- Click Apply. The information in the fields will be applied to the selected wells.
- Repeat steps 6.7.4–6.7.6 until all sample wells have been annotated.
- Once the plate configuration is complete, click Start Run.
- When the run is complete, discard the empty sample plate and empty the droplet reader waste bottle if necessary.
- Proceed to Step 7.
7. Analysis of results
NOTE: The droplet reader measures the fluorescence intensity in the FAM and HEX channel for each droplet in a sample. In a successful assay, droplets fall into one of two categories for each probe: Negative (meaning the target was not present in the droplet) or Positive (meaning the target was present in the droplet). Prior to analyzing samples, ensure that each well contains >10,000 droplets and has two clearly separate populations of low fluorescence (negative) and high fluorescence (positive) droplets in each channel (Figure 2A).
- Select the Data Analysis tab and open the file to be analyzed from the My Datafiles menu.
- Click the 1D Amplitude tab for single-color experiments or the 2D Amplitude tab for two-color experiments.
- Apply a fluorescence threshold to each channel to differentiate the positive and negative droplets. The analysis software will attempt to apply an automatic threshold on a sample-by-sample and channel-by-channel basis, but if this appears to have failed, or looks inaccurate, then manually apply the threshold as follows:
- Select the wells that require thresholding.
- Manually apply the threshold in the clear space between the positive and negative populations on the amplitude plot using the Threshold Line Mode tool. When setting manual thresholds in 2D view, ensure that the crosshair is placed so that the four droplet populations (double negative, single positive FAM, single positive HEX, and double positive) are clearly separated.
NOTE: Thresholding can either be done well-by-well or applied to multiple wells at once.
- Once all samples have had a threshold applied, export the results as a .csv file for further analysis by clicking on the Data Table tab, clicking Import/Export and selecting Export Visible Data to CSV. Enter a suitable file name and click Save.
- Calculate the mtDNA copy number in the initial sample as follows:
Copy Number = mtDNA target concentration × 22 × 1/fraction of total lysate input
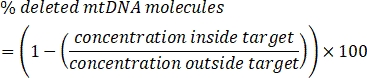
NOTE: If two mitochondrial probes are used, then the concentration of the two targets is averaged before making the calculation. For samples containing more than one cell, the copy number per cell is calculated by dividing by the number of cells in the sample. It is important to use the 'Concentration' value (i.e., number of copies per microliter) multiplied by the initial sample volume of 22 µL, rather than the 'Copies per 20 µL' value calculated in the .csv file, since the mtDNA copies left in the 2 µL overage required by the droplet generator must be taken into account when calculating the absolute copy number of the initial sample. - For cells carrying heteroplasmic mtDNA deletions, calculate the copy number using the results from the mtDNA target outside the deleted region (i.e., the target present in both deleted and WT mtDNA molecules). The deletion heteroplasmy is calculated using the concentrations of the target inside the deleted region and the target outside the deleted region as follows:
Following droplet generation, a clear layer of opaque droplets is visible floating on top of the oil phase in each well (Figure 1B). Droplet formation can be adversely affected by the presence of detergents in the input lysate when performing experiments on single cells. Using the lysis protocol described in 2.1.2., droplet yields above the recommended level of 10,000 are routinely achieved, despite the presence of a small residual amount of TWEEN-20 in the final sample (Figure 1C). However, with other lysis buffers, such as buffer RLT Plus, a dramatic reduction is seen in the number of droplets formed (Figure 1C), which is likely to adversely affect the accuracy of the copy number measurement.
Following PCR and droplet reading, clearly separated populations of positive and negative droplets will be seen in each of the channels used for each sample well (Figure 2A), with NTC wells containing only negative droplets. Potential issues that may be encountered when analyzing results include:
The lack of clear separation between positive and negative populations, and the presence of droplets in the gap between the two populations, termed 'rain' (Figure 2B). This can occur if a non-optimal annealing/extension temperature is used, especially in assays where the difference in fluorescence between positive and negative droplets is relatively small. Running a gradient of annealing/extension temperatures may help identify an optimal temperature to use. Alternatively, primers/probes may need to be redesigned to improve assay performance.
A 'double band' of droplets in the negative population when using the '1D Amplitude' view. In some cases, a double band of negative droplets may be seen in the HEX channel (Figure 2Bii); this is the result of differing levels of background fluorescence between the double-negative and single-negative (i.e., FAM-positive, HEX-negative) droplet populations, as seen in (Figure 2Biii), which shows FAM single-positive population (top left quadrant) with lower mean fluorescence in the HEX channel than the double-negative population (bottom left quadrant). This fluorescence artifact does not affect the results of the assay, and use of the '2D Amplitude' allows the four droplet populations to be clearly identified.
Absence of positive droplets (Figure 2C). For validated assays, this is most likely due to an error during sample preparation (e.g., incomplete cell lysis, incorrect primers/probe added to the master mix, failure of single-cell sorting, etc.).
Absence of negative droplets (Figure 2D). This occurs when the assay is saturated with a high target DNA input, resulting in every droplet containing one or more target sequences. This is most likely to be seen when measuring high copy number samples (e.g., oocytes) and can be resolved by diluting the lysate prior to step 3.5. A serial dilution of the input DNA (Figure 2D) can be used to identify a suitable dilution factor when this problem is encountered.
When using two independent mtDNA probes, the integrity of the sample DNA can be assessed by selecting the '2D Amplitude' view: Intact mtDNA molecules carry both target sequences; therefore, droplets containing complete mtDNA genomes will be positive in both channels (Figure 3A). When analyzing samples carrying mtDNA deletions, a mixture of double-positive droplets and droplets positive only for the non-deleted target sequence will be present, even in non-degraded samples (Figure 3B). When mtDNA is degraded, some target sequences are likely to exist on separate DNA fragments, and therefore droplets are more likely to be positive for just one probe, and fewer droplets will be positive for both (Figure 3C). These differences are accounted for during data analysis, as concentrations are always estimated independently for each target using the total population of all positive droplets in that fluorescence channel, and then either averaged to estimate copy number or used to calculate heteroplasmy (see steps 7.3.-7.4.).
This method can be used to measure the copy number in a wide variety of cell types from both mouse and human tissues, including laboratory cell lines such as HeLa, HEK 293T, and immortalized mouse embryonic fibroblasts (MEFs) and primary cells such as human dermal fibroblasts and mouse primordial germ cells (PGCs) (Figure 4A). In the somatic cell types tested, a range of copy numbers is seen from a few hundred (e.g., dermal fibroblasts) to several thousand (e.g., HeLa cells). To quantify assay precision, mature mouse oocytes, which have a very high copy number (>150,000 copies per cell)2, were lysed, and the resulting lysate was split equally across 22 separate reactions per cell. After running the droplet generation PCR protocol, very little difference was seen in the number of copies detected in each reaction, with two representative cells (Figure 4B) yielding a total of 229,647 copies (mean 10,439 per well, standard deviation 380) and 330,121 copies (mean 15,006 per well, standard deviation 340) per oocyte. The coefficients of variation (CV) for these two cells were 3.64% and 2.26%, respectively. To test reproducibility across biological specimens, PGCs were harvested from the gonads of four embryonic mice at day 13.5 post-conception, and the resulting single-cell copy number of these cell populations was compared across the different embryos (Figure 4C). Whilst some biological variation is to be expected, the mean copy number and standard deviation remained comparable across the four embryos tested, and these results were in agreement with copy number data previously reported in this cell type at a similar stage of embryonic development21.
In addition to measuring copy number, this method can also be utilized to measure heteroplasmy level in cybrid cells carrying a heteroplasmic mtDNA deletion. This requires the use of two mtDNA probes, one falling inside the deleted region of the mtDNA and one falling outside (Figure 5A). After analysis, the level of heteroplasmy can be found by comparing the concentration of each probe to calculate the proportion of copies that contain both targets (i.e., WT mtDNA genomes) and the proportion that only contain the probe which falls outside the deleted region (i.e., deleted mtDNA genomes) as described in step 7.4. Since the target located outside the deleted region is present in all mtDNA copies, this can also be used to calculate the overall copy number of the cell. In cells with high deletion heteroplasmy, relatively few copies of the probe inside the deleted region are detected (Figure 5Bi), while in cells with low deletion heteroplasmy, the concentrations of the two probes are much more similar (Figure 5Bii). Use of 'in-out' probe assays to measure deletion heteroplasmy by droplet generation PCR in bulk-extracted DNA samples has shown improved precision over qPCR-based methods, but lacks sensitivity when dealing with very low heteroplasmy levels (<5%)22, and therefore is not recommended in cells with very small deletion burdens. The primer/probe sets for both mouse and human mtDNA described in Table 1 comprise one target within the mtDNA major arc and one target outside, and therefore are suitable for most common mtDNA deletions23,24.
| Species | Target | Primer/Probe Name | Sequence | 5’ Probe | 3’ Quencher | ||
| Human | ND4 | huND4_F Primer | AGTGCGATGAGTAGGGGAAGG | ||||
| huND4_R Primer | ACCTTGGCTATCATCACCCGAT | ||||||
| huND4_FAM Probe | CAACCAGCCAGAACGCCTGAACGCA | FAM | BHQ 2 | ||||
| ND1 | huND1_F Primer | GGGTTCATAGTAGAAGAGCGATGG | |||||
| huND1_R Primer | ACGCCATAAAACTCTTCACCAAAG | ||||||
| huND1_HEX Probe | ACCCGCCACATCTACCATCACCCTC | HEX | BHQ 1 | ||||
| Mouse | ND1 | musND1_F Primer | GAGCCTCAAACTCCAAATACTCACT | ||||
| musND1_R Primer | GAACTGATAAAAGGATAATA GCTATGGTTACTTCA |
||||||
| musND1_FAM Probe | CCGTAGCCCAAACAAT | FAM | BHQ 1 | ||||
| COX3 | musCOX3_F Primer | CCTCGTACCAACACATGATCTAGG | |||||
| musCOX3_R Primer | AGTGGGACTTCTAGAGGGTTAAGTG | ||||||
| musCOX3_HEX Probe | ACCTCCAACAGGAATTTCA | HEX | BHQ 1 | ||||
Table 1: Validated droplet generation PCR primer and probe sets for use in human and mouse cells. Primer and probe sets for previously validated assays amplifying two independent mtDNA targets for human16,17 and mouse cells18.
| Component | Volume per sample | Final Concentration |
| 2X ddPCR Supermix for Probes (no dUTP) | 11 µl | 1X |
| Target 1 Primer F (20 µM) | 1 µl | 900 nM |
| Target 1 Primer R (20 µM) | 1 µl | 900 nM |
| Target 2 Primer F (20 µM) | 1 µl | 900 nM |
| Target 2 Primer R (20 µM) | 1 µl | 900 nM |
| Target 1 Probe (FAM, 10 µM) | 0.55 µl | 250 nM |
| Target 2 Probe (HEX, 10 µM) | 0.55 µl | 250 nM |
| Sample DNA (added in step 3.4) | Variable | Variable |
| Nuclease-free water | Variable | |
| Total Volume | 22 µl |
Table 2: Droplet generation PCR reaction mix recipe. Reaction mix required for a single-well droplet generation PCR assay. Recommended primer/probe sequences can be found in Table 1; the recipe can be scaled up when running multiple samples.
| Step | Temp (°C) | Time | No. Cycles |
| Enzyme Activation | 95 | 10 min | 1 |
| Denaturation | 94 | 30 sec | 40 |
| Annealing/Extension | 58 | 1 min | |
| Enzyme Deactivation | 98 | 10 min | 1 |
| Hold | 4 | Infinite | 1 |
Table 3: Droplet generation PCR thermal cycling protocol. Cycling protocol for amplification of target DNA following droplet generation.
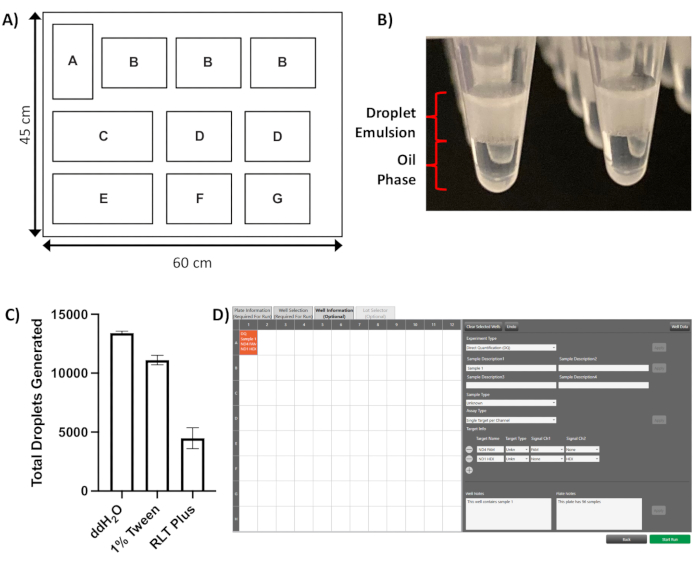
Figure 1: Droplet generation. (A) Schematic layout of the droplet generation PCR droplet generator instrument deck, positions as follows: A = automated liquid handling module, B = droplet generator cartridge (x3), C = tip waste bucket, D = filter tip box (x2), E = droplet generator oil holder, F = sample plate, G = collection plate (housed in cool block). (B) Representative image of droplet emulsion floating on top of the oil phase immediately after droplet generation. (C) Impact of different lysis buffers on droplet number; with 1% TWEEN-20 there is a small decrease in droplet number, whilst RLT Plus buffer results in an almost threefold reduction in droplet numbers, well below the recommended number of 10,000 (results shown as mean of three technical repeats per condition with standard deviations). (D) Screenshot of the software Well Information tab showing completed sample information applied to well A1 of a 96-well template. Please click here to view a larger version of this figure.
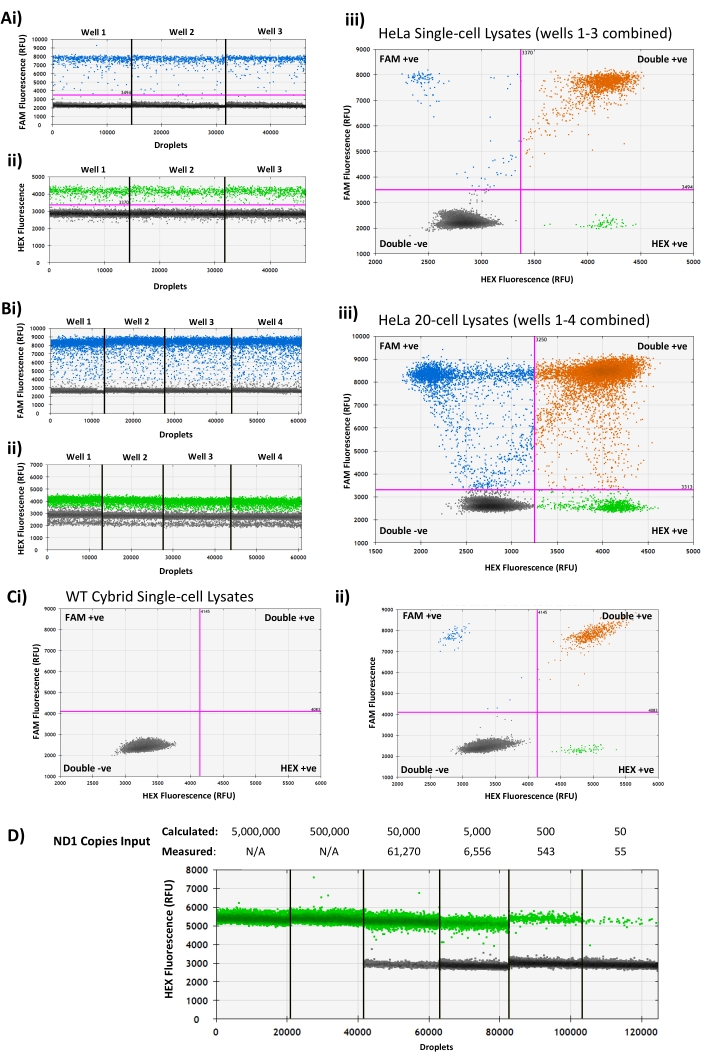
Figure 2: Representative droplet generation PCR assay analyses showing expected results and common issues. (A) Dual mtDNA probe assay results from three HeLa single-cell lysates showing clearly separated positive and negative droplet populations in the (i) FAM channel, (ii) HEX channel, and (iii) combined 2D amplitude view. (B) Assay results from four bulk HeLa 20-cell samples showing 'rain' between the positive and negative populations in the (i) FAM channel, (ii) poor separation between positive and negative droplets in the HEX channel, and (iii) a double droplet band in the negative droplets of the HEX channel (ii) due to different background fluorescence levels in the HEX-negative populations, as seen in 2D amplitude view. (C) An example of a WT cybrid single-cell lysate with no positive droplets (i) in either fluorescence channel, with a successful WT cybrid assay from the same experiment (ii) for comparison. (D) Representative results from a 10-fold serial dilution of PCR-amplified human ND1 target amplicon with known concentration, showing saturation of the droplet generation PCR above the assay upper limit of 120,000 copies. RFU = Relative Fluorescence Units. Please click here to view a larger version of this figure.
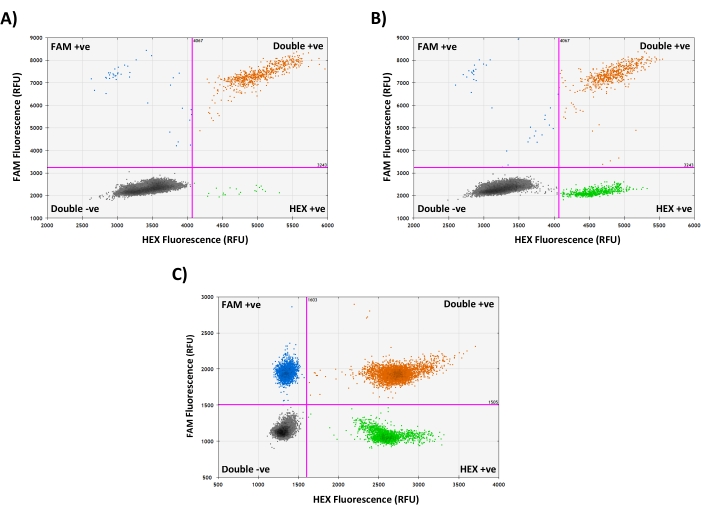
Figure 3: Assessing mtDNA integrity using the '2D Amplitude' view. (A) Representative droplet generation PCR results from a WT cybrid single-cell lysate containing mostly intact mtDNA genomes, indicated by the presence of mainly FAM and HEX double-positive droplets. (B) Droplet generation PCR results from a heteroplasmic deletion cybrid single-cell lysate, showing a mixture of HEX single-positive droplets (containing deleted mtDNA molecules carrying only the HEX target) and FAM and HEX double-positive droplets (containing complete mtDNA molecules carrying both targets), with very few FAM single-positive droplets, indicating no major mtDNA degradation. (C) Droplet generation PCR results from a mouse oocyte single-cell lysate containing a mixture of FAM single-positive, HEX single-positive, and FAM and HEX double-positive droplets, indicating that some mtDNA degradation is likely to have occurred in this sample. RFU = Relative Fluorescence Units. Please click here to view a larger version of this figure.
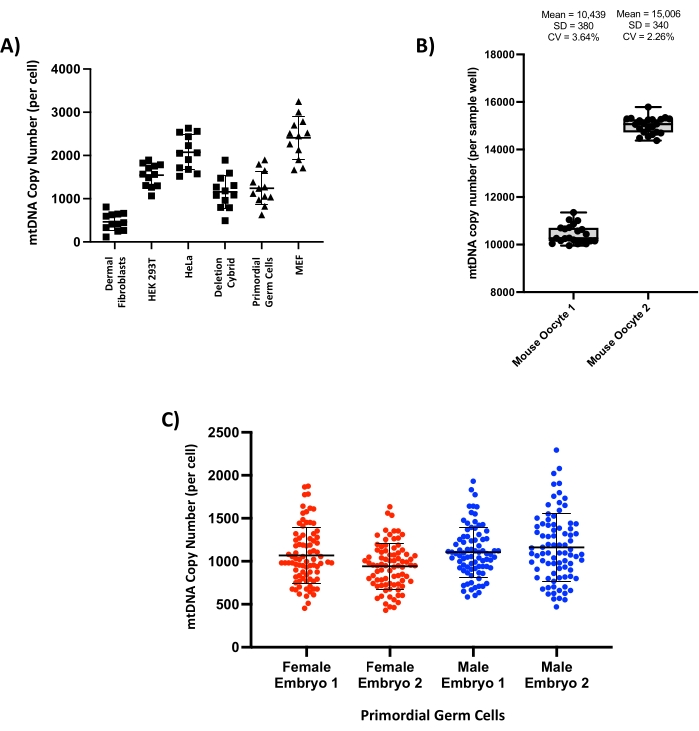
Figure 4: Single-cell copy number measurements reveal variation between cell types but show robust intra- and inter-experimental repeatability. (A) Representative single-cell copy number measurements from a range of cell lines from both human (squares) and mouse (triangles) tissues (n = 12 cells per tissue). (B) Serial measurement of copy number in lysate from two individual mouse oocytes; total lysate volume was split across 22 separate droplet generation PCR reactions; each point on the box and whisker plots represents the copy number measured in a single well. Mean, standard deviation (SD), and coefficient of variation (CV) are reported for each oocyte. (C) Single-cell copy number of primary mouse primordial germ cells collected from four separate embryos at 13.5 days post-fertilization (n = 94 single cells per embryo). Please click here to view a larger version of this figure.
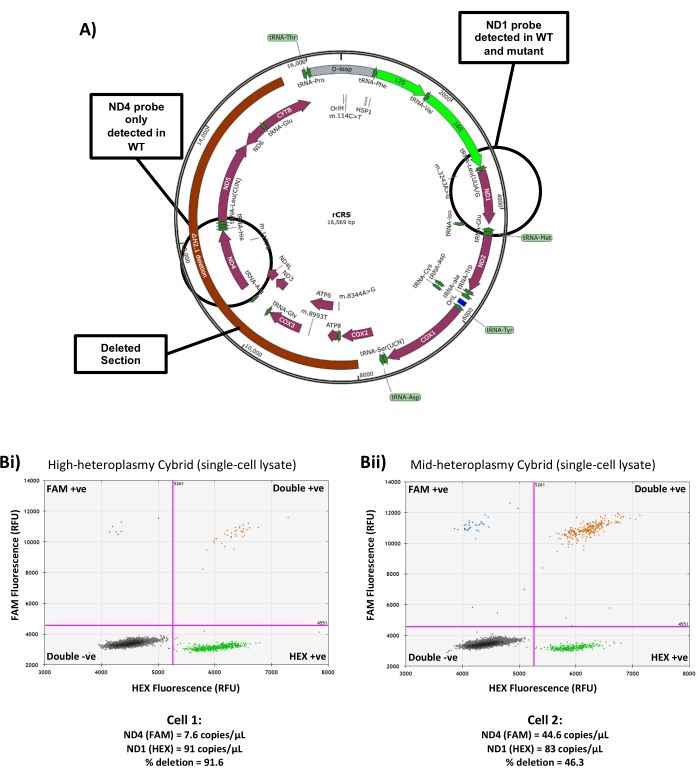
Figure 5: Measuring single-cell heteroplasmy in a deletion cybrid line. (A) Schematic showing the region of mtDNA deleted in the cybrid line used for this study and the location of the ND1 and ND4 mtDNA probes. (B) Representative results from (i) a high heteroplasmy single-cell lysate and (ii) a low heteroplasmy single-cell lysate showing the differing ratios of ND4:ND1 probe and the resulting copy number and heteroplasmy measurements. RFU = Relative Fluorescence Units. Please click here to view a larger version of this figure.
