The cytoskeleton, a network of biopolymers found in most eukaryotic cells, plays a role in cellular organization, intracellular transport, and cell mechanics. The mechanical characteristics of the biopolymers of the cytoskeleton (primarily actin and microtubules) play a significant role in determining the mechanical characteristics of the cell as a whole12. Since whole cell mechanics can characterize healthy and diseased cells13,14 and is involved in cellular motility15, the mechanical properties of the underlying cytoskeletal components have been an active area of study for the past two decades1.
The flexibility (or stiffness) of biopolymers is characterized by the persistence length, the length of polymer which bends by approximately one radian under thermal fluctuations at ambient temperature. A number of techniques have been developed to measure persistence length16, for example active techniques which involve bending the polymer using hydrodynamic flow, optical traps, or electric fields4,17,18 , and passive techniques which measure the fluctuations of free polymers in solution5,6 . The active measurements, however, require specialized setups to implement known forces on the micrometer scale, and the free-fluctuation measurements can be challenging due to diffusion out of the plane of focus of the microscope used.
In this article, we describe a complementary, passive, technique to measure the persistence length of microtubules, a cytoskeletal polymer. The technique involves gliding assays, which ensure that the polymer always remains in the focal plane19. Moreover, it involves tracking single fluorophores attached permanently to the polymer of interest, so that specific locations along the polymer are well characterized.
A cartoon of the method is shown in Figure 1. Kinesin moves specifically toward the + end of microtubules, so the microtubules in a gliding assay are propelled unidirectionally. The leading end of the microtubule, beyond the last kinesin attached, is free to fluctuate under the thermal forces of the surrounding solution. As the microtubule is propelled forward, the end fluctuates until binding to a new kinesin molecule further along the glass slide freezes in a given fluctuation. Because kinesin attaches microtubules very strongly, the microtubule is constrained to follow the path of the leading end. Therefore, the statistical fluctuations frozen into the microtubule trajectory are the same as the statistical fluctuations of the free end of microtubules11, and can therefore be used to calculate the persistence length according to20
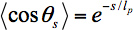
where lp is the persistence length of the microtubule, θs is the angle between tangents to the trajectory separated by a contour length s, and <> denotes an average over all pairs of positions separated by a contour length s.
The gliding assay itself uses kinesin biotinylated at the coiled-coil21 specifically bound to the glass slide via a streptavidin-biotin linkage. This attachment ensures that the motor domains are free to bind to and propel microtubules. In order to follow microtubule trajectories, microtubules are sparsely labeled with organic fluorophores22,23 – the labels must be sparse enough that single fluorophores are resolvable using single molecule fluorescence microscopy. Single fluorophores are tracked using image analysis routines written in IDL. The trajectories of each fluorophore bound to a given microtubule are combined into a composite microtubule trajectory automatically24. The tangent angles θ to each point along a trajectory are calculated; from these tangent angles the <cosθs> value is calculated for each contour length s. Finally, these data are fit to Eq. 1 in order to extract a persistence length for a given microtubule, or for many microtubules in the same gliding assay.
The method is robust enough to work with microtubules prepared in a wide variety of conditions (with different stabilizing agents or other small molecules bound to the microtubule, with bound microtubule associated proteins (MAPs), or with a variety of viscous solutions). In our lab, the technique has been used to characterize the persistence length of microtubules as a function of length along the microtubules and microtubules with different stabilizing agents. The main restriction is that the microtubules must still support kinesin motility. Since kinesin is a robust motor enzyme, this is a fairly loose restriction. By replacing microtubules with actin and kinesin with a myosin family enzyme, the persistence length of actin can be measured using the same technique.
A snapshot from a gliding assay is shown in Figure 2. A good microtubule density is 1-10 microtubules per field of view; substantially more will result in mistracking as microtubules cross each other. A plot of the 11 microtubule trajectories from the gliding assay in Figure 2 is shown in Figure 3. Typical trajectories are 10 to 30 μm long; some trajectories have gaps where one microtubule crosses another. These trajectories may be discarded from analysis.
A single, long microtubule trajectory is shown in Figure 4A with example tangent angles at two positions along the trajectory. The difference between tangent angles separated by a fixed distance is related to the persistence length; the tangent angle as a function of position along the microtubule trajectory is shown in Figure 4B.
The tangent angle data from many microtubule trajectories is combined to calculate a single persistence length for all microtubules in a given experiment. Figure 5 shows a plot of <cosθs> versus contour length s for the gliding assay of Figure 2. At large contour length values, very few values of cosθ are measured; hence the average is highly variable. The weighted fit conforms to the short s, high-precision data more closely than the long s, low-precision data.
The value of persistence length from these 11 trajectories, 500 ± 40 μm (± standard error of the mean), is representative of persistence lengths for relatively short microtubules2. Similar experiments give a range of persistence lengths between 300 and 1,000 μm.
Troubleshooting
If microtubules are completely absent, increase the concentration of microtubules in step 3.9 to 0.5 mg/ml. If microtubules are still missing, re-polymerize microtubules. Make sure paclitaxel is present in each solution microtubules are diluted into, otherwise microtubules will depolymerize.
If microtubules are freely diffusing in solution but not binding to surface, increase the kinesin concentration in step 3.7 and use AMP-PNP instead of ATP to ensure kinesin binds microtubules irreversibly. If microtubules still do not bind, make new streptavidin stock and buffer, followed by new biotin-BSA buffer. Finally, purify new biotinylated kinesin.
If microtubules bind but do not move, replace ATP stock solution with fresh ATP.
If fluorophores photobleach too quickly, reduce illumination intensity. If fluorophores still photobleach too quickly, replace oxygen scavenging system with fresh stock.
If fluorophores are too dim, increase illumination intensity.
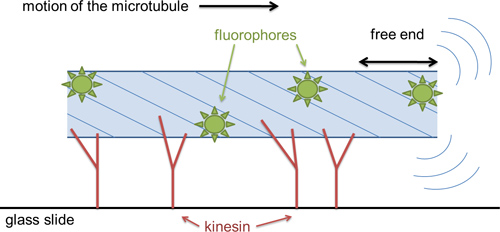
Figure 1. Cartoon of the microtubule gliding assay. Kinesin enzymes are specifically bound to a coverslip by a biotin-streptavidin linkage. Microtubules are sparsely labeled with organic fluorophores. Upon addition of ATP, microtubules are pushed by the kinesin motors. The leading free end of the microtubule fluctuates due to thermal forces in solution; these fluctuations are used to calculate the microtubule persistence length. The length-scale of the microtubule probed by these experiments is the length of the free end.
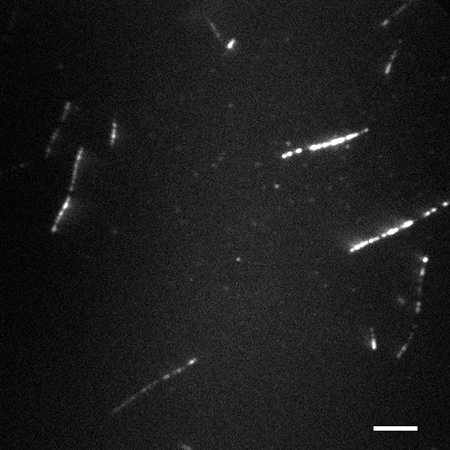
Figure 2. Typical microscope snapshot of a gliding assay, taken via TIRF microscopy. Microtubules are sparsely decorated with single fluorophores. Scale bar is 5 μm.
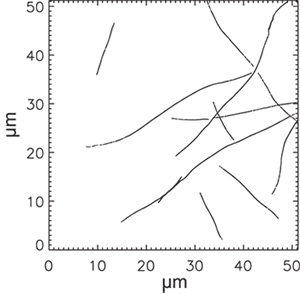
Figure 3. Microtubule trajectories from the image sequence shown in Figure 2. Each microtubule trajectory combines many single fluorophore trajectories (about 10 on average), and have been thinned to one point per 100 nm.
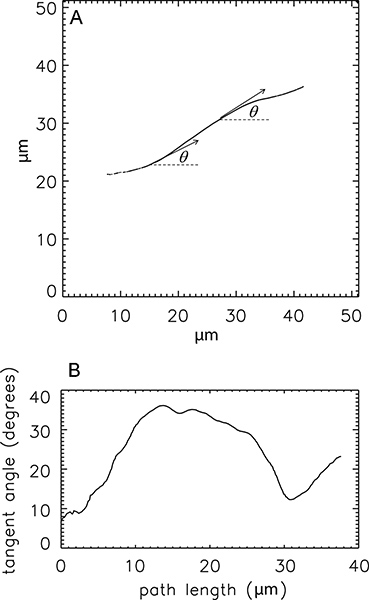
Figure 4. Calculating the tangent angles to a trajectory. (A) Trajectory of one microtubule, with example tangent angles (θ) shown. (B) Tangent angle as a function of position along the microtubule trajectory. These data are used to calculate the average angles used in Eq. 1.
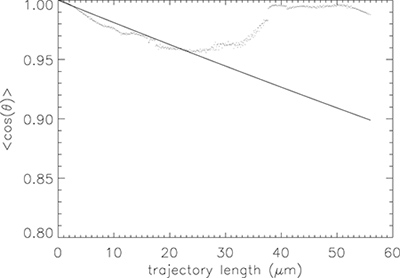
Figure 5. Calculating persistence length from tangent angles. (dots) Plot of <cosθs>versus contour length s for the 11 trajectories shown in Figure 3. (solid line) Fit to Eq. 1. For this group of microtubules, the persistence length is 500 ± 40 μm. For long contour lengths (above 10 μm or so), the data are highly variable due to limited statistics.
