All steps in this protocol comply with the Mayo Clinic (Rochester, MN) animal use guidelines.
1. Fly Husbandry
- Raise flies and set crosses according to standard husbandry29.
NOTE: Fluorescent reporter expression by the GAL4/UAS system is proportional to temperature and thus rearing temperature can be adjusted to alter expression level. While high expression levels often lead to a better signal-to-noise ratio this condition is also associated with increased cytosolic and organellar aggregates when using GFP to Red Fluorescent Protein (RFP) fusion constructs such as pHerry10,30,31. If aggregation is unavoidable, quantification is still possible by performing point calibrations in each experiment and normalizing data such that a fluorescence ratio of 1.0 corresponds to pHi 7.0 (see step 7.4 Note on calibration below). - Set crosses of homozygous capaR-GAL432 males to homozygous UAS-pHerry10 virgin females and homozygous c724-GAL42 males to homozygous UAS-pHerry virgin females to permit imaging of pHi in principal cells and stellate cells of the MT, respectively. Place 6 UAS-pHerry females with 3 GAL4 males into fresh vials of food and leave to mate at 28 °C.
NOTE: Larvae should be evident within 4 d and adults will begin to eclose around day 10. - Collect female flies upon eclosion and set aside to age for 10 d at 28 °C.
NOTE: The timing of experimentation can be adjusted to correspond to any restrictive behavioral assays (such as the Ramsay secretion assay17,19) that will be correlated to intracellular live pH imaging. Male flies can be used but tubules from females are often larger and more robust.
2. Preparation of Poly-L-Lysine Slides.
- Draw a 40 x 20 mm border with a hydrophobic PAP pen around the top of standard 75 x 25 mm slides and set aside to dry for 15 min at RT. Use large coverslips if the slides are not compatible with imaging optics.
- Transfer 2 mL of stock 0.01% Poly-L-Lysine (PLL) solution onto each slide and set aside for 1 h at RT.
- Remove excess PLL with a pipette. Save the solution in a 50 mL conical vial for future use. Store at 4 °C.
- Aspirate any remaining solution with a vacuum line. Run the vacuum line over the entire slide surface to ensure that no solution remains on the slides.
- Set the slides aside for 1 additional h at RT prior to use. Store the slides dry at RT for up to 1 month in a standard slide book.
3. Preparation of Dissecting Dish and Glass Rods
- Add 0.5 mL of elastomer curing agent to 4.5 mL of elastomer base in a 35 x 10 mm polystyrene Petri dish at RT to produce a depth of 5 mm. Mix with a disposable pipette tip. Allow elastomer to cure O/N at RT.
NOTE: Elastomer should be clear and free of bubbles. Clearing of bubbles may be facilitated by keeping elastomer plates in a vacuum jar for 10 – 15 min after pouring. - Hold a 5 mm diameter glass rod between hands and melt the center of the rod over a lit Bunsen burner while pulling the ends apart. As the glass melts pull more quickly to produce a thin (0.1 mm) and tapered shaft (Figure 1).
NOTE: A 45 ° angle at the shank is often helpful in handling tubules. This can be achieved by lowering one hand as the shank is pulled (see Figure 1). - Break the thin shaft in the middle with the blunt side of a single-edged carbon steel razor blade. Inspect the thin end of the rod under a dissecting scope to ensure the break is clean.
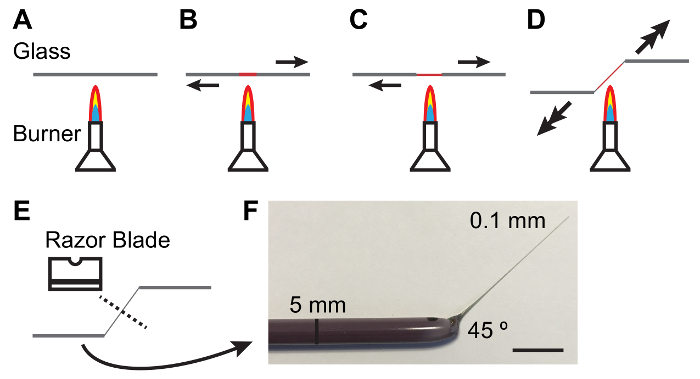
Figure 1: Fabricating Glass Rods for Handling Malpighian Tubules.
A – E. Process of heating and pulling a glass rod to produce a taper and angle suitable for handling MTs. Arrows denote direction and magnitude of force to be applied. F. Photograph of an appropriately fabricated glass tool. Scale bar = 10 mm. Please click here to view a larger version of this figure.
4. Preparation of Solutions and Perfusion System
NOTE: Perfusion systems differ by manufacturer. This protocol is based around a gravity-fed 8-channel open reservoir with an input flow rate regulator and a vacuum-driven outflow, but the method of mounting MTs as described here can be adapted to work with any perfusion system.
- Prepare the following solutions:
- Aliquot Schneider's medium (40 mL into 50 mL conical vials) and store at 4 °C.
- Prepare solutions (i.e. insect Phosphate-Buffered Saline (iPBS) and iPBS with NH4Cl) at RT as needed according to Table 1). Warm solutions to RT before use on day of experiment.
NOTE: iPBS and iPBS with 40 mM NH4Cl can be prepared in large volumes (1 L or more) and stored at 4 °C. - Prepare 8 calibration solutions in 500 mL volumes at pH = 5.0, 6.0, 6.5, 7.0, 7.3, 7.6, 8.0, and 9.0 as indicated in Table 1 and store at 4 °C. Adjust pH of each solution by titration with N-methyl-D-glucamine (NMDG) and HCl.
- On the day of experiments, warm 5 mL aliquots of calibration solutions to RT and add stock nigericin solution (20 mM in dimethyl sulfoxide (DMSO)) to produce a final concentration of 10 µM.
CAUTION: Handle nigericin with gloves. Treat all equipment that comes in contact with nigericin as disposable. Nigericin remains on glass and plastic and will compromise biological preparations if equipment is reused.
- Perfusion system:
- Prime the perfusion system by filling all reservoirs with ddH2O (Figure 2). Open the channels one at a time to allow all lines proximal to the flow rate regulator to fill.
NOTE: It may be necessary to clear air in the lines by opening the stalled channel and using a plunger to drive flow from the reservoir. - Open 2 channels and allow ddH2O to drain. Once the reservoirs are nearly empty, fill the first reservoir with iPBS and the second reservoir with NH4Cl-pulsed iPBS. Set flow rate to maximum with the flow rate regulator and allow each solution to flow for 1 min to fill the distal lines, then stop the flow (Figure 2).
- Position 2 sets of soldering "helping hands" clamps on the imaging microscope stage. Place one clamp on each side of the imaging platform.
- Carefully heat the distal 0.5 inches of a piece of capillary glass (inner diameter 1.5 mm, outer diameter 0.86 mm, length 100 mm) over a Bunsen burner. Create a 45 ° bend by allowing the distal end to bend by gravity and removing the glass from the flame once the desired angle is achieved. Repeat this process with a second piece of capillary glass.
- Insert the bent glass capillaries in the in-flow line and vacuum-connected outflow line, respectively and mount them in the "helping hands" to align them with the imaging stage of the microscope (Figure 3).
- Prime the perfusion system by filling all reservoirs with ddH2O (Figure 2). Open the channels one at a time to allow all lines proximal to the flow rate regulator to fill.
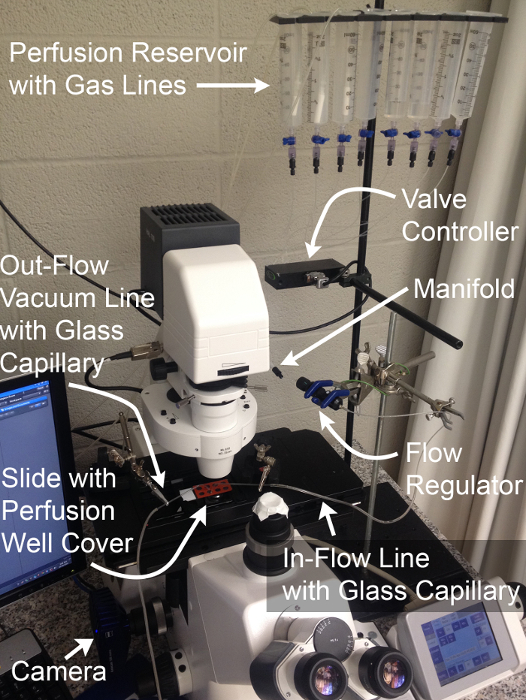
Figure 2: Perfusion System and Imaging Configuration.
Components necessary for the physiological assessment of MT basolateral transport function through simultaneous live fluorescence imaging and rapid solution exchange.Gas lines shown are optional and permit expansion of experiments to the assessment of HCO3– transport. Please click here to view a larger version of this figure.
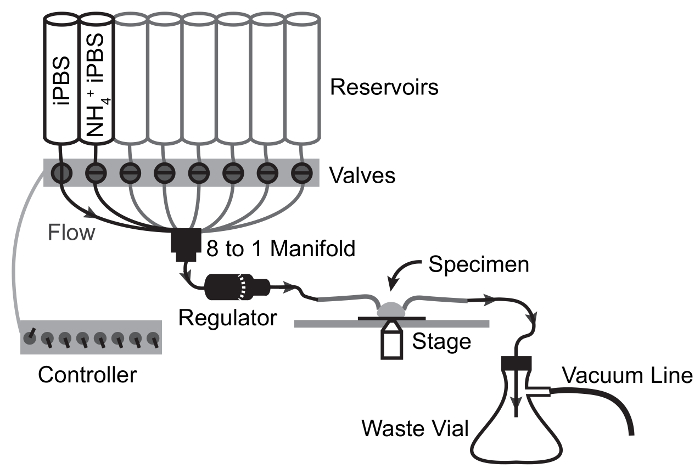
Figure 3: Flow Schematic of Perfusion Apparatus for NH4Cl Pulse Experiments.
Arrows depict flow path and valve switching points. Solution moves from reservoir to specimen by gravity flow and is drawn from the specimen chamber to the waste flask by vacuum suction. Please click here to view a larger version of this figure.
5. Dissection of Adult Drosophila Anterior Malpighian Tubules.
- Gather the dissection dish and pulled glass rod from section 3, a PLL-coated slide from section 2, an adhesive perfusion-well divider, vacuum grease, a 4 x 2" strip of sealing film, 2 pairs of #5 fine forceps, and 40 mL aliquots of ice-cold Schneider's medium and RT iPBS.
- Spread vacuum grease on the sealing tape and press the adhesive perfusion-well divider onto the tape to coat the bottom with grease. Peel off the adhesive perfusion-well divider and place it grease-side-down on top of a PLL coated slide. Remove the perfusion-well divider to leave individual specimen wells traced in hydrophobic grease.
- Place 200 µL of RT iPBS in the grease-encircled well on the PLL coated slide and move the slide under the stereoscope.
- Place UAS-pHerry/capaR-GAL4 flies in an empty fly vial and anesthetize them on ice for 10 min.
NOTE: This method of anesthesia, unlike CO2, ensures that the flies do not dehydrate. - Pour ice-cold Schneider's medium into the dissecting dish and use fine forceps to transfer a single anesthetized female fly into the dish under a dissecting stereoscope.
- Hold the fly by the thorax with a set of forceps and use the other to gently grip the posterior of the abdomen. Pull open the posterior of the fly using the forceps in short, deliberate motions. Once the hindgut is visible, grip the distal end and free the gut and MTs from the underlying tracheoles by pulling the hindgut away from the body through repetitive, brief tugs.
NOTE: The anterior and posterior MTs will be visible where they meet the junction of the midgut and hindgut through the ureter. The first pair of MTs to be free will likely be the posterior tubules as they encircle the hindgut. These can be ignored (Figure 4A). - Pinch off the anterior MTs at the ureter with fine forceps once the second set of MTs is free of the abdomen. This will separate the anterior MTs from the gut and close the ureter.
- Pick up the free anterior MTs with the pulled glass rod by sliding the rod under the ureter such that the tubules fall to either side. Lift the MTs straight up out of the solution.
- Turn the glass rod such that the MTs and ureter are adhered to the underside of the rod and lower the ureter straight down onto the slide. Affix the ureter and seal the distal ends of the MTs by pressing the ureter down onto the glass slide (Figure 4B). Do not manipulate the MTs any more than necessary. The MTs should be floating up in the solution with the ureter anchored to the slide.
- Use the fine end of the glass rod to gently sweep each tubule across the slide surface. Brace the rod against the slide to avoid crushing the tubule and slide the rod over the top of the tubule, moving distal to proximal, to attach the full length of each tubule to the surface of the PLL-coated slide (Figure 4C).
- Place the adhesive perfusion-well divider back on the slide to form a small fluid-filled well over the mounted tubule.
- Place the specimen on the microscope stage. Position the inflow and outflow capillaries over the inlet and outlet opening of the perfusion well, respectively.
NOTE: The well divider can be left off if an open perfusion chamber is desired. In this case the inflow and outflow capillaries can be aligned to opposite sides of an imaging well.
6. Validation of Imaging Protocol and Tubule Health
Note: This protocol is performed on an inverted wide-field epifluorescent microscope with GFP (SEpH) and RFP (mCherry) filter sets (470/40 nm excitation (ex), 515 nm longpass emission (em), 500 nm dichroic and 546/10 nm ex, 590 nm longpass em, 565 nm dichroic), a 10X/0.45 air objective, a monochromatic camera for live-image capture, and imaging software. The protocol can be adapted for any upright or inverted microscope with automated filter switching between GFP and RFP optics and image acquisition software, although optimal exposure times, light intensity, and binning parameters will vary. In all analysis, the fluorescence intensity should be analyzed as mean pixel intensity in the region of interest (ROI), after background subtraction in each channel using an ROI with contains no fluorescence adjacent to the signal ROI.
- Turn on the microscope, light source, and imaging system.
- Open associated imaging software.
- Look through the eyepiece and manually adjust focus until the lumen of the MT is clearly visible under transmitted light.
- Click the "Acquisition" tab in image analysis software and select "2×2" in the "Binning" pull-down menu in the "Acquisition Mode" section.
- Insert a 5% neutral density filter into the light path to reduce illumination light and minimize photobleaching.
- Click the GFP (SEpH) channel in the "Channels" menu, then click "Live" to observe the fluorescent signal via the camera.
- Adjust the "Time" slider to set the exposure time such that the brightest pixel values in the intensity histogram are approximately 40% of the maximum value, then click "Stop" to stop the illumination.
- Repeat steps 6.6 – 6.7 in the RFP (mCherry) channel and confirm the presence of the dilated initial segment of the anterior MT and the absence of cytosolic mCherry aggregates (indicative of tissue damage or overexpression) (Figure 4D).
NOTE: The dilated segment should be clearly apparent as it is the most proximal segment of the tubule and the diameter of the inner lumen of this segment is ~20 µm greater than that of the adjacent transitional segment. 2 x 2 pixel binning is often sufficient but can be increased to further reduce the required illumination intensity. Typical exposure times are between 150 & 800 ms/channel. Use as little light as possible to minimize photobleaching. Minimizing photobleaching is vital to the use of dual-fluorophore indicators such as pHerry as the two fluorophores can bleach independently, thus invalidating any ratio calibration. - Enable a time-lapse imaging protocol by clicking the "Time Series" check box.
- Adjust the "Duration" in the pull-down menu in the "Time Series" section to 10 min and the "Interval" slider to 0 to set the total capture time with a maximum image acquisition rate. A total acquisition rate of 0.2 Hz is often sufficient.
- Check both the GFP (SEpH) and RFP (mCherry) boxes in the "Channels" section.
- Open the iPBS line of the perfusion system by activating the appropriate valve controller and start the imaging protocol by clicking "Start Experiment." After 1 min, switch to NH4Cl pulse solution for 20 s by opening the appropriate valve and closing the iPBS line, then return to iPBS by closing the NH4Cl line and reopening the iPBS valve. Allow the full imaging protocol to complete before stopping the perfusion system.
NOTE: Time-lapse analysis should reveal a stable mCherry signal and a SEpH signal which increases in the presence of NH4Cl, quenches upon washout, and gradually recovers. - Perform a 2-point calibration.
- Remove the well divider by peeling it away from the underlying slide and remove the perfusion capillaries and clamps from the imaging well.
- Apply 200 µL Calibration iPBS (pH 7.4, 10 µM nigericin) to the imaging well with a 200 µL pipette. Remove the solution from the imaging well with the pipette, then replace with another 200 µL of calibration solution. Repeat this process 4 times to ensure complete solution exchange.
- Incubate the preparation in calibration solution for 30 min before imaging. Repeat the imaging protocol using the same parameters determined in steps 6.6 – 6.11, with the modification of only 1 min of image capture.
NOTE: The perfusion system and capillaries are not needed in this step and should not be attached to the imaging well to avoid exposing the capillaries to nigericin. - Add 200 µL Calibration iPBS (pH 9.0, 10 µM nigericin) to the imaging well with a 200 µL pipette. Remove the solution from the imaging well with the pipette, then replace with another 200 µL of calibration solution. Repeat this process 4 times to ensure complete solution exchange.
- Incubate the preparation in the second calibration solution for 10 min before imaging. Repeat the imaging protocol as in step 6.13.3.
- Review the captured image stack in image analysis software to confirm that no pixels in either channel are saturated by clicking "Mean ROI" and scrolling though the image stack with the "Frame" slider while observing that no values reported in the intensity histogram reach the maximum detectable value. If any frames contain pixels that reach the maximum detectable intensity, reduce the exposure time or illumination intensity and repeat section 6.
Note: Once established do not change imaging parameters between experiments or calibration unless point calibrations are to be used in each preparation (see step 8.3).
- Analyze the image stack to plot fluorescent intensity and fluorescence ratio (SEpH/mCherry) as a function of time.
- Click "Mean ROI" and select the freeform tool. Hold left-click to trace a ~50 µm length of MT. Right click to finish drawing the ROI, then repeat in an area adjacent to the MT to define a background ROI (Figure 5A).
- Click "Mean Intensity" under "Measurements." Create a table of intensity values by clicking "Export > Data Table > Create."
- Click the configuration cogwheel icon and de-select all parameters except "Time" and "Mean Intensity." Right-click the tab for the newly created data table, select "Save As", and export the data as a .csv file.
NOTE: Similar measurements can also be made using free software such as ImageJ. - Open a spreadsheet table and import the data table by selecting the "Data" tab followed by "From Text".
- Use functions in the spreadsheet to subtract the SEpH Background Intensity from the SEpH Signal Intensity at each time point. Repeat this process for the mCherry signal.
- Plot each channel intensity as a function of time by selecting the columns containing the Time and background-corrected Intensity data and then clicking "Insert > Scatter (Charts) > Scatter with Straight Lines" (Figure 5B).
- Use spreadsheet functions to calculate the SEpH/mCherry fluorescence ratio at each time point.
- Plot fluorescence ratio as a function of time by selecting the columns containing the Time and ratio data and then clicking "Insert > Scatter (Charts) > Scatter with Straight Lines" (Figure 5C).
7. Full Calibration of pHerry in Malpighian Tubules Ex Vivo.
- Dissect and mount a fresh set of anterior MTs as described in section 5.
- Exchange iPBS for Calibration iPBS (pH 7.4, 10 µM nigericin) as described in step 6.13.2. Incubate for 30 min.
- Locate the MTs and collect pairs of SEpH/mCherry images as described in steps 6.1 – 6.11. Replace the solution with another stock of Calibration iPBS as described in step 6.13.4, wait 10 min, and image again. Repeat this process until the SEpH/mCherry ratio has been imaged in all solutions. Obtain pH 9.0 images last as the specimen rarely recovers from high pH.
- Plot fluorescence ratio of SEpH to mCherry from calibrations in eight specimens as a function of imposed pHi as described in step 6.14.9. Fit the calibration data with a Boltzmann curve to obtain full calibration function according to Equation 1 (Figure 5D). If data are inconsistent, plot calibration sets from each specimen normalized such that a fluorescence ratio of 1.0 corresponds to pHi 7.0 and re-analyze (Figure 5E).
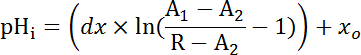
NOTE: If the latter process is necessary individual experiments will need their own internal point calibrations33 (see quantification procedure below (step 8.3)). - Equation 1
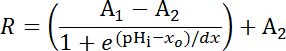
Where R = SEpH/mCherry ratio and A1, A2, xo, and dx are curve fitting parameters representing minimum fluorescence ratio, maximum fluorescence ratio, pKa, and width of the function respectively. xo = apparent pKa of pHerry, which can vary between 7.1 and 7.4 depending on the cell type and exact calibration conditions.
8. Quantification of Basolateral Acid Extrusion from Ex Vivo Malpighian Tubule Epithelia.
- Image pHerry-expressing stellate cells and pHerry-expressing principal cells simultaneously.
- Dissect anterior MTs from a UAS-pHerry/capaR-GAL4 fly as described in section 5, but do not transfer MTs from the dissecting Schneider's medium to the imaging well.
- Dissect anterior MTs from a UAS-pHerry/c724-GAL4 fly in the same dissecting dish using the procedure outlined in section 5.
- Transfer the 2 sets of MTs into the same imaging well as described in steps 5.8 – 5.11.
NOTE: When sweeping the arms of the MTs down to the slide, place the MTs of the UAS-pHerry/c724-GAL4 and the UAS-pHerry/capaR-GAL4 tubules near each other so pHerry-expressing principal and stellate cells can be visualized in the same field (Figure 6A).
- Apply the NH4Cl prepulse as described in step 6.12.
NOTE: If consistent calibration (Figure 4B) could not be achieved, perform a point calibration by setting pHi to 7.0 at the end of each experiment with Calibration iPBS (pH 7.0, 10 µM nigericin, 30 min incubation) after the adhesive perfusion-well divider and the perfusion equipment have been removed. - Calibrate traces from stellate and principal cells of different MT segments (using the absolute or normalized ratio as appropriate) with Equation 2 and analyze the recovery phase after NH4Cl withdrawal by applying exponential decay functions using statistical analysis software and noting the decay constant (τ) (Figure 6B).
Equation 2
Where R = SEpH/mCherry ratio and A1, A2, xo, and dx are curve fitting parameters determined by calibration in step 7.4 (Equation 1).- Calculate acid extrusion rate (JH+, see Equation 3) as a function of pHi to account for variations in resting pHi and acid loading between preparations34. Use the exponential functions derived in step 8.3 to calculate the derivative of pHi with regard to time in each time interval.
Equation 3
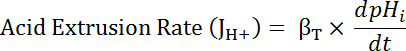
- Calculate the intrinsic buffering capacity (βi; Equation 4) of the cytosol at the pHi from the start of each interval in step 8.3.1 based on previous literature (see Equation 4).
NOTE: In Drosophila, the most thorough characterization of βi comes from larval motor nerve terminals35 and these data can be assumed to hold for MT cells in the absence of other available data.
Equation 4

- Calculate the product of βT (from step 8.3.2)and dpHi/dt (from step 8.3.1) to determine JH+ (Equation 3).
NOTE: In nominally bicarbonate-free solutions such as those described in this protocol, bicarbonate-derived buffering capacity (βb) is assumed to be ~0 mM. Total buffering capacity (βT) is the sum of βi andβb, and thus βi = βT in the absence of HCO3–/CO236. - Plot JH+ as a function of the pHi at the beginning of each time interval as outlined in step 6.14.9.
- Apply exponential decay functions to the portion of all datasets which overlap in pHi using statistical analysis software. Compare rates of change of the resulting functions to compare acid extrusion rates between cells and MT segments (Figure 6C).
NOTE: The most appropriate function used for curve fitting may not always be a single exponential. Other functions can be substituted if they improve the goodness of fit. - Calculate acid flux (see Equation 5) as a function of pHi to account for variations in cell size and shape.
Equation 5

NOTE: Cell dimensions can either be measured directly in images or approximated. Principal cells can be represented as halves of a hollow tube with the following dimensions: inner diameter 24 µm; outer diameter 48 µm; height 50 µm. Transitional stellate cells are variable but can be roughly represented as cylinders with heights of 50 µm and diameters of 10 µm. See final paragraph of Representative Results below. - Apply exponential decay functions to the portion of all datasets that overlap in pHi using statistical analysis software. Compare rates of change of the resulting functions to compare acid fluxes between cells and MT segments (Figure 6D).
- Calculate acid extrusion rate (JH+, see Equation 3) as a function of pHi to account for variations in resting pHi and acid loading between preparations34. Use the exponential functions derived in step 8.3 to calculate the derivative of pHi with regard to time in each time interval.
Healthy tissues and proper identification of anterior MTs are vital to the success of this protocol. During dissection, care should be taken to not directly touch the MTs and to only handle them by the ureter as gripping the MTs directly will lead to breakage (Figure 4A - B). When MTs are swept flat onto the slide, the tubules must be touched as little as possible and excess motion avoided as this will damage the single-cell epithelial layer (Figure 4C). Properly dissected anterior MTs will show even distribution of both red and green fluorescence through the cytosol of epithelial cells and morphologically distinct tubule segments. Tubules damaged by improper perfusion or mishandling will display aggregation of red fluorescence with no paired green aggregates, and misidentified posterior MTs will show uniform morphology from the proximal blind end to the distal ureter (Figure 4D).
Proper function of pHerry must be confirmed though physiologic assessment as well as morphology. The most expedient method of confirming proper pH-sensing is to apply an NH4Cl pulse. Under these conditions the green SEpH signal should report the expected pH changes (a rise in pHi during the pulse as NH3 enters the cell, a gradual decline during the pulse as NH4+ enters through K+ transporters and channels, and a rapid acidification and gradual recovery upon NH4Cl withdrawal21, while the red mCherry signal should remain constant (Figure 5A - B). The magnitude of changes in the SEpH signal will vary with protocol and cell type, but the mCherry signal should be stable in all cases. Changes in the mCherry signal during individual experiments indicate movement artifacts or progressive generation of sensor aggregates due to cell damage. The latter will prevent quantification of pHi and must be avoided. Upon completing the NH4Cl pulse it is important to perform a 2-point calibration (Calibration iPBS, pH 7.4 and 9.0, 10 µM nigericin) to confirm a resting pHi near 7.4 and ensure that the current imaging parameters do not lead to saturation of fluorescence detection when fluorescence is maximized at pH 9.0 (Figure 5C). If resting pH is significantly lower than 7.4, the protocol should be repeated with healthy MTs; and if saturation occurs at pH 9.0, the protocol should be repeated with lower light intensity or exposure time. Once adequate imaging parameters are determined, they should not be changed between experiments or calibrations if the absolute fluorescence ratios are to be used. While the pseudo-ratiometric nature of pHerry can provide a method of movement correction in preparations prone to movement or changes in cell diameter, the absolute quantification of pHi requires full systematic correlation of the pHerry SEpH/mCherry ratio to pHi through the nigericin/high K+ technique. The calibration of pHerry in healthy preparations should produce consistent calibration curves with an apparent pKa of 7.1-7.4 depending on the cell type and calibration conditions (Figure 5D). For preparations in which mCherry aggregation is unavoidable, normalization of ratio values such that a fluorescence ratio of 1.0 corresponds to pHi 7.0 should yield similar results (Figure 5E). If point calibrations and normalized curves are used, imaging parameters can be optimized for each preparation.
Calibrated pHi traces can be used to compare pH regulatory mechanism between cell types. The GAL4/UAS expression system in Drosophila can be used to express pHerry in principal cells and stellate cells of the anterior MT (Figure 6A). pHi regulation can be assessed by acid-loading cells with NH4Cl pulses and quantifying the rate of pHi recovery. This can be accomplished by fitting exponential functions to the recovery phase in different experimental conditions to extract the decay constant (τ) as cells with more rapid H+ efflux will display a more rapid recovery (and thus lower values of τ). Based on this analysis, stellate cells of the MT appear to have more robust acid extrusion than principal cells (Figure 6B). This analysis will hold as long as the resting pHi, extent of acid loading, and buffering capacity are similar between experimental groups. However, when these conditions are not met, it is necessary to account for the observation that intrinsic buffering capacity of the cytosol (βi) of many cells is itself pH-dependent35,37,38 and thus the rate of pHi change at different pHi may not be directly comparable. In such cases, exponential curves fit to the acid extrusion phase following an NH4Cl pulse and previously determined estimates of intrinsic buffering capacity (βi) can be used to plot the acid extrusion rate (JH+) as a function of pHi and determine compensated rate of acid extrusion (Equations 3 & 4). Once differences in acid loading and resting pHi are accounted for, it is evident acid extrusion in principal cells of the transitional segment exceed that of stellate cells (Figure 6C). While compelling, this analysis does not address that measured pHi is a function of volume while acid extrusion across the plasma membrane is a function of membrane surface area. Dividing JH+ by the surface area to volume ratio of the cell of interest will yield values in moles of acid equivalents per unit surface area per unit time (Equation 5), thus allowing correction for differences in cell size and morphology. Approximately two principal cells comprise the circumference of the MT in the transitional segments and thus single cells can be modelled as half of a tube (inner diameter 24 µm; outer diameter 48 µm; height 50 µm). Stellate cells are smaller and tend to be bar-shaped in the transitional segment of the MT2. Exact quantification of surface area and volume is difficult but even conservative approximations of transitional stellate cell shape (cylinder with a height of 50 µm and a diameter of 10 µm) indicate a surface area to volume ratio at least 2x that of principal cells. Taking this into account reveals that the stellate cell acid flux is significantly below that of transitional principal cells, and in fact approaches that of initial segment principal cells (Figure 6D).
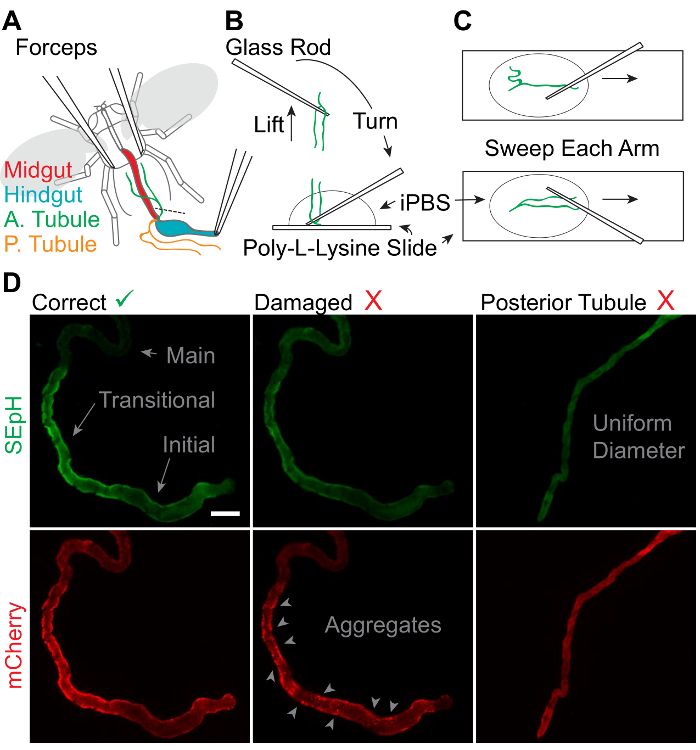
Figure 4: Dissection of Adult Drosophila Anterior Malpighian Tubules.
A. Schematic representation of anterior MT removal with 2 pairs of fine forceps in chilled Schneider's medium. "A. Tubule" = Anterior MT. "P. Tubule" = posterior MT. B. Process of retrieving and mounting extracted MTs using thin glass rods. C. Process of adhering the full length of extracted MTs to a slide for imaging and physiologic assessment. D. Representative widefield images of the SEpH (470/510 nm ex/em) and mCherry (556/630 nm ex/em) components of UAS-pHerry driven by capaR-GAL4 depicting healthy anterior MTs, anterior MTs damaged by insufficient perfusion, and misidentified posterior MTs. Note that healthy anterior MTs display a clear dilated blind initial segment, a constricted transitional segment with relatively increased expression of UAS-pHerry when driven by capaR-GAL4, and a distal main segment. Damaged MTs display noticeable aggregates of mCherry fluorescence with no corresponding SEpH fluorescence. Posterior MTs are uniform in diameter with no morphologically distinct segments. Scale bar = 50 µm. Please click here to view a larger version of this figure.
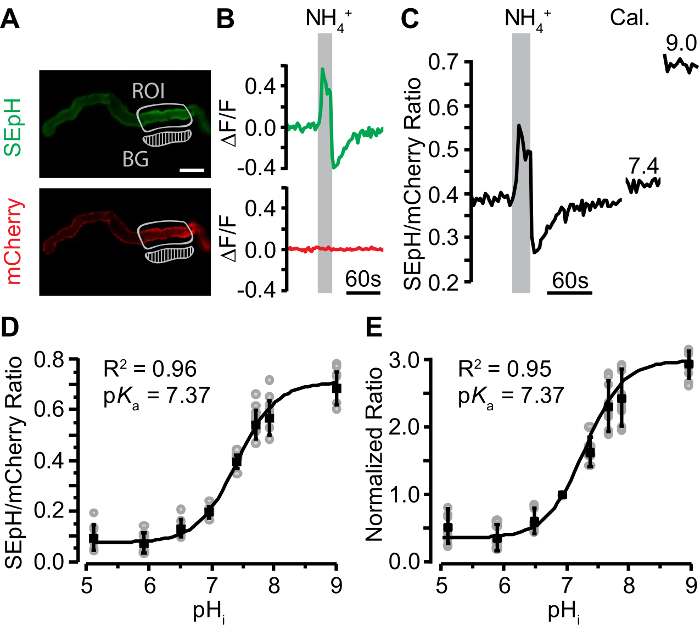
Figure 5: Validation and Calibration of pHerry in Malpighian Tubules.
A. Representative widefield images of the SEpH (470/510 nm ex/em) and mCherry (556/630 nm ex/em) components of UAS-pHerry driven by capaR-GAL4 depicting healthy anterior MTs. "ROI" marks signal region of interest. "BG" marks background region of interest which was subsequently subtracted from the signal ROI in the same channel. Scale bar = 50 µm. B. Relative fluorescence changes in SEpH and mCherry signals of pHerry in response to a 20 s 40 mM NH4Cl pulse. Note that the mCherry signal is stable while the SEpH signal displays a characteristic increase during the pulse (indicative of alkalization, i.e. increased pHi) and a sharp decrease upon washout (indicative of acidification, i.e. decreased pHi). C. Fluorescence ratio of pHerry (SEpH/mCherry) calculated from data in B with additional data after 30 min incubation in Calibration iPBS (10 µM nigericin, 130 mM K+, pH 7.4 and 9.0). D. Calibration curve constructed from absolute pHerry ratio (SEpH / mCherry) as a function of imposed pHi during exposure to Calibration iPBS buffered to one of eight pH values. Gray circles are individual values form 8 preparations. Black squares and bars are mean ±SD. Curve is Boltzmann fit. E. Same data as in D normalized such that fluorescence ratio at pH 7.0 is 1.0. Curve is modified sigmoidal curve fit (see step 7.4, Equation 1). Please click here to view a larger version of this figure.
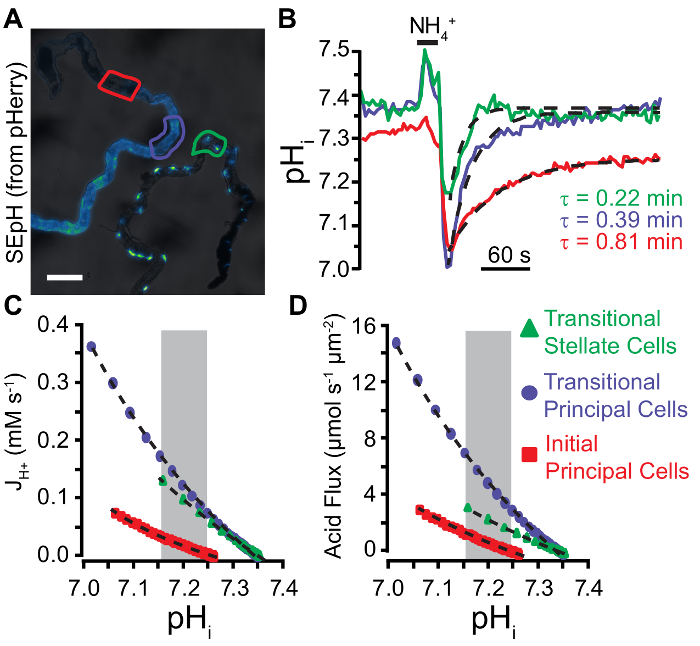
Figure 6: Quantification of Acid Extrusion in Malpighian Tubule Epithelia.
A. Widefield image of SEpH fluorescence (from pHerry) in principal cells of the anterior MT (left, driven by capaR-GAL4 driver) and stellate cells of the anterior MT (right, driven by c724-GAL4). Note that stellate cells are bar-shaped in the initial segment, variable in the transitional segment, and display distinct cellular projections in the main segment. Scale bar = 100 µm. B. Calibrated pHi changes in response to a 20 s 40 mM NH4Cl pulse in the regions of interest denoted in A (principal cells of the transitional segment, principal cells of the initial segment, and stellate cells of the transitional segment). Dashed curves denote single exponential fits applied to the acid recovery phase following NH4Cl withdrawal from which stated decay constant (τ) values are derived. C. Acid extrusion rate (JH+) plotted as a function pHi derived from the exponential fits seen in B. See step 8.3.1 for JH+ calculation (Equation 3). Dashed curves are exponential fits applied to each data plot within the area of overlapping pHi denoted by the gray box. D. Acid flux plotted as a function pHi derived from the exponential fits seen in B and Equation 5. Dashed curves are exponential fits applied to each data plot within the area of overlapping pHi denoted by the gray box. Please click here to view a larger version of this figure.
| iPBS | NH4Cl Pulse iPBS | Calibration iPBS | |
| NaCl | 121.5 | 81.5 | 0 |
| NH4Cl | 0 | 40 | 0 |
| KCl | 20 | 20 | 130 |
| Glucose | 20 | 20 | 20 |
| Buffer | HEPES; 8.6 | HEPES; 8.6 | MES, HEPES, or TAPS; 8.6 |
| NaHCO3 | 10.24 | 10.24 | 0 |
| NaH2PO4 (1H2O) | 4.5 | 4.5 | 0 |
| NMDG | 0 | 0 | 30.5 |
| pH | 6.8 | 6.8 | Varies |
| Osmolarity | 350 ±5 | 350 ±5 | 350 ±5 |
Table 1: Experimental Fly Solutions.
iPBS solutions are prepared at room temperature and pH is set by titration with HCl and NaOH. Calibration solution is titrated with HCl and NMDG. Buffer of calibration solution is varied based on desired pH [2-(N-morpholino)ethanesulfonic acid (MES) for pH = 4.0 – 6.0; 4-(2-hydroxyethyl)-1-piperazineethanesulfonic acid (HEPES) for pH = 6.5 – 7.5; N-[tris(hydroxymethyl)methyl]-3-aminopropanesulfonic acid (TAPS) for pH = 8.0 – 9.0]. All values in mM, except pH (unitless) and osmolality (mmol/kg). Stock nigericin in DMSO is added to calibration solutions to a final concentration of 10 µM just before use.
| GEpHI | Excitation (nm) | Emission (nm) | pKa | Notes |
| Superecliptic pHluorin (SEpH)11 | 395, 488 | 530 | 7.2 | Large linear range, large fold (50x) increase in pH-sensitive fluorescence across linear range |
| Pt GFP42 | 390, 475 | 540 | 7.3 | Validated for use in plant cells |
| Superecliptic pHluorin – mCherry fusion31 | 488, 556 | 530, 620 | 7.2 | Produces unpaired mCherry aggregates in some cells |
| ClopHensor40 | 488, 545 | 525, 590 | 6.8 | pH and Cl– sensor. Updated ClopHensorN30 varient shows less aggregation in neurons |
| pHerry10 | 488, 556 | 530, 620 | 7.2 | Updated SEpH-mCherry fusion with linker from ClopHensor |
| mNectarine44 | 558 | 578 | 6.9 | Correction for photobleaching is often necessary |
| pHluorin245 | 395, 475 | 509 | 6.9 | Variant of Ratiometric pHluorin12 |
| pHred47 | 440, 585 | 610 | 7.8 | Updated varient of long-Stokes shift mKeima49, compatible with FLIM NIR 2-photon imaging |
| pHuji43 | 566 | 598 | 7.7 | Varient of mApple; lower than expected pH sensitivity in some cells |
| pHtomato46 | 550 | 580 | 7.8 | Validated to track vesicular endocytosis, poor cytocolic pH sensitivity |
| pHoran443 | 547 | 561 | 7.5 | Enhanced pH-sensitive orange fluorescent protein |
| SypHer-248 | 427, 504 | 525 | 8.1 | Brighter variant of ratiometric SypHer51, originally for mitochondrial measurements |
Table 2: List of Published Cytosolic GEpHIs
Excitation maxima, emission maxima, and apparent pKa values are approximate and can vary depending on expression system, imaging technique, and calibration method. FLIM = fluorescence lifetime imaging microscopy. NIR = near infrared.
