Morphological changes occur in immune responsive fibroblast cells following activation and promote alterations in cellular recruitment. Utilizing 2-photon imaging in conjunction with a genetically engineered Fibroblast-specific protein 1 (FSP1)-cre; tdTomato floxed-stop-floxed (TB/TB) mouse line and green fluorescently tagged lipopolysaccharide-FITC, we can illustrate highly specific uptake of lipopolysaccharide in dermal fibroblasts and morphological changes in vivo.
Fibroblasts are mesenchymal cells that change their morphology upon activation, ultimately influencing the microenvironment of the tissue they are located in. Although traditional imaging techniques are useful in identifying protein interactions and morphology in fixed tissue, they are not able to give insight as to how quickly cells are able to bind and uptake proteins, and once activated how their morphology changes in vivo. In the present study, we ask 2 major questions: 1) what is the time-course of fibroblast activation via toll-like receptor-4 (TLR4) and lipopolysaccharide (LPS) interaction and 2) how do these cells behave once activated? Using 2-photon imaging, we have developed a novel technique to assess the ability of LPS-FITC to bind to its cognate receptor, TLR4, expressed on peripheral fibroblasts in the genetic reporter mouse line; FSP1cre; tdTomatolox-stop-lox in vivo. This unique approach allows researchers to create in-depth, time-lapse videos and/or pictures of proteins interacting with live cells that allows one to have an increased level of granularity in understanding how proteins can alter cellular behavior.
Lipopolysaccharide (LPS) is an endotoxin found in the outer membrane of gram-negative bacteria1. LPS has a high binding affinity for the toll-like receptor 4 (TLR4)/CD14/MD2 receptor complex2. TLR4 is a pattern recognition receptor commonly found on the outer membrane of a wide range of immune cells, mesenchymal cells, and a subset of sensory neurons3,4,5. Activation of TLR4 expressed on immune cells leads to MyD88-dependent and independent second messenger systems, ending with nuclear-factor kappa beta (NFκB) translocation to the nucleus of the cell. This causes the prototypic immune cell to produce and release pro-inflammatory cytokines such as Interleukin (IL)-1β, IL-6, and TNF-α6. However, how other cell-types respond to TLR4 stimulation is not as clear. Fibroblasts have been implicated in a wide range of pathologies such as cancers and cystic fibrosis and have recently been shown to play a role monocyte chemo-attraction and promoting inflammation7,8,9. Our lab is interested in the role of fibroblasts in the development of acute and chronic pain, as early evidence suggests that factors released by fibroblasts (matrix metalloproteinases (MMPs), tissue inhibitor of metalloproteinases (TIMPs), and fibroblast growth factors (FGFs)) are involved in neuropathic pain10.
Activation states of cells can be determined by a variety of factors that include: induction of immediate-early genes, altered protein expression, cell proliferation, and morphological changes11,12,13. There are many techniques that exist to answer questions we may have about how activation of cells contributes to pathologies, but they all have their limitations. Prototypical immunohistochemistry uses fluorescently tagged antibodies to label proteins of interest in fixed tissue, which may be unspecific and often require significant troubleshooting before yielding fruitful results14. Western blotting is a useful technique when comparing levels of protein expression in post-mortem tissue; however, the histological component is lacking in this technique and researchers are unable to identify any changes in morphology15. RNA-Seq allows us to quantify the presence of messenger RNA in a sample which in many instances yields insightful data; however, the gap between transcription and translation makes it difficult to have temporal resolution after a stimulus16. Confocal imaging is useful in determining the expression and co-localization of proteins that exist in a cross-section of tissues17. Often, this is not representative of the entirety of the tissue sample. In contrast, multiphoton microscopes allow users to image roughly 1 mm deep into a sample, creating a comprehensive three-dimensional representation18. Therefore, we choose to focus on in vivo, 2-photon imaging preps, as data collected from these experiments are more directly relatable to the highly plastic and interconnected microenvironment of living tissue.
An advantage of studying protein-receptor interactions in vivo is that we can clearly capture how cells respond to a stimulus, real-time, in their native environment without the harmful and unpredictable influence of post-mortem tissue extraction19. In addition, longitudinal studies may be performed to assess cellular plasticity and priming that may occur because of activation. Using 2-photon imaging, we preserve the integrity of the microenvironment present when an external stimulus is applied. This protocol provides a way to identify uptake of molecules in fibroblasts following peripheral injection of fluorescently tagged LPS over the course of several hours in vivo and the role of TLR4 in fibroblast activation.
Animal procedures were approved by The University of Texas at Dallas Institutional Animal Care and Use Committee and were in accordance with National Institutes of Health guidelines. All experiments were performed using 8-12-week-old male and female mice bred in-house on a C57BL/6 background. Transgenic mice with cre-recombinase driven by the fibroblast-specific protein-1 promoter were purchased commercially (Jackson, 012641) (FSP1cre)+/- and crossed with tdTomatolox-stop-lox mice, also purchased commercially (Jackson, 007914) and (FSP1cre)+/- ; tdTomatolox-stop-lox and FSP1cre-/-; tdTomatolox-stop-lox mice were bred in-house on a C57BL/6 background (Figure 1A,B,C). Fibroblast-specific protein 1 is an endogenous protein expressed on roughly 72% of fibroblast and represents an effective cre driver in dermal tissue20. Mice were group housed and given ad libitum access to food and water. Room temperature was maintained at 21 ± 2 °C. While we used C57BL/6 crossed male and female mice at 8-12 weeks, we do not believe the age, sex, or genetic background are necessary requirements to run multiphoton experiments. Mice were deeply anesthetized immediately after the experiment and euthanized.
1. Preparation of drugs
2. Imaging set-up
3. In vivo imaging
Initially, we injected LPS-FITC into the hind-paw of wild-type mice in order to visualize the uptake of LPS-FITC in all cell types present in the dermal layer of the paw. Having observed a myriad of cells in the dermal layer of the hind paw uptake fluorescently-tagged LPS in a wild type mouse (Video Figure 1, 2), we tried to specifically target fibroblasts as they are a primary focus in our research. Before imaging the paws of animals injected with LPS-FITC we wanted to be clear that there is no inherent fluorescence of cells in the dermal layer. This is to ensure that after injection, the images we take are true interactions of cells with the fluorescently-tagged LPS and not any imaging artifacts (Video Figure 3, 4). After LPS-FITC injection, only FSP1+ fibroblasts expressing TLR4 bind and uptake the injected protein, with a high level of co-localization with the tdTomato tag expressed by these cells (Video Figure 5). In contrast, mice that have TLR4 knocked out of the entire body (TLR4KO) do not bind and uptake LPS after injection. As evident in the video, silhouettes of cells are visible after LPS-FITC injection which indicates that the drug is dispersing in the interstitial fluid around cells but is not actually being bound by a receptor (Video Figure 6).
To summarize our results, we show, in vivo, that after injection of LPS-FITC, in an FSP1cre; tdTomatolox-stop-lox cell-specific reactivated animal only fibroblasts interact with and uptake LPS. In contrast, whole-body knockouts of TLR4 do not bind and uptake LPS-FITC after injection.
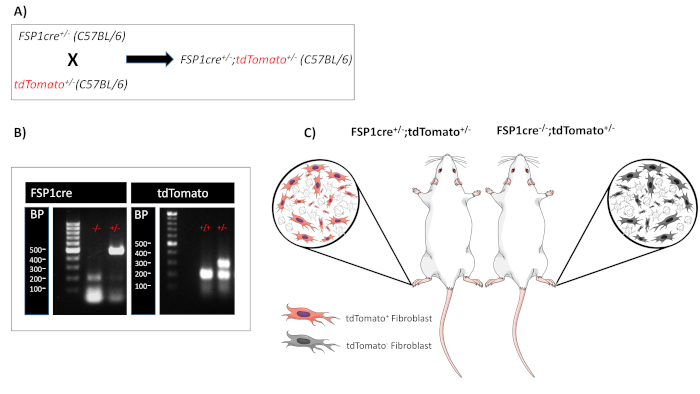
Figure 1. tdTomato is expressed only in FSP1+ Fibroblasts in a Cre-Dependent Manner. A) FSP1cre transgenic mice bred on a C57BL/6 background are crossed with tdTomato mice bred on a C57BL/6 background to generate mice expressed tdTomato in FSP1+ fibroblast in a cre-dependent fashion. B) Representative PCR results depicting both positive and negative FSP1cre mice expressing tdTomato. C) Representative pictograph of dermal fibroblasts in extracellular space located in the mouse paw. FSP1+ mice express a red fluorescent protein only in fibroblasts while FSP1– mice do not. Please click here to view a larger version of this figure.
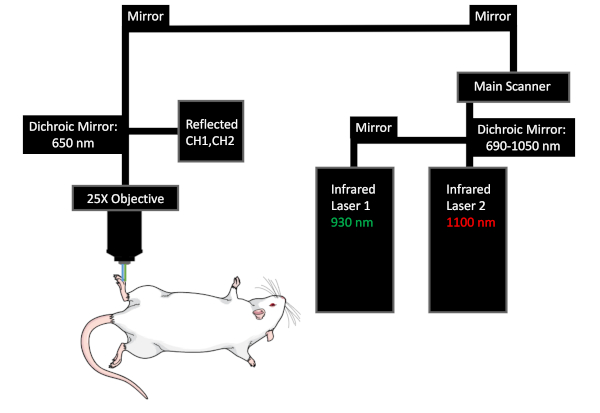
Figure 2. Light Path of Two-Color 2-Photon Microscope. The depiction of the light path set up for the 2-color 2-photon experiment set up. Laser 1 is tuned to 930 nm to excite FITC-conjugated LPS and Laser 2 is tuned to 1100 nm to excite tdTomato found in fibroblasts. Excitation light from laser 1 is reflected by the dichroic mirror (690-1050 nm) while excitation light from laser 2 passes through to the main scanner. Excitation light from both lasers is reflected by a set of mirrors to a second dichroic mirror (650 nm) allowing excitation light to pass through the objective and into the tissue to excite the fluorophores. Light is emitted from the excited fluorophores and is captured by the 25x objective and reflected by the dichroic mirror (650) to the multi-alkali photomultiplier tubes. Please click here to view a larger version of this figure.
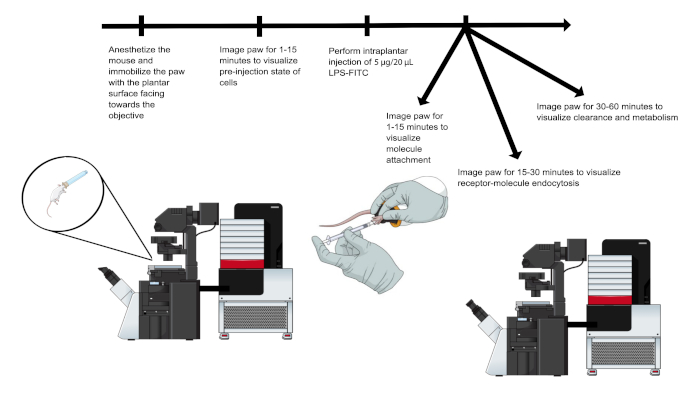
Figure 3. Experimental Flow Chart of 2-Photon Microscopy. Mice are anesthetized and immobilized using a low-flow anesthesia system and stereotaxic apparatus. The plantar surface of the paw faces the objective and is imaged for 15 minutes. Intraplantar injection of 5 µg/20 µL LPS-FITC is performed on the anesthetized mouse and the paw is then imaged for a duration of time necessary for the goal of the experiment. Please click here to view a larger version of this figure.
Video Figure 1. Z-stack Videos of LPS-FITC uptake in Cells in Wild Type C57BL/6 Mice. Z-stack video of the dermal layer of the hind paw of a C57BL/6 mouse before LPS-FITC injection. The plantar aspect of a wild type mouse paw was imaged for 15 minutes prior to injection with LPS-FITC to control for autofluorescence produced in the GFP channel. There is little to none signal in the GFP channel indicating no autofluorescence. Please click here to view this video. (Right-click to download.)
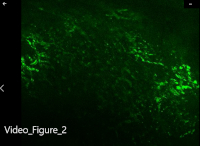
Video Figure 2. Z-stack video of the dermal layer of the hind paw of a C57BL/6 mouse after LPS-FITC injection. The plantar aspect of a wild type mouse paw was imaged for 1.5 hours post-LPS-FITC injection to visualize uptake of LPS-FITC by all cells expressing TLR4. As evident in the video, a multitude of cells bind and uptake LPS-FITC throughout the course of the experiment. Please click here to view this video. (Right-click to download.)
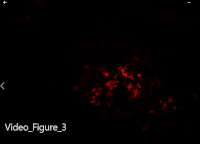
Video Figure 3. Z-stack video of the dermal layer of the hind paw of an FSP1cre; tdTomato mouse before LPS-FITC injection. The plantar aspect of an FSP1cre; tdTomato mouse paw was imaged for 15 minutes prior to injection with LPS-FITC to control for autofluorescence produced in the GFP channel. There is little to none signal in the GFP channel indicating no autofluorescence. tdTomato-positive fibroblasts are visualized. Please click here to view this video. (Right-click to download.)
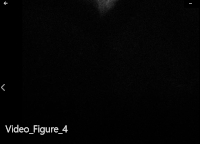
Video Figure 4. Z-stack video of the dermal layer of the hind paw of a TLR4KO mouse before LPS-FITC injection. The plantar aspect of TLR4KO mouse paw was imaged for 15 minutes prior to injection with LPS-FITC to control for autofluorescence produced in the GFP channel. There is little to none signal in the GFP channel indicating no autofluorescence. Please click here to view this video. (Right-click to download.)
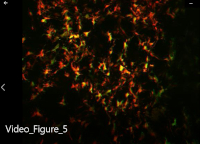
Video Figure 5. Z-stack video of the dermal layer of the hind paw of an FSP1cre; tdTomato mouse after LPS-FITC injection. The plantar aspect of an FSP1cre; tdTomato mouse paw was imaged for 1.5 hours post-LPS-FITC injection to visualize uptake of LPS-FITC by tdTomato-positive fibroblasts expressing TLR4. As evident in the video, highly specific uptake of LPS-FITC via TLR4 expressed on tdTomato-positive fibroblasts is seen. Please click here to view this video. (Right-click to download.)
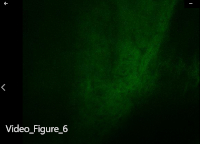
Video Figure 6. Z-stack video of the dermal layer of the hind paw of a TLR4KO mouse after LPS-FITC injection. The plantar aspect of a TLR4KO mouse paw was imaged for 1.5 hours post-LPS-FITC injection to visualize if uptake of LPS-FITC by cells in a whole-body knockout of TLR4 is possible. As evident in the video, no uptake of LPS-FITC is seen by the cell in the dermal layer of the hind paw. Please click here to view this video. (Right-click to download.)
Arguably the most important steps of in vivo 2-photon imaging are: 1) Choosing the right genetic reporter mouse and fluorescently-tagged protein for the multi-photon setup and experimental needs21,22; 2) imaging the correct focal plane to have an accurate representation of the population of cells in the tissue23; 3) minimizing movement due to an improperly immobilized animal24; and 4) choosing when to analyze data qualitatively vs. quantitatively25,26,27. Ensuring to address these points before beginning an experiment will provide the knowledge to collect data that is both reproducible and scientifically rigorous.
An important consideration in the protocol is properly immobilizing the region to be imaged. Respiration from the animal causes minute shifts in the focal plane during imaging and when performing z-stack and time-lapse video, this causes significant distortion in the video and can negatively impact the quality of data produced. Ensuring that the paw is properly immobilized will allow successful imaging of the paw without disruption from respiration. In addition, knowing the localization of cells in the experiment is a critical step in identifying the correct focal plane to visualize. Because we chose to focus on dermal fibroblasts, we only need to image a relatively short distance into the paw to be able to visualize our cell types of interest (~100-150 µm). In other experiments, it is important to consider the capabilities of the microscope and objective one uses because performing an experiment to image cells deep within the tissue may be challenging to impossible given the users set up. Finally, choosing how to approach data analysis is an important consideration in the final steps of the experiment. Here, we are showing that fibroblasts expressing TLR4 are able to uptake and bind fluorescently-tagged LPS which is evident by the robust co-localization of green (LPS) and red (tdTomato expressed by fibroblasts) in the videos. Although no quantitative image analysis is done in this protocol, there are a variety of ways a user could interpret data gathered from this protocol. The first being a simple co-localization analysis using open-source software to measure the intensity of two distinct colors in a given pixel28. This allows the user to identify if two excited fluorophores are detected on a given pixel in an acquired image or video and how much of this overlap there is in a given space. This is useful in identifying if the cells of interest are interacting to some capacity with the injected molecule. An alternative method of quantitative analysis is fluorescence intensity29. The user is able to gather information on the intensity of a given signal within a cell of interest. Data gathered from these analyses may indicate how cells might uptake various amounts of a molecule in comparison to others. These methods of data analysis are an example of how the user might seek to analyze data gathered from an experiment similar to the one performed in this protocol.
Our genetic models allow us to selectively fluorescently tag (tdTomato) FSP1+ fibroblasts in a cre/loxP-dependent manner, which allows for quick and easy visualization of cells in the dermis of the skin. Although this makes visualizing cells easy because of their inherent fluorescence, it is possible to conduct 2-photon imaging without genetically tagged cells if the user is experienced in determining the shift from the epidermis to the dermis. Using the robust levels of autofluorescence from the hair on the skin can be a useful indicator of where the user is focusing and the direction one needs to move in to obtain the desired focal plane. This obviously will only work if the focal plane of interest in close to the skin and will not the cell of interest is deep within the tissue.
Tracking a focal plane throughout the experiment is ideal; however, due to the respiration of a live animal, it makes it difficult to prevent frame shifts over time when incorporating z-stacks into a time-lapse experiment. In order to troubleshoot this issue, the user may consider reducing imaging quality by decreasing line-averaging when using a resonant scanner and increasing the sample rate. As mentioned previously, it is nearly impossible to use a traditional galvanometer scanner in an experiment where a z-stack and time-lapse are incorporated due to the slower sample rate of the scanner.
Changing the duration of image acquisition may allow the user to better suit the needs of their experiment. While imaging the animal for extended periods of time allows the user to gather data throughout all the steps of molecule endocytosis and metabolism, shortening the time to image only specific parts of the process will increase efficiency. It is possible to image for a shorter period of time (~1-15 minutes) to identify molecule attachment, a longer period of time (~15-30 minutes) to visualize receptor-ligand endocytosis30, and the full duration (~30-60 minutes) to visualize cellular activation and potential metabolism of the molecule. This is highly dependent however on the molecule injected and the cells were visualized (Figure 3).
An important note in the experimental protocol described in this manuscript is that currently, we are unable to image identical sample areas pre and post-injection. This is due to the nature of the setup and the method of drug delivery. However, we are able to track cells from a time early post-injection for several hours. While it is important to keep track of individual cells throughout the course of the experiment, regional shifts in cellular activation are equally important and can be captured using this method. Visualizing more than two fluorophores on a multiphoton microscope simultaneously at the moment is impossible given the setup, therefore, a limitation of this method is that users are only able to image two fluorophores as opposed to other imaging equipment where 4 or more fluorophores are able to be visualized simultaneously31. Overall, the protocol described is specific to the goals of our lab and provides a useful tool in identifying cellular activation where the experimental possibilities outweigh the limitations of the protocol.
The methods described in this manuscript provide a number of benefits over existing methods to visualize the activation of cells. The first being that the experiments performed here are in vivo, allowing for real-time visualization of cells binding and up taking molecules which is directly indicative of activation specifically in regard to an insult. This provides advantages over other methods such as traditional live-cell imaging techniques because we are able to preserve the environment of the cells which significantly decreases the likelihood of confounding results due to hyperexcitability and ectopic activity of cells related to the trauma of dissociation32. In addition, the use of a multiphoton microscope in this experimental setting decreases the rate at which fluorophores photo-bleach allowing for continuous and significantly longer imaging sessions which is important if the user applies this method to studies investigating the rate of metabolism or long-term activation33. Lastly, if the cell types of interest reside deep within the tissue (>100 μm) using a multiphoton microscope is necessary to obtain optimal signal34. Overall, if the goal of a user’s experiment is to study real-time uptake and activation of cells in response to an insult then using two-photon microscopy coupled with transgenic reporter lines is more suitable over other conventional imagining techniques.
This technique allows users to perform longitudinal studies on a wide variety of cell types in regard to activation, motility, and cell-to-cell interactions. The advantage of this technique is that it allows for users to use their own genetically-tagged reported animals and substitute the fluorescently-tagged molecule to suit their research interests (e.g., Tie2cre for epithelial cells). This protocol is not restricted to the specific setup shown in our experiments and can be highly modified to fit the needs of any lab utilizing genetic reporter lines and 2-photon dermal imaging in their studies. We plan to use this approach to identify activation and recruitment of immune cells to the site of injury following peripheral trauma and determine what the specific time course of activation and recruitment is so that we may better understand what the best approach is for preventive therapeutics is in regard to various forms of pain.
In conclusion, we have developed a novel technique that allows users to image uptake of fluorescently-tagged LPS by tdTomato-tagged dermal fibroblasts expressing TLR4 using 2-photon microscopy.
The authors have nothing to disclose.
This work is supported by the grant NS096030 (MDB). We would also like to thank the imaging core manager Ved Prakash. We would also like to thank Olympus Discovery Center/Imaging Core facility at UT Dallas for providing equipment and support
10x PBS, 4 L | Fisherbrand | BP3994 | |
700 Series MICROLITER Syringes, Hamilton, Model 705 LT Syringe | Hamilton | 80501 | |
BD Precision Glide Needle 30G | VWR | 305106 | |
Blue Pad | Fisherbrand | 1420665 | |
Filter Cube: Green/Red (BP 495-540 DM570 BP 575-645) | Olympus | FV30-FGR | |
Isoflurane, USP 250 mL | Vedco | 50989-150-15 | |
Lipopolysaccharides from Escherichia Coli O111:B4 – FITC conjugate | Sigma-Aldrich | F3665-1MG | |
Main scanner laser: Spectra Physics INSIGHT DS+ -OL pulsed IR LASER, tunable from 680 nm to 1300 nm, 120 fs pulse width at specimen plane | Spectra Physics | ||
Micro Centrifuge Tubes, 1.5 mL | VWR | 20170-333 | |
Multiphoton Microscope: Olympus MPE-RS TWIN | Olympus | MPE-RS TWIN | |
Objective: Ultra 25x MPE water-immersion objective 1.05 NA, 2 mm WD | Olympus | XLPLN25XWMP2 | |
Personal Lubricant Jelly (Gel) | equate | ZH727 2E F1 | |
SGM-4 Stereotaxic Apparatus | Narishige | 16030 | |
SomnoSuite Low-Flow Anesthesia System | Kent Scientific Corporation | SS-01 | |
Stimulation laser: Olympus-specific SPECTRA PHYSICS MAI TAI HP DEEP SEE-OL pulsed IR LASER, tunable from 690 nm to 1040 nm, 100 fs pulse width at specimen plane | Spectra Physics |