The present protocol describes a method to detect reactive oxygen species (ROS) in the intestinal murine organoids using qualitative imaging and quantitative cytometry assays. This work can be potentially extended to other fluorescent probes to test the effect of selected compounds on ROS.
Reactive oxygen species (ROS) play essential roles in intestinal homeostasis. ROS are natural by-products of cell metabolism. They are produced in response to infection or injury at the mucosal level as they are involved in antimicrobial responses and wound healing. They are also critical secondary messengers, regulating several pathways, including cell growth and differentiation. On the other hand, excessive ROS levels lead to oxidative stress, which can be deleterious for cells and favor intestinal diseases like chronic inflammation or cancer. This work provides a straightforward method to detect ROS in the intestinal murine organoids by live imaging and flow cytometry, using a commercially available fluorogenic probe. Here the protocol describes assaying the effect of compounds that modulate the redox balance in intestinal organoids and detect ROS levels in specific intestinal cell types, exemplified here by the analysis of the intestinal stem cells genetically labeled with GFP. This protocol may be used with other fluorescent probes.
Reactive oxygen species (ROS) are natural by-products of cellular metabolism. They can also be actively produced by specialized enzymatic complexes such as the membrane-bound NADPH-Oxidases (NOX) and Dual Oxidases (DUOX), which generate superoxide anion and hydrogen peroxide1. By expressing antioxidant enzymes and ROS scavengers, cells can finely tune their redox balance, thereby protecting tissue homeostasis2. Although ROS can be highly toxic to the cells and damage DNA, proteins, and lipids, they are crucial signaling molecules2. In the intestinal epithelium, moderate ROS levels are required for stem and progenitor cell proliferation3; high ROS levels lead to their apoptosis4. Chronic oxidative stress is linked to many gastrointestinal diseases, such as inflammatory bowel diseases or cancer. As an example, in a mouse model of Wnt-driven intestinal cancer, elevated ROS production through activation of NADPH-oxidases was found to be required for cancer cells hyperproliferation5, 6. Defining how intestinal cells, in particular stem cells, stem cells manage oxidative stress and how the cellular environment can impact this capacity is essential to understand the etiology of this disease better7.
In a tissue, different cell types present a basal oxidative state that may vary according to their function and metabolism and the expression of varying levels of oxidant and antioxidant molecules4,7. Monitoring ROS in vivo is very challenging. Cell permeable dyes that emit fluorescence according to their redox state have been developed to visualize and measure cellular ROS in living cells and animals. However, their efficacy depends on their diffusion inside living tissues and their rapid readout, making them difficult to use in animal models8.
In the past, the study of the effect of compounds on ROS generation was done using cell lines, but this may not reflect the in vivo situation. The intestinal organoid model, developed by the group of Clevers9, enables the growth of intestinal primary cells ex vivo. Culture of intestinal crypts in matrices, in the presence of defined growth factors, leads to three-dimensional structures, called organoids (mini-gut), which reproduce the crypt-villus organization, with cells from the different epithelial lineages lining an internal lumen, and the intestinal stem cells residing in small crypts-like protrusions.
Here, taking advantage of this model, a simple method is described to study oxidative stress in primary intestinal cells at the single-cell resolution by adding a commercially available ROS-sensitive dye into the organoid culture medium.
Plate readers are often used to detect ROS production in a total population. This protocol uses flow cytometry or imaging assay to detect ROS in a particular cell type with genetically modified cells or specific antibody staining. This work involves mouse intestinal organoid culture and ROS visualization by confocal imaging and quantification by flow cytometry. Using Lgr5-GFP mice-derived small intestinal organoids, it is possible to specifically analyze the level of oxidative stress in intestinal stem cells upon different treatments. This protocol can be adapted to test the influence of exogenous molecules, such as microbiota-derived muramyl-dipeptide (MDP)10, on the ROS balance, after stimulating organoids with the selected compounds.
All animal experiments were carried out after approval by the Institut Pasteur Use Committee and by the French Ministry of Agriculture no. 2016-0022. All the steps are performed inside a tissue culture hood.
1. Preparation of reagents and materials for culturing intestinal organoids
2. Intestinal organoids culture
3. Organoids passaging
4. Preparation of reagents and materials to assess oxidative stress in intestinal organoids
5. Visualization of oxidative stress in 3D organoids by confocal microscopy
6. Quantification of the oxidative stress on the dissociated organoids using flow cytometer
As a proof of concept of the described protocol, the crypts obtained from the Lgr5-eGFP-IRES-CreERT2 mouse line were used in which intestinal stem cells display mosaic GFP expression, which was established by Barker et al., to characterize intestinal stem cells10 initially and allow to map these cells based on their GFP expression. A model is thereby provided to compare ROS levels in a specific cell type population upon different treatments. A ROS inhibitor (NAC) was used, and an inducer (tBHP), known to act on cellular ROS to visualize changes in their levels.
Figures 1A and 1B show representative images of fractions F1 and F4 obtained during the crypts extraction procedure for the intestinal organoid culture. Each fraction must be checked under a microscope or binocular during the extraction procedure to follow crypts detachment and define those fractions enriched in crypts, rather than villi, single cells, or debris. The chosen fractions are then pooled together and passed through a 70 µm cell strainer to remove all the remaining fragments of villi and obtain a preparation with only crypts (Figure 1C). The crypts start to close within a few hours of embedding in BMM, and at D1, round organoids were observed (Figure 1D). After 3-5 days, the organoids will appear with budding structures representing the "newly formed crypts." The organoids are ready for ROS analysis (Figures 1E and 1F).
In the protocol of imaging oxidative stress by confocal microscopy, the slide containing the organoids, incubated with the probe, was imaged with a confocal fluorescence microscope equipped with lasers and filters to detect the Hoechst (ex/em: 361/486), the GFP (ex/em: 488/510) and the fluorogenic probe (ex/em): 644/665) signals. A confocal microscope equipped with 20x air and 63x oil immersion objective allowed the visualization of ROS. In Lgr5-GFP mice, the GFP-positive cells are Lgr5-expressing intestinal stem cells. Supplementary Figure 1 shows representative images obtained with the 20x objective providing an overview of the ROS in several organoids. Figure 3 shows representative images, obtained with the 63x oil objective, of intestinal organoids expressing GFP, non-treated (NT), or pre-incubated or not with the ROS inhibitor NAC, and stimulated or not for 30 min with the ROS inducer tBHP.
In the presence of the inhibitor, the only signal from the dead cells contained in the lumen of the organoid is visible. In the non-treated organoid, the basal ROS levels are shown, proving that stem cells produce higher ROS than differentiated cells (according to the microscope settings, the ROS signal might also be visualized in non-stem cells). GFP-positive cells present a more significant cytoplasmic signal with the inducer in the presence of the fluorogenic probe, demonstrating that ROS levels increase particularly in stem cells after treatment.
Figure 4 shows representative results obtained when analyzing ROS production in intestinal organoids stimulated or not with ROS inhibitor or inducer, using a Flow cytometer equipped with 405 nm, 488 nm, and 630 nm lasers. The gating strategy presented in Figure 4A makes it possible to evaluate ROS production at the level of the whole organoids cell population, defining intact and living cells based on physical parameters and DAPI exclusion (SSC-A vs. FSC-A and DAPI vs. FSC-A) and FSC-H vs. FSC-A) or only in the intestinal stem cells, further gated on cells with GFP high signal. Figure 4B shows the ROS levels in the total population upon collection of 50,000 events. Basal ROS levels in the non-treated (NT) cells decrease after stimulation with the inhibitor (NAC), and on the contrary, increase after challenge with the inducer (tBHP). Cells pre-treated with the inhibitor and then stimulated with the inducer present a lower level than those stimulated with the inducer alone. The results were then analyzed using appropriate software, obtaining the median fluorescent intensity (MFI). The obtained values are presented as a ratio over the non-treated cells, as shown in the graph presented on the right of Figure 4B. Figure 4C shows the same parameters described in Figure 4B in the stem cells, gated as GFP positive cells, showing a 3.5-fold decrease in ROS level upon NAC treatment and 4-fold increase upon tBHP treatment over non-stimulated cells. This result demonstrates that following this protocol, it is possible to quantify differences in ROS levels at the level of the whole cell population or in GFP positive stem cells upon their treatment of the organoids with specific compounds.
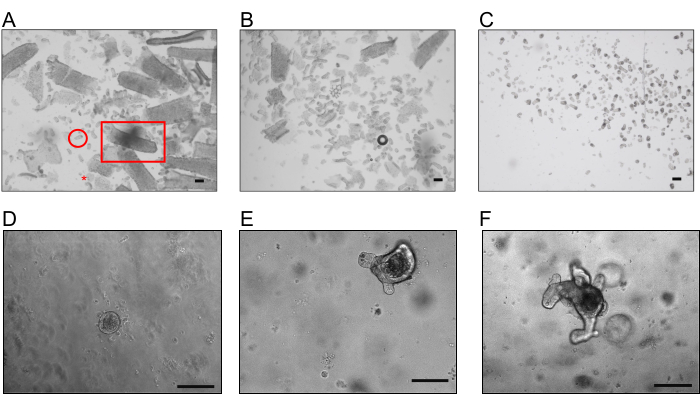
Figure 1: Representative images of crypts and organoids. (A) Example of fraction F1 obtained after the first incubation with EDTA, enriched in villi (square), with some debris (star) and crypts (circle). (B) Example of fraction F4 enriched in crypts. (C) Suspension presenting only isolated crypts obtained after the filtration with a 70 µm cell strainer (scale bar, 200 µm). (D, E, and F). Typical organoids were obtained after 1, 3, and 5 days respectively, after embedding the crypts in BMM (scale bar, 100 µm). Please click here to view a larger version of this figure.
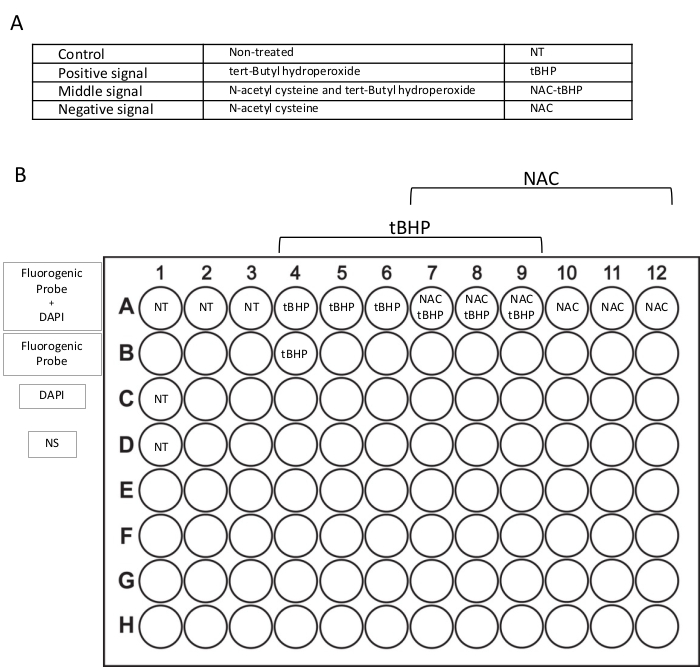
Figure 2: Outline of the experimental plan. (A) Conditions used in this protocol included in each experiment: non-treated wells (NT), inducer-treated wells (tert-Butyl hydroperoxide – tBHP), inhibitor-treated wells (N-acetyl cysteine – NAC), and inhibitor- and inducer-treated wells (NAC-tBHP). (B) Plate format for the flow cytometry assay. Each condition is plated in triplicate (line A). Lines B, C, and D include wells for flow cytometer setting with only the fluorogenic probe, only DAPI, or non-stained (NS) samples. Please click here to view a larger version of this figure.
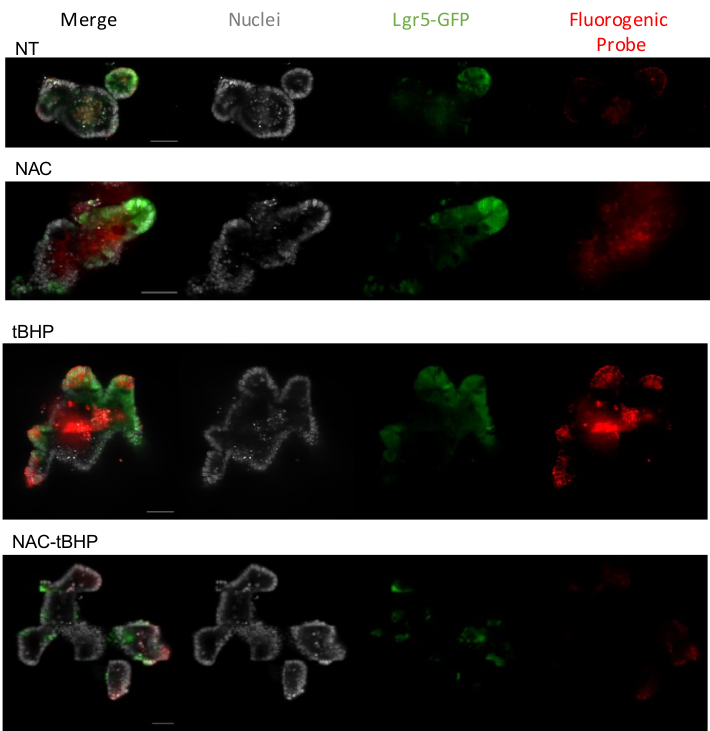
Figure 3: Representative confocal images of ROS staining in organoids. Stitched images were obtained with a confocal microscope equipped with a high-speed EMCCD Camera, 63x/1.4 oil objective, and slit 35 µm, using the lasers 405, 488, 640, and filters 460/50, 535/50, 700/75 to acquire Hoechst, GFP, and the fluorogenic probe respectively. Confocal optical sections of organoids non-treated (NT), treated with the ROS-inhibitor (NAC), with the ROS-inducer (tBHP), or pre-treated with the ROS inhibitor and then stimulated with the ROS-inducer (NAC-tBHP). In grey, nuclei stained with Hoechst; in green, Lgr5-GFP cells; in red, the fluorogenic probe (scale bar, 50 µm). Please click here to view a larger version of this figure.
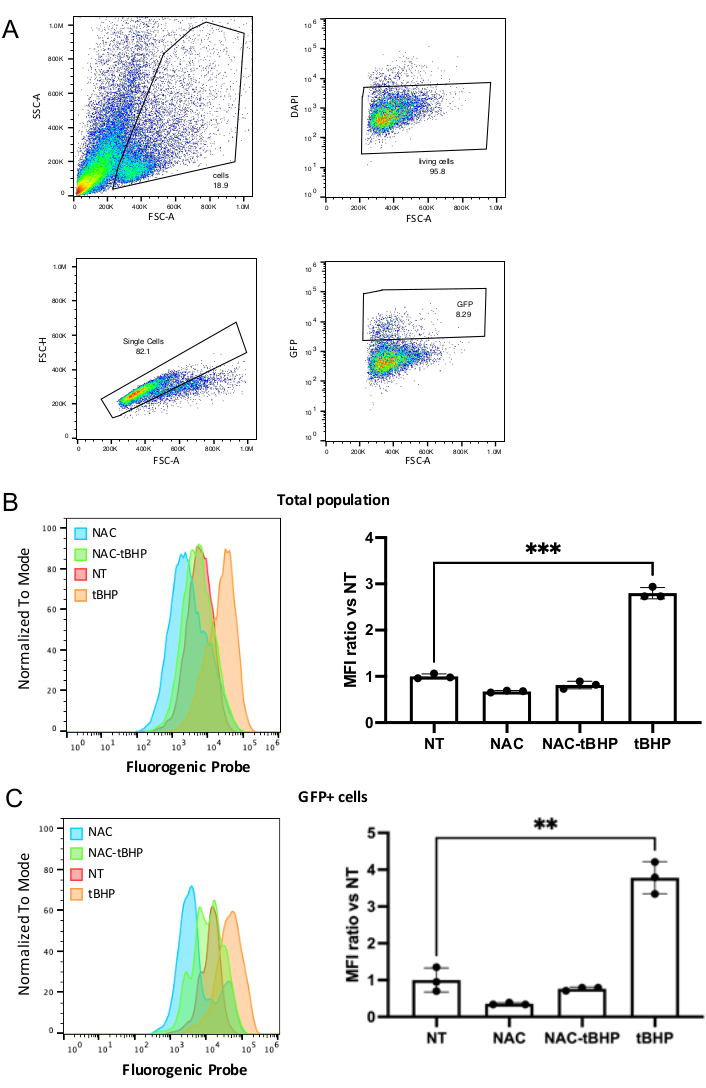
Figure 4: Representative flow cytometry analysis of ROS in cells derived from organoids. (A) Schematic representation of the gating strategy used in flow cytometry analysis: gating for cell shape (exclusion of dead cells and debris accumulated in the organoids lumen), gating for living cells (cells not incorporating DAPI-laser 405), gating for single cells (doublet discrimination), and stem cells (GFP positive cells-laser 488) (FSC: forward scatter, SSC: side scatter). The ROS signal has been acquired using the 630 laser. (B) On the left, histograms were obtained with an appropriate software showing the intensity ROS signals for the total living population (after gating around 10,000 events per condition) in the different samples NT: non-treated; NAC: inhibitor-treated; tBHP inducer-treated; NAC-tBHP: inhibitor- and inducer-treated. On the right, a typical example of the calculated ratio for MFI values over the NT samples obtained during an experiment starting from 3 samples per condition (mean ± SD) (*** P = 0.0003). (C) Same as in B for the GFP positive population (1,000 events per condition) (* P = 0.02). Please click here to view a larger version of this figure.
Supplementary Figure 1: Representative confocal images of ROS staining in organoids. Stitched images were obtained with a confocal microscope equipped with a high-speed EMCCD Camera, 20x objective, and slit 35 µm, using the lasers 405, 488, 640, and filters 460/50, 535/50, 700/75 to acquire Hoechst, GFP, and fluorogenic probe respectively. Confocal optical sections of organoids non-treated (NT), treated with the ROS-inhibitor (NAC), with the ROS-inducer (tBHP), or pre-treated with the ROS inhibitor and then stimulated with the ROS-inducer (NAC-tBHP). In grey, nuclei stained with Hoechst; in green, Lgr5-GFP cells; in red, fluorogenic probe (scale bar, 100 µm). Please click here to download this File.
This work provides a step-by-step protocol to isolate murine jejunal crypts, culture them into 3D organoids, and analyze ROS in organoids by combining a ROS-sensitive fluorogenic probe with qualitative microscopy imaging of whole organoids and quantitative ROS measurement using flow cytometry on single cells following organoid dissociation.
The first critical step in this method is the crypts extraction procedure. Indeed, the quality of crypts preparation is the key to successful organoids formation. It is therefore essential to obtain fractions with enriched crypts and few cellular debris or dying cells. The crypts may be found in different fractions to those indicated in the protocol, as dissociation may vary with the age and health status of the mouse. The number of EDTA incubations can be modified accordingly. If crypts do not seem to be detaching after fraction 4, a 3 min EDTA incubation needs to be repeated. Inversely, suppose crypts already detach after the first EDTA incubation. In that case, the second EDTA incubation may not be necessary, and the sequential vortex steps in DPBS should be done until fractions are obtained with enough crypts devoid of debris. If no dissociation occurs, make sure DPBS without Ca2+ and Mg2+ is used to prepare the collecting tubes, and replace EDTA with a new solution. Crypts are fragile structures, so they should be kept as much as possible on ice and rapidly plated after isolation.
Different plates and drop volumes may be used to cultivate organoids. For instance, crypts can also be plated in 24 or 48 well plates after adjusting the crypts concentration, the volume of the BMM drop, and the medium added in each well. Multiple drops may be plated in the same well in a 12- or 6-well plate. Generally, crypts decrease in size and round up to form small round organoids at day 1 of culture. Formation of new buds should be observed 2-3 days after the plating.
For studying changes in ROS levels in intestinal stem cells, the advantage of the Lgr5-eGFP-IRES-CreERT2 mouse line was taken. A caveat of this model is the selective silencing of the knocked-in allele and the consequent mosaicism of the GFP expression, which can be absent in patches of stem cells or entire crypts. During the imaging protocol, not all the organoids will present stem cells expressing GFP; therefore, not all the organoids will be considered unless it is possible to rely on the spatial position of the cells. Instead, this must be considered when analyzing the GFP negative cell population in the Flow cytometry protocol. Indeed, as it is impossible to rely on the spatial position, the GFP-negative population will be composed of non-stem cells and GFP-negative stem cells.
Here a protocol is provided for the qualitative evaluation of ROS in intestinal organoids. A critical aspect for this part is linked to the working distance of the objectives that are used. The organoids are grown in BMM; they are not attached to the bottom of the well, introducing a distance from the objective focus plan. For this reason, it is critical to plate the organoids in a thin layer of BMM, to minimize this issue. Even in this optimized setting, not all the organoids will be in the correct position to be adequately imaged.
A quantitative analysis of the images might be done using an appropriate image analysis software, evaluating the mean fluorescent intensity of the images in the ROS signal channel as described in the protocol. For this purpose, it is necessary to acquire a high number of images to get a sufficient number of events to be statistically significant. As mentioned before, using the Lgr5-GFP mice, not all the organoids will express GFP, requiring a considerable number of samples to be imaged.
During the flow cytometry procedure, a critical step is the dissociation of the organoids into single cells. If the dissociation is too harsh, cells may die and release DNA. A rock-inhibitor, Y-27632, to counteract anoikis, and DNAse may be added to the dissociation buffer if they do not interfere with the studied pathway. Trypsin dilution or reduced incubation times may be used.
Finally, it is crucial to define the best time point to analyze ROS production after the different treatments (anti- or pro-oxidant) tested. In the case of drugs that rapidly induce ROS within minutes or hours, the imaging assay can be used to determine when there is the maximal induction by adding the fluorogenic probe before the tested compounds. The fluorescence intensity of the probe after organoids stimulation may vary between experiments performed on different days. Therefore, it is crucial always to calculate the ratio with the non-stimulated samples and add controls (oxidant /antioxidant) to verify the reactivity of the probe. NAC and tBHP were used as negative and positive controls as they gave the most conclusive results. Still, other reagents may be used, such as resveratrol as an antioxidant or paraquat/menadione as oxidants. Incubating cells for too long with the fluorogenic probe may be toxic and even modify the cell redox balance, so incubation times must also be tightly controlled. Cells stained with the probe may be fixed and analyzed a few hours after. In this case, for the flow cytometry analysis, the DAPI cannot discriminate between living and dead cells. Instead, a fixable dye for live/dead discrimination should be used before fixation.
Organoids may also be grown for several days (more than 7), but this will increase the number of living and proliferative cells and the dead cells that accumulate in the organoids lumens, generating high background, particularly in the imaging assay. If an abnormal increase in the fluorogenic probe signal is observed, ensure that the solution used to resuspend stimulating compounds is not pro-oxidant per se (i.e., ethanol).
One concern to consider when using this protocol is that live imaging and cell dissociation followed by flow cytometry may induce oxidative stress in cells and generate a background signal. Fixation of the organoids may be considered according to the experiment. Another limitation arises from the difficulty in the in-depth imaging of organoids grown in a 3D matrix. As mentioned in the protocol, the BMM should be distributed on the slide as a thin layer to limit this aspect.
Here, the protocol is designed using a commercially available fluorogenic dye. Its primary advantage is its compatibility with multi-color staining of organoids so that specific cell types. For instance, antibody staining for cell surface markers immediately after the fluorogenic probe incubation may be done to detect particular sub-types. However, the probe is not specific to a specific ROS species as it can detect Superoxide, Nitrite peroxide, and hydrogen peroxide11,12,13. For this reason, it is generally used to detect global oxidative stress. Although commercialized as a cytosolic-only probe, the selected fluorogenic probe could be found to reach mitochondria14. As its specificity can vary between different cellular contexts, we suggest using other complementary approaches to measure ROS when possible. Alternative dyes such as probes specific to detect mitochondria-generated superoxide anions could be used10. A repertoire of chemiluminescent probes was also developed to detect specific ROS species with high sensitivity, such as luciferin-based probes15,16. These have the advantage of being compatible with in vivo imaging but can't be used to map ROS production with specific cell types. Finally, this protocol can be applied to other types of organoids, for instance, colonic organoids derived from human biopsies. In this case, the culture growth medium should be adapted accordingly17. To further analyze the redox machinery within intestinal cells, the organoids culture and dissociation procedures described in this protocol can be combined with transcriptomic and proteomic approaches on whole organoids or Fluorescence activated cell sorted (FACS) organoids cells.
The authors have nothing to disclose.
This work was supported by French National Research Agency (ANR) grant 17-CE14-0022 (i-Stress).
Mice | |||
Lgr5-EGFP-IRES-creERT2 (Lgr5-GFP) | The Jackson Laboratory | ||
Growth culture medium | |||
Advanced DMEM F12 (DMEM/F12) | ThermoFisher | 12634010 | |
B-27 Supplement, minus vitamin A | ThermoFisher | 12587010 | Stock Concentration: 50x |
GlutaMAX (glutamine) | ThermoFisher | 35050038 | Stock Concentration: 100x |
Hepes | ThermoFisher | 15630056 | Stock Concentration: 1 M |
Murine EGF | R&D | 2028-EG-200 | Stock Concentration: 500 µg/mL in PBS |
murine Noggin | R&D | 1967-NG/CF | Stock Concentration: 100 µg/mL in PBS |
Murine R-spondin1 | R&D | 3474-RS-050 | Stock Concentration: 50 µg/mL in PBS |
N-2 Supplement | ThermoFisher | 17502048 | Stock Concentration: 100x |
Penicillin-Streptomycin (P/S) | ThermoFisher | 15140122 | Stock Concentration: 100x (10,000 units/mL of penicillin and 10,000 µg/mL of streptomycin) |
Material | |||
70 µm cell strainer | Corning | 352350 | |
96-well round bottom | Corning | 3799 | |
ball tip scissor | Fine Science Tools GMBH | 14086-09 | |
CellROX® Deep Red Reagent | ThermoFisher | C10422 | |
DAPI (4’,6-diamidino-2-phénylindole, dichlorhydrate) (fluorgenic probe) | ThermoFisher | D1306 | stock at 10 mg/mL |
DPBS 1x no calcium no magnesium (DPBS) | ThermoFisher | 14190144 | |
FLuoroBrite DMEM (DMEM no phenol red) | ThermoFisher | A1896701 | |
Hoechst 33342 | ThermoFisher | H3570 | stock at 10 mg/mL |
Matrigel Growth Factor Reduced, Phenol Red Free (Basement Membrane Matrix) | Corning | 356231 | once received thaw o/n in the fridge, keep for 1h on ice and, make 500 mL aliquots and store at -20 °C |
µ-Slide 8 Well chambers | Ibidi | 80826 | |
N-acetylcysteine (NAC) | Sigma | A9165 | |
tert-Butyl hydroperoxide (tBCHP)solution (70%wt. In H2O2) | Sigma | 458139 | |
TrypLE Express Enzyme (1X), no phenol red (trypsin) | ThermoFisher | 12604013 | |
UltraPure 0.5 M EDTA, pH8.0 | ThermoFisher | 15575020 | |
Y-27632 | Sigma | Y0503 | Rock-inhibitor to be used to minimize cell death upon tissue dissociation |
Programs and Equipment | |||
Attune NxT (Flow Cytometer) | ThermoFischer | Flow cytometer analyzer | |
Fiji/ImageJ | https://imagej.net/software/fiji/downloads | images generation | |
FlowJo | BD Bioscience | FACS analysis | |
Observer.Z1 | Zeiss | confocal system | |
Opterra (swept-field confocal) | Bruker | confocal system | |
high speed EMCCD Camera Evolve Delta 512 | Photometrics | confocal system | |
Prism | GraphPad Software | statistical analysis |