Figure 1 shows the principle of multiple light measurement and the meaning of the collected results. In the MLS spectra results (Figure 2), the abscissa was the height of the sample cell, and the ordinate was the transmission (T%) and backscattering (BS%) intensity. By calculating the MLS spectra results, the system can obtain the changes in the key physical parameters of the sample during the measurement period, including the delta transmission mean value (ΔT) (Figure 3A), the photon free path (Figure 3B), the SI (Figure 3C), and the particle size (Figure 3D). With the extension of the measurement time, the MLS spectra of stable extracts fluctuate little or not at all, and their physical parameters, including the ΔT, photon free path, and particle size, tend to be stable.
Typical sample instability results are shown in Figure 2A,C–E. The spectral results of stable samples tended to be consistent at all scanning times, as shown in Figure 2B, which is a typical characteristic of stable samples. To further quantify the stability parameters, the SI can be used for evaluation. The current protocol allows for the rapid identification of stability under different extraction methods based on SI (Figure 3C) and the analysis of the mechanism of instability. It should be noted that lower SI values are associated with better stability. The sample is considered stable if the SI is <10 within the scanning period. By comparing the SI values, the stabilities of the five samples could be accurately distinguished, and the relevant stability characteristic spectra could be obtained (Figure 4). The particle migration rate (Table 1) combined with the above parameter can further provide insight into the instability mechanism of the sample.
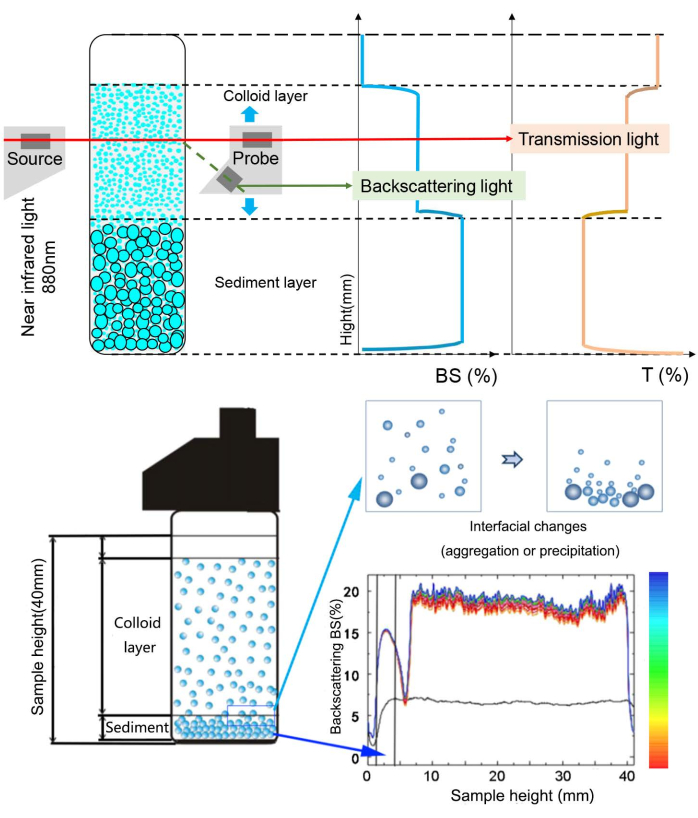
Figure 1: Analysis principle of MLS. The MLS uses pulsed near-infrared light as the light source (wavelength: 880 nm), and two synchronous optical detectors detect the transmission light (T, 0° from the incident radiation, transmission sensor) and backscattering light (BS, 135° from the incident radiation, backscattering detector) passing through the sample, respectively. The light source, transmission light detector, and backscattering light detector constitute the measuring probe. The measurement from the bottom to the top of the sample cell comprises one scan. Any instability in the sample will have a slight impact on the T and BS signal strengths. This impact is recorded and analyzed to characterize various unstable phenomena, including flocculation, stratification, and sedimentation4. Through the calculation of multiple scanning results, the mechanism and speed of the instability of the solution system at the initial stage of instability can be accurately analyzed, and the relationship curve of the layer thickness (sediment layer, floating layer, and clarification layer) with time, as well as the relationship curve of the particle migration speed and particle size with time, can be obtained. Abbreviation: MLS = multiple light scattering. Please click here to view a larger version of this figure.
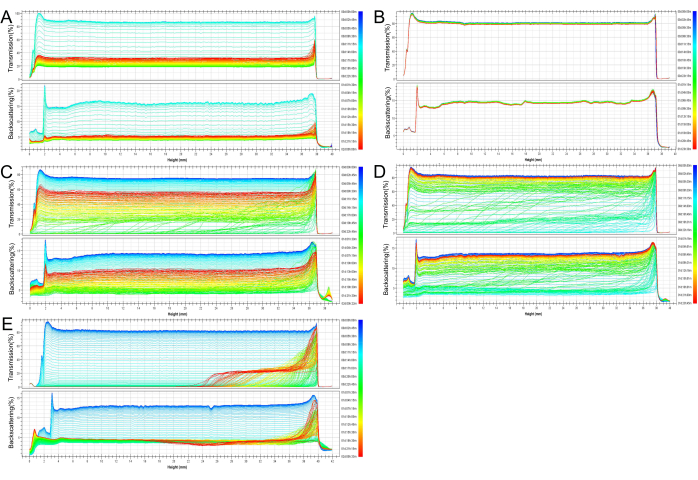
Figure 2: MLS spectra (transmission and backscattering) of PE extract with different extraction methods. (A–E) MLS spectra of E1-E5. From the spectral data, it can be roughly inferred that (B) the E2 sample fluctuated less, indicating that the sample was more stable, while (A) E1 may have had turbidity due to the overall decline in transmission light. (C–E) The E3-E5 samples were quite unstable, and the spectral data of the samples at different heights were different, indicating that stratification occurred in the later period. Abbreviations: MLS = multiple light scattering, PE = Phyllanthus emblica L., EN = extract obtained by method N. Please click here to view a larger version of this figure.
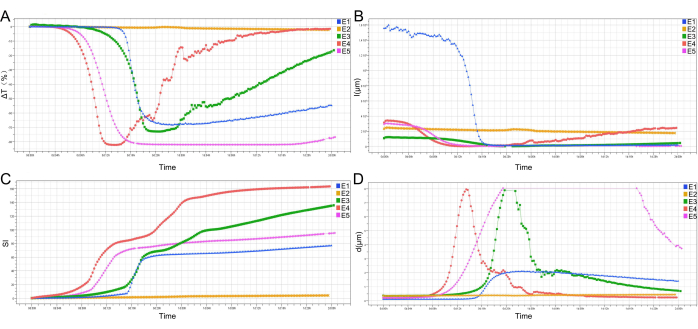
Figure 3: MLS spectra analysis results. (A) With the passage of time, the T value becomes higher, and the sample is more unstable. For E3 and E4, the ΔT level returned to that of the earlier stage in the end, indicating that aggregation and precipitation occurred in these extracts. The ΔT of E5 remained at a low level after turbidity, indicating that E5 may have had a large amount of sedimentation. (B) The trend in the photon free path can reflect the changes in the transmitted light of the sample. (C) The stability of various extracts fluctuated continuously over time, with E2 > E1 > E5 > E3 > E4 being the order of stability over the course of the storage period. (D) Dynamic changes in particle size can reveal the aggregation of particles in the sample. The results show that the particle sizes of all the samples changed considerably within 8-20 h, with the particle size of E3 and E5 even exceeding the measurement range. Thus, this stage is a crucial one for the formation of unstable aggregates of molecules or particles in the sample. Similarly, in the final stage, as the particles began to nucleate and continue to aggregate, a reduction in the particle size was eventually observed after enough particles formed large agglomerates and precipitated. Please click here to view a larger version of this figure.
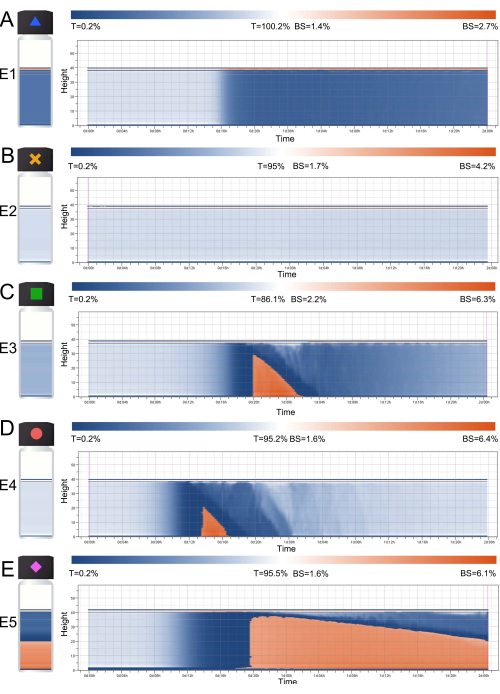
Figure 4: Instability of PE extracts obtained by different extraction methods. The result takes time as the abscissa and the color represent the intensity of transmitted light or backscattered light. The result can directly reflect the real situation of turbidity and stratification of the samples at different time points and heights. The chromaticity band at the top of each result represents the light intensity values corresponding to different colors, where the blue part represents T%, and the brown part represents BS%. (A) The T% of E1 began to decline after 16 h, indicating that the sample was turbid, and the whole process did not delaminate or precipitate. (B) The T% of E2 was consistent throughout the measurement period, indicating that the sample was stable. (C) E3 was turbid at 16 h, and its BS% suddenly increased at 20 h, which indicates that the particles in the sample gathered, stratified, and precipitated at that moment. (D) The result here is similar to that in (C). (E) E5 experienced severe delamination after 20 h, which lasted until the end of the measurement. Please click here to view a larger version of this figure.
| Measurement | Computation zone | Migration rate (mm/h) |
| E1 | 0-24 h | 1.56 |
| E2 | 0-24 h | 0.005 |
| E3 | 0-24 h | 1.476 |
| E4 | 0-19 h | 2.732 |
| E5 | 0-24 h | 1.377 |
Table 1: Particle migration rate results. In the results, the particle migration rate can be regarded as the particle precipitation rate, which can reflect the stability of the sample to a certain extent. Higher migration rates indicate poorer stability. It can be seen from the results that the migration rate was ranked as E4 > E1 > E3 > E5 > E2, and this order is somewhat different from the results for the stability index, SI. This is because this result reflects the average migration rate of particles in the sample during the measurement period rather than the particle migration rate during the rapid precipitation of the sample.
The rapid and accurate assessment of TCM stability has always been a focus of TCM research. To provide more useful information for directing the improvement of the extraction process, this study analyzed the stability and instability mechanisms of a sample using a near-infrared non-destructive technology.
In this protocol, the important stability parameters are calculated based on accurate MLS scan data. MLS scans can collect the transmission (T%) and backscattering (BS%) of the sample in real time and calculate the stability index (SI), particle size, particle migration speed, and other important physical parameters. The calculation formula is given by equation (1)4:
TSI = 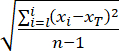 (1)
(1)
where xi is average transmission for each minute of measurement, xT is the average xi, xT = (x1 + x2 + … xi + xi+1 … + xn)/n, and n is the number of scans. SI is an important parameter reflecting the stability of the sample, and a rise in the SI value indicates a decrease in the stability. SI includes all the measurement data for calculation, meaning it can be used to predict and evaluate the stability of samples in the short term.
The particle size calculation is based on Beer-Lambert law. The calculation formula is given by equation (2):
T(l,ri) = T0  , l(d,φ) =
  (2)
(2)
where ri is the inner diameter of the cell, and T0 is the transmission light intensity of the continuous phase. According to the measured transmission light intensity (T), the particle volume fraction (φ), and the set parameters, the particle size can be calculated.
The sedimentation rate is calculated using equation (3):
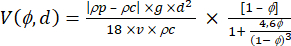 (3)
(3)
V is the particle migration rate (ms−1), ρc is the continuous phase density (kgm−3), ρp is the particle density (kgm−3), g is the gravity constant (9.81 ms−2), d is the average particle diameter (µm), v is the continuous phase viscosity (cP), and is the volume percentage.
In the process of extraction with heat, a large number of hydrolyzable tannins in the PE hydrolyze, releasing the insoluble aglycone ellagic acid. Since ellagic acid is a planar non-polar molecule, it undergoes intermolecular aggregation and precipitation due to hydrophobic interactions, and this is the main cause of precipitation in the solution1. With the extension of the extraction time, more ellagic acid is formed, resulting in poor stability of the sample, and the clarification time of the corresponding sample is shortened. This is well reflected in the results in Figure 4.
Based on the above calculation results, it can be concluded that the precipitation brought on by the aggregation of components or particles, which is evident in the E3-E5 samples, is the main source of the instability mechanism of the PE extraction solution. Due to the polysaccharides dissolved during the extraction process, E2 was relatively stable because the precipitation process was hampered by its high viscosity10. However, as the extraction period was prolonged, large amounts of insoluble components such as ellagic acid were produced, making it difficult to maintain the steady state. Overall, the accelerated instability started at ~12 h, and the extraction duration had a negative correlation with stability, which was crucial for process optimization.
The significance of the MLS method with respect to existing methods is as follows. First, the measurement results are more accurate and authentic since the method is simple to use, requires no sample pretreatment, and the measurements can be taken without touching the sample. Even samples with high concentrations do not need any dilution. Second, MLS has high sensitivity. The changing speeds based on particle concentration and size can be detected at the beginning of the change in the particles dispersed in the liquid preparation. Thus, compared with visual observation, MLS is ~200x more time efficient.
Since changes in temperature can impact the system's scattered light intensity, it should be emphasized that the sample temperature should be maintained constant after installation, which requires an equilibration time. Additionally, interfering elements (such as medicinal material residues) must be removed to appropriately assess the stability of the extract. Finally, it is essential to precisely measure the physical characteristics prior to testing to accurately determine the physical parameters, such as the particle size and photon free path.
There are several limitations to this approach. For instance, oxidation from long-term storage causes abrupt color changes in the extracting solution, which may affect the precipitation assessment and aggregation behavior. It may be challenging to guarantee the consistency of some samples when parallel samples are required, since several samples cannot be measured at once. The equipment investment required for this technology is relatively expensive, which is the primary barrier to its application and promotion.
In the future, we are confident that this method will make outstanding contributions in the field of pharmaceutical preparations, particularly in evaluations of dispersion and in vitro dissolution. It may be utilized to study novel drug delivery systems such as liposomes, nanoparticles, and in situ gels, and due to its advantages of being more efficient, rapid, simple, and comprehensive, this method could considerably shorten the research cycle11,12. Additionally, a stability prediction model based on a large amount of medication instability data could be realized. This technology could be coupled and enhanced with other detection techniques in the future, which might contribute to pharmaceutical research and development.
