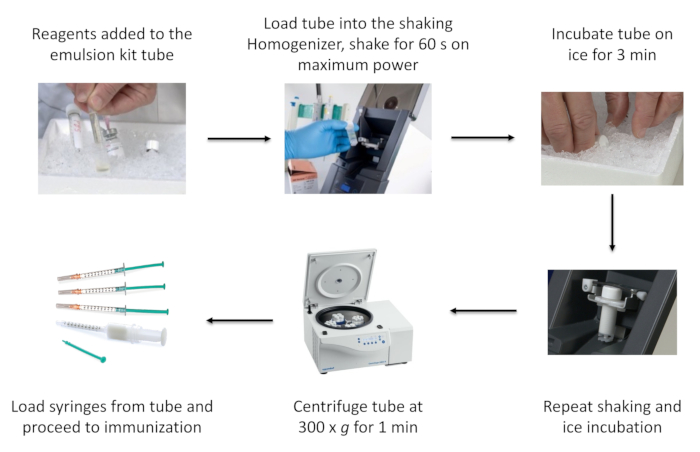
Figure 1: Schematic of the process of emulsion preparation using a commercial emulsion kit. This figure has been reused from Topping et al with permission.
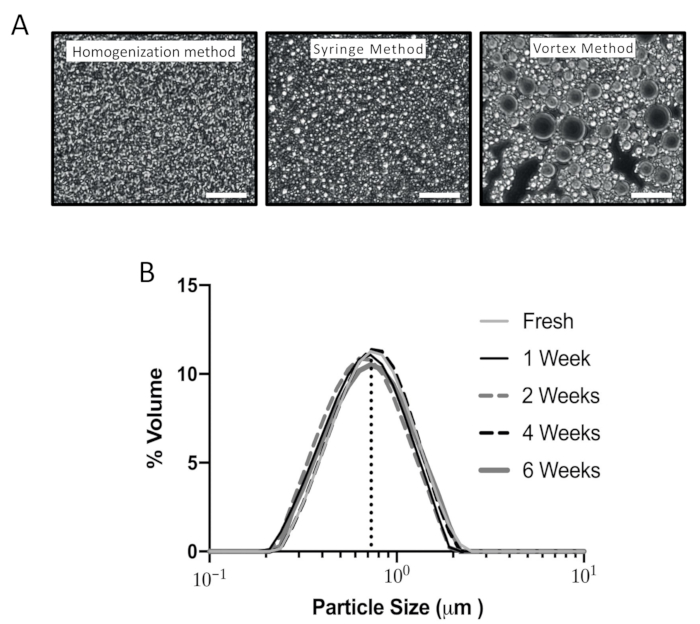
Figure 2: Characterization of emulsions produced using different methods. (A) Representative images from three different preparation methods: standard homogenization method, traditional syringe method, and vortex method. A small amount of emulsion was placed on a glass slide and observed under a phase contrast microscope (400x). Scale bar = 50 µm. A representative preparation is shown of each method from >15 experiments. The average D (the volume weighted mean) was measured with a particle size analyzer to be 0.7 µm for the shaking homogenization method, 1.4 µm for the syringe method, and 5.4 µm for the vortex method. (B) Stability of the emulsion over time was measured using the particle size analyzer. An emulsion of CFA/PBS was prepared with the shaking homogenizer and the emulsion kit, and the particle size determined, using laser diffraction over time. One sample was analyzed immediately and then the emulsions were stored at 4 °C. These samples were analyzed 1, 2, 4, and 6 weeks after preparation. The average D volume weighted mean for all samples was 0.73 µm ± 0.03 µm (SD). This figure has been reused from Topping et al with permission.
Supplemental File 1: Calculation of the amount of each reagent (MOG35-55 peptide, PBS, CFA, and IFA) for emulsion preparation. Please click here to download this File.
