1. The Exercise
- The muscle of interest for this experiment was the elbow flexors (Biceps Brachii).
- Muscle strength was measured for each participant to be able to give each individual an appropriate resistance. This was determined by testing each participant for their resistance maximum (RM).
- For testing the RM, we used a strain gauge device interfaced with a computer through a BioPac (DA-100C) bioelectric amplifier module (BioPac Systems, Goleta, CA) to measure muscle strength. The module was connected to an MP-100 analog to digital converter sampling at a frequency of 1,000 hertz per second, and at a resolution of 24 bits (Fig. 10).
- The strain gauge device was fixed to a bench at a 45° angle. The subjects were instructed to sit behind the device and rest their elbows on the padded area, so that the exertion force is through their wrists. This was the best way to insure that the subject will not recruit any muscle other than the biceps (Fig. 11).
- Strength was determined on 3 occasions with each contraction being 3 seconds in duration with approximately 45 seconds separating the contractions. The average of the 3 measurements was the RM.
- After determining the RM for the biceps muscle of each participant, the intended session of exercise was carried out with 35% of their RM.
- All the subjects underwent the same exercise using appropriate weighted dumbbells to induce the muscle soreness (DOMS). This was carried out by doing 4 sets of 25 repetitions of biceps concentration curls while seated on a chair, and with the elbows supported on their thighs (Fig. 12).
- Each subject was given a 90 second resting period between each set. Subjects either did the full set of 25 repetitions, or were instructed to stop if they failed to steadily control the weight during the exercise.
2. Infra-Red Camera Preparation & Setup
- The room where the infra-red imaging takes place was set at a constant temperature to minimize any external bias from differences in room temperature, which could lead to false thermal readings. For the purpose of this experiment we had a temperature controlled room which was maintained at approximately 23°C (+/- 0.5°C).
- The camera was set at a distance of 1 meter away, and at a perpendicular angle to the skin being measured (Fig. 9a)*.
- After the required distance was set up, the subjects were advised to stand still until the image has been taken. This shouldn’t take more than a couple of seconds, but it is very critical to minimize movement to insure the accuracy of the taken image.
- It is preferable that the room has darker colored paint, rather than lighter colors, to minimize any infra-red interference.
- Lighting is also critical when dealing with infra-red images, because light source that emit infra-red waves like fluorescent or tungsten lighting could give false high readings. The best lighting option would be a room equipped with uniform LED lights, as LED lights hardly produce any infra-red interference (Fig. 9b)*.
* A series of tests were done at our labs using the FLIR 660 IR Camera (Fig. 8), where we compared images of the skin at different angles (0 (perpendicular), 15, 30, 45, and 60 degrees), and at different distances (1, 2, and 5 meters) from the skin, to accurately detect the temperature of the skin. All images were compared to calibrated thermocouples, and the best correlation between the images and the thermocouple readings was at a perpendicular angle and at a distance of 1 meter away from the skin (r = 0.93). The different angles and distances caused a pixilation loss, and decreased the overall correlation between the images and the thermocouple readings.
3. Image Acquirement
- For the purpose of this experiment, the image of the exercised muscle was taken before the exercise, and at 24, and 48 hours post exercise.
- Body heat from sources other than the target could disrupt the thermal image and give false readings. For this reason, no one should be standing beside or behind the intended target.
- In this investigation, pictures of both the exercised and non-exercised arm were taken for comparison purposes. We exercised one of the arms, as was mentioned previously, and the other arm was used as a control (Fig. 4 and 5).
- Image numbers from the IR camera were recorded immediately on a separate spreadsheet, as it could be difficult to identify which image belongs to whom.
4. Image Processing & Analyses
- The acquired IR images were processed using the “ThermoVision ExaminIR” software Version: 1.10.2.
- After selecting the required image for analysis, four regions of interest were identified on the acquired image of the arm using statistical boxes on the software interface (Fig.6).
- When the required regions across the arm have been located, the software shows the Means and Standard Deviations of the temperatures for each of the selected regions. We can then either cross compare each region individually or obtain an average temperature of the whole arm (Fig. 7).
5. Visual Analog Scale & Blood Analysis
- A visual analog scale (VAS) was used to assess subjective soreness of the arm. The scale had a 10 cm (100mm) long line marked “no pain” at one end, and “extremely sore” at the opposite end. Each participant was directed to make a mark along the 10 cm line to indicate their response to soreness.
- The VAS’s were administered to the subjects before the exercise, 24 hours after the exercise, and at 48 hours.
- Peripheral blood was collected from the subjects to measure myoglobin concentration levels in the blood.
- The blood was drawn from the subjects antecubital vein before the exercise, 30 minutes after the exercise was over, and at 48 hours.
- The blood was centrifuged at 4000 rpm for 10 min to separate the serum from the cells. The samples were then stored at -80°C until the analyses of myoglobin was done.
- Myoglobin was measured using a TOSOH “AIA-360” Automated enzyme Immunoassay Analyzer (TOSOH Corp., Tokyo, Japan). The myoglobin Assay kits (Myo 025297, ST AIA-PACK Myoglobin) were used according to the manufactures instructions.
6. Representative Results
The results of IR thermal images taken during this investigation are clearly represented in figure 1. Images taken at the 3 time periods (pre-exercise, 24 hours post-exercise, and 48 hours post-exercise) for the exercised arms of the 41 subjects, showed a noticeable increase in temperature on day 2 (24 hours post-exercise) when compared to pre-exercise temperatures, and temperatures taken at 48 hours. As shown in figure 1, the average skin temperature was 32.80 +/- 1.03 °C for day 1 (pre-exercise), and 33.96 +/- 1.46 °C for day 2 (24 hours post-exercise), and 32.82 +/- 1.29 for day 3 (48 hours post-exercise). This difference in skin temperature from day 1 to day 2 was significant (ANOVA p < 0.01).
However, for the un-exercised arm, changes amongst the 3 time periods were not evident. Figure 1 shows that the average skin temperature was 33.08 +/- 0.83 °C for day 1 (pre-exercise), and 32.79 +/- 1.42 °C for day 2 (24 hours post-exercise), and 33.17 +/- 0.95 for day 3 (48 hours post-exercise). This difference in skin temperature over the 3 days was not significant (ANOVA p = 0.38).
The results of the pain readings from the VAS are shown in figure 2. As seen in figure 2, the reported pain had a dramatic increase on days 2 and 3. Pain levels of the exercised muscle increased from 3.6 +/- 6.1 on day 1, to 36.3 +/- 22.8 on day 2, and 37.5 +/- 25.3 on day 3. This increase from day 1 was significant (ANOVA p < 0.01).
The results of the myoglobin concentration levels are shown in figure 3. As seen in this figure, there was hardly any change between the 2 myoglobin concentrations on day 1 (pre, & 30 minutes post exercise). But on day 3, the increase in myoglobin was very large. This increase on day 3 was approximately 147 nanograms per milliliter (ng/mL) of blood when compared to the first 2 concentrations on day 1. Myoglobin concentrations were 30.12 +/- 7.66 ng/mL at baseline, 31.66 +/- 11.89 ng/mL 30 minutes post exercise, and 178.96 +/- 249.51 ng/mL on day 3. This increase on day 3 was highly significant (ANOVA p < 0.01).
A correlation analysis was done between the skin temperatures obtained from the IR images, and the VAS soreness levels. It was found that there was a considerable correlation between the VAS readings on day 2, and the skin temperature measurement on day 2. This correlation was significant (r = 0.312, p < 0.05). However, there was no evident correlation between the VAS readings and the skin temperatures on day 3. This correlation was insignificant (r = 0.047, p = 0.77).
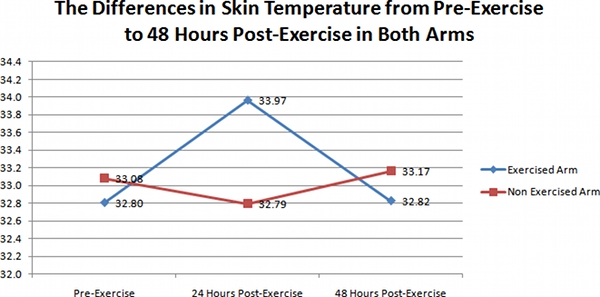
Figure 1. A representative graph of the differences in skin temperature in the exercised arms (Diamonds), and un-exercised arms (Squares) of the 41 subjects over the 3 day time period.
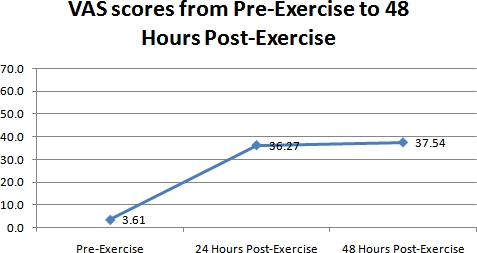
Figure 2. A representative graph of the differences in perceived muscle soreness measured with the VAS over the 3 day time period for all the 41 subjects.
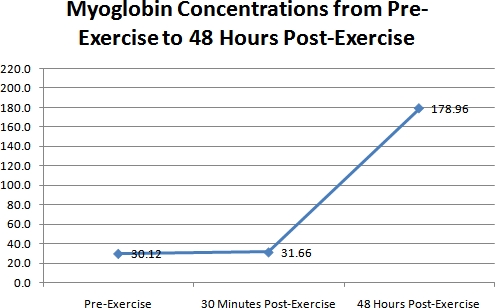
Figure 3. A representative graph of the differences in myoglobin concentrations for all the 41 subjects over the 3 time periods.
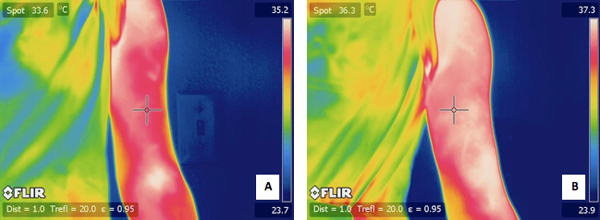
Figure 4. A) a typical IR image of a subject’s exercised arm before the exercise. B) an IR image of the same subjects arm 24 hours after the exercise.
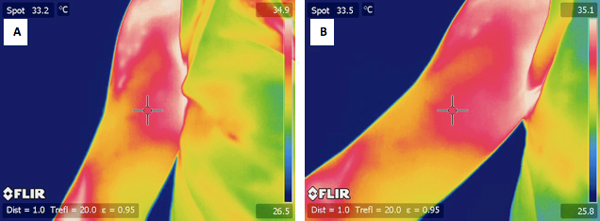
Figure 5. A) a typical IR image of a subject’s un-exercised arm before the exercise. B) an IR image of the same subjects arm 24 hours after the exercise.
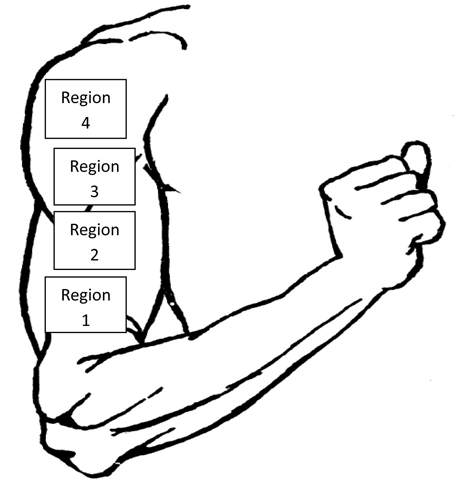
Figure 6. An illustration of the 4 regions of interest for analyzing the thermal image of the arm.
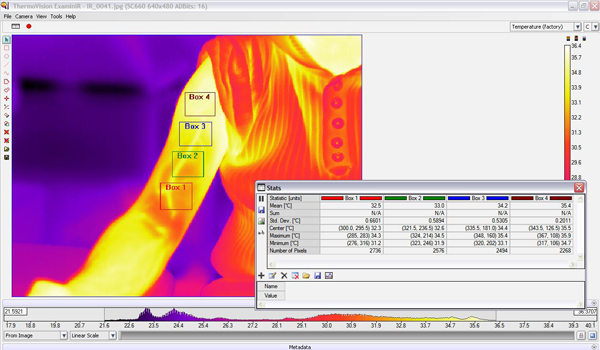
Figure 7. Software interface for the “ThermoVision ExaminIR” showing the 4 boxes of interest on an IR image of an exercised arm. Also shown are the statistical interpretations for each box.
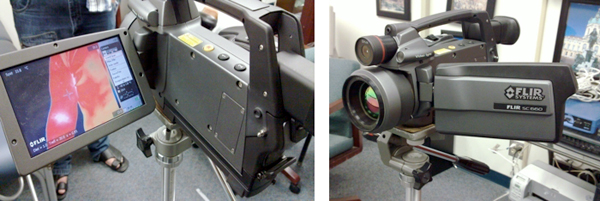
Figure 8. The IR thermal camera used for this investigation (FLIR 660).
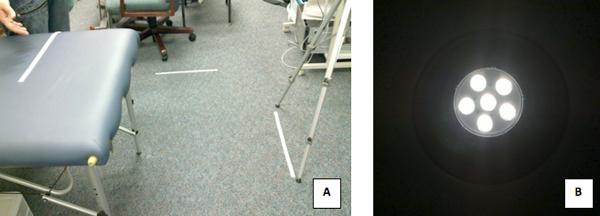
Figure 9. A) The Setup of the IR Camera 1 meter away from the subjects arm. B) The LED lights used in the lab where the images were taken.
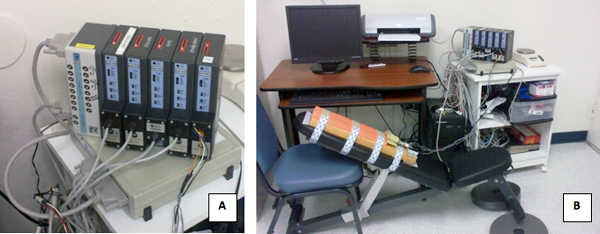
Figure 10. A) The BioPac Modules used for measuring the muscle strength. B) The strain gauge device fixed to a 45° angled bench and hooked to the BioPac system.
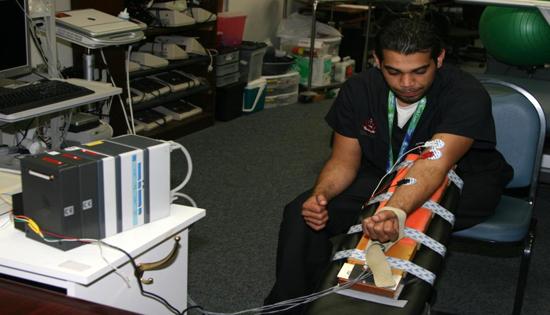
Figure 11. A typical subject exerting force on the strain gauge device.
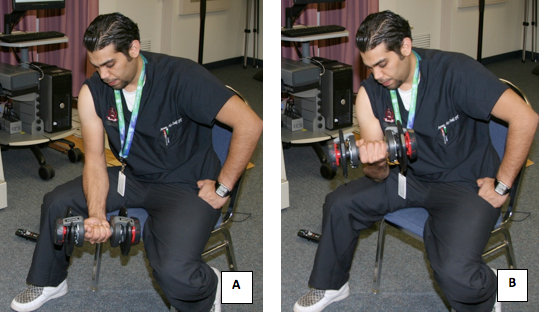
Figure 12. A subject undergoing the exercise protocol for inducing the muscle soreness.
