The inference of the time of death has always been one of the key and difficult issues to be resolved in judicial practice. In the practice of forensic science, for a criminal case, determining postmortem interval plays a crucial role in deducing the time of the crime, locking in the suspect, and narrowing the scope of the investigation. Traditional methods of inferring the time of death are based primarily on early postmortem phenomena, which can generally only be used to infer the time of death within 24 h. However, the long time of death cannot be determined by postmortem phenomena. It is now generally recognized in the forensic science community that forensic entomology has the potential to be an effective method of inferring a longer time of death.
Necrophagous insects are named for their larvae that feed on corpses. Among them, whenever a corpse is present, the adult necrophilous flies will be the first to reach the corpse and lay their eggs or larvae. The larvae feed on corpse tissue and mature into pupae, which fledge into adults. Necrophilic flies play a huge role in the practice of forensic science because of their regular life cycle and geographic distribution, for example, deducting the time of death and determining the place of death1,2. However, the barrier to the use of necrophilous flies in forensic practice is species identification. Morphological methods are still used as the authoritative method for species identification of necrophilous flies. However, morphological species identification requires a high degree of insect integrity. If the flies were in different developmental stages, or due to morphological changes caused by environmental choices, those all make morphological examination more difficult. In particular, the morphology of pupae and pupal shells, which are most often found at the crime scene, is barely recognizable. This, together with the scarcity of morphological experts, makes huge difficulty to the identification of species morphologically. Therefore, the application of molecular biology methods for species identification of flies has emerged, which reduces the difficulty of morphological identification and is independent of developmental stage3,4,5,6,7.
The first step in species identification of necrophilous flies based on molecular biology methods is the efficient extraction of DNA, while specialized kits for insect DNA extraction are not commonly available currently. And how to use common blood kits for DNA extraction of necrophilic flies becomes more forensically relevant. Necrophilic flies found at crime scenes are often mutilated or have undergone decay and DNA degradation. Fly samples are not immediately available for DNA extraction after acquisition, or if possible, complete samples need to be retained due to evidence preservation requirements. Based on the above requirements, in this study, we applied the blood DNA kit based on proteinase K digestion, and selected three fresh Chrysomya megacephala (Diptera, Lepidoptera) samples (Figure 1), one old C. megacephala sample placed in alcohol for two years, and one C. megacephala sample placed in light-protected storage for two years, weighed each of the five samples, elected the insect thorax tissue for DNA extraction. Comparing the quality and purity of DNA extracted from the old and new samples, PCR amplification and electrophoresis of the extracted DNA were performed with necrophilic fly-specific primers located in the mitochondrial CO  gene sequence.
NOTE: A total of five samples of C. megacephala samples were used in this protocol-three fresh samples (Fresh 1, Fresh 2, and Fresh 3), one sample stored in alcohol for 2 years (Old 1), and one sample stored in dry sealed storage for 2 years protected from light only (Old 2). Samples must be labeled according to the experimental requirements.
1. General sample storage and preparations
- Sample selection and preparation
NOTE: Be sure to work in the fume hood when applying ethyl acetate to execute necrophagous flies. Remove the liquid from the surface of the fly before weighing.- Fresh samples: Place three collected fly samples in gas vials after killing them with ethyl acetate. Weigh and name the samples as Fresh 1, Fresh 2, and Fresh 3 and use them immediately in experiments.
NOTE: The fresh fly samples in this protocol had masses of 56.8 mg, 49.3 mg, and 52.1 mg. - Old sample 1: Take out fly samples killed by ethyl acetate and stored in alcohol-filled centrifuge tubes for 2 years in airtight containment, protected from light at room temperature. Weigh the sample after adsorbing the surface liquid with filter paper; call it Old 1.
NOTE: The mass of Old 1 was 42.3 mg in this protocol. - Old sample 2: Take out the fly sample killed by ethyl acetate and stored in a centrifuge tube for 2 years in airtight containment, protected from light at room temperature. Weigh and call it Old 2.
- Fresh samples: Place three collected fly samples in gas vials after killing them with ethyl acetate. Weigh and name the samples as Fresh 1, Fresh 2, and Fresh 3 and use them immediately in experiments.
- Preparation before extraction
- Add a small amount of liquid nitrogen to cool a stainless steel container; wait until all liquid nitrogen has evaporated.
- Put a fly sample in the container; pour in the liquid nitrogen slowly to prevent the liquid nitrogen from splashing and impacting the insect sample.
- Freeze the samples in liquid nitrogen. Remove samples after the liquid nitrogen evaporates.
- Separate the thorax individually, place in a 2 mL centrifuge tube, and cut into the smallest possible slices.
NOTE: Cut the sample into small pieces so that it can be fully cleaved, and DNA can be released in large quantities. - Repeat the above steps for each fly, individually freeze, and then remove to a new centrifuge tube to prevent DNA cross-contamination.
2. DNA extraction
NOTE: All centrifugation steps must be carried out at room temperature (15-25 °C) in a microcentrifuge. All steps must be performed in strict adherence to the principles of asepsis and to avoid cross-contamination.
- Tissue lysis
- Add 180 µL of tissue lysis buffer to a 2 mL centrifuge tube containing a clipped sample.
- Add 20 µL of proteinase K. Mix thoroughly by vortexing at 3 000 rpm for 10 s and incubate at 56 °C until the insect tissues are completely lysed.
NOTE: Add more Proteinase K should be if the tissue is not fully digested. Lysis is usually complete in 1-3h, also can extend lysis time overnight.
- DNA precipitation
- Vortex at 3,000 rpm for 15 s. Add 200 µL lysis buffer to the sample, and mix thoroughly by vortexing at 3,000 rpm for 15 s.
- Add 200 µL of ethanol (96-100%) and mix again thoroughly by vortexing at 3,000 rpm for 15 s.
NOTE: Lysis buffer and ethanol can be preadded together in one step to save time. A white precipitate may form on the addition of lysis buffer and ethanol.
- Pipet the mixture into the DNA adsorption column placed in a 2 mL collection tube. Centrifuge at 6,000 × g for 1 min. Discard flowthrough and collection tube.
- Place the DNA adsorption column from the previous step in a new 2 mL collection tube, add 500 µL of protein removal buffer, and centrifuge at 6,000 × g for 1 min. Discard flowthrough and collection tube.
- Transfer the DNA adsorption column to a new 2 mL collection tube, add 500 µL of desalination buffer, and centrifuge at 20,000 × g for 3 min to dry the DNA adsorption column membrane. Discard flowthrough and collection tube.
NOTE: This centrifugation step ensures the removal of any residual ethanol before the following elution. If there is any carryover of ethanol, centrifuge again at 20,000 × g for 1 min. - Place the DNA adsorption column in a clean 2 mL microcentrifuge tube, directly pipet 100 µL of DNA elution buffer onto the column membrane, incubate at room temperature for 1 min, and then centrifuge at 6,000 × g for 1 min to elute.
NOTE: Elution with 100 µL (instead of 200 µL) increases the final DNA concentration in the eluate but also decreases the overall DNA yield. To maximize the DNA yield, repeat elution once as described in step 2.8. - Store the DNA samples at 4 °C (up to 1 week) or -80 °C for long-term storage.
3. DNA concentration detection
- Determine the values of OD 260 and OD 280 to compare DNA purity and nucleic acid concentration by microplate reader. Repeat three times on each sample.
- Determine the concentration of the extracted DNA by fluorometer using its companion kit, with three replicates for each sample.
- Take 190 µL of working solution into two 0.5 mL centrifuge tubes, take 10 µL each of Standard #1 and Standard #2, add them to the working solutions, and keep them away from light for not less than 15 min.
NOTE: Standard #1 and Standard #2 are accurately calibrated for a certain concentration of DNA. Standard solutions should be accurately configured to ensure the formation of an accurate standard curve. Standard #1 is a 0.2 ng/µL double-stranded DNA (dsDNA) sample; standard #2 is 2,000 ng/µL. The working solution is a dye that binds specifically to dsDNA. - Take 2 µL of test DNA and mix it with 198 µL of working solution in a 0.5 mL centrifuge tube, and keep away from light for not less than 15 min.
NOTE: If the DNA concentration is low, add 5 µL of test DNA with 195 µL of working solution. - After 15 min, turn on the instrument and select dsDNA Concentration Measurement | Long Range. First, test Standard #1, and then, Standard #2 to obtain the standard curve.
NOTE: The standard solution must be used on the same day after it is configured; leaving it for too long will result in a large error in the standard curve. - Place the samples to be tested in the assay wells one by one, adjust the DNA spiking volume to 2 µL, repeat the measurement three times, take the average value, and record.
- Take 190 µL of working solution into two 0.5 mL centrifuge tubes, take 10 µL each of Standard #1 and Standard #2, add them to the working solutions, and keep them away from light for not less than 15 min.
4. PCR and electrophoretic detection
NOTE: The mitochondrial CO gene sequence with a length of 278 bp was taken for PCR amplification with forward primer C1-J-2495: CAGCTACTTTATGAGCTTTAGG, and reverse primer C1-N-2800: CATTTCAAGCTGTGTAAGCATC8, and then 2% agarose gel electrophoresis done to verify the amplification effect and amplification products' length was verified.
- Set up 20 µL of the PCR amplification system by adding 10 µL of 2x Taq mix, 1 µL of each primer, 5 µL of ddH2O, and 3 µL of template DNA; mix well for 10 s in a centrifuge.
- Use the following PCR cycling parameters: predenaturation 95 °C for 10 min; denaturation 95 °C for 30 s, annealing 48 °C for 30 s, extension 72 °C for 45 s for a total of 40 cycles; and final extension 72 °C for 10 min.
- Subject the products after PCR to 2% agarose gel electrophoresis, and after electrophoresis, place them on a gel imaging system for photo analysis.
We used a microplate reader to measure the values of OD260 and OD280 of the extracted DNA solution and then obtained the OD260/OD280 values to evaluate the purity of the DNA. The OD260/OD280 of all fresh samples and old sample 1 was greater than 2. The OD260/OD280 of old sample 2 had a maximum value of 2.187 although the average was 1.753, and its three measurements fluctuated greatly due to the small (≤0.01) values of both its OD280 and OD280 (Table 1). Based on the value of OD260 obtained, we estimated the concentration of DNA. The DNA concentration of the three was of the order: fresh samples > old sample 1 > old sample 2, measured using the microplate reader, but the difference between the fresh samples and the old samples was small, only ~10-20 ng/µL (Table 1), while the DNA concentration of the three fresh samples measured by Qubit fluorometer was greater than that measured by the microplate reader by 125-130 ng/µL, with a difference of 15 ng/µL in old sample 1 and only 1.3 ng/µL in old sample 2. The DNA concentration of the fresh samples > old sample 1 > old sample 2 (Table 2).
DNA extracted by the currently used extraction method contains all DNA components from different sources in the sample. That means that the DNA solution was not only a solution of fly genomic DNA. The primers to specifically amplify fly mitochondrial CO gene fragments were selected by consulting the literature and verified by NCBI-Blast Primer. The results showed that the forward primer C1-J-2495 and reverse primer C1-N-2800 of the mitochondrial CO gene were fly-specific primers with sequence polymorphism and covered many fly species. The amplification results did not show human genes. They were a pair of reliable DNA biomarkers for necrophilous fly identification and were selected for the verification of the results of this experiment.
All the different samples showed obvious electrophoretic bands with lengths ranging from 250 bp-400 bp. The bands were brighter in the fresh samples than in the old samples, and the alcohol-placed old samples (Figure 2, Old1) were brighter than the untreated old samples (Figure 2, Old2), but the old samples also had two bands in different positions. The blank control had no bands (Figure 2).
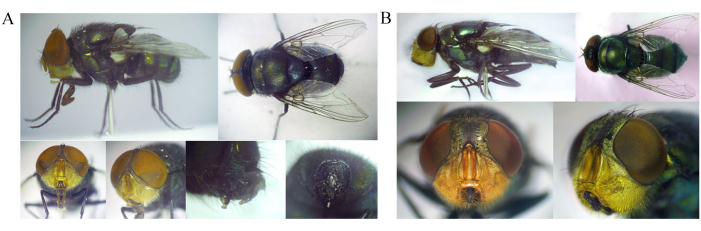
Figure 1: Images of Chrysomya megacephala from different angles. (A) Male; (B) female. Please click here to view a larger version of this figure.
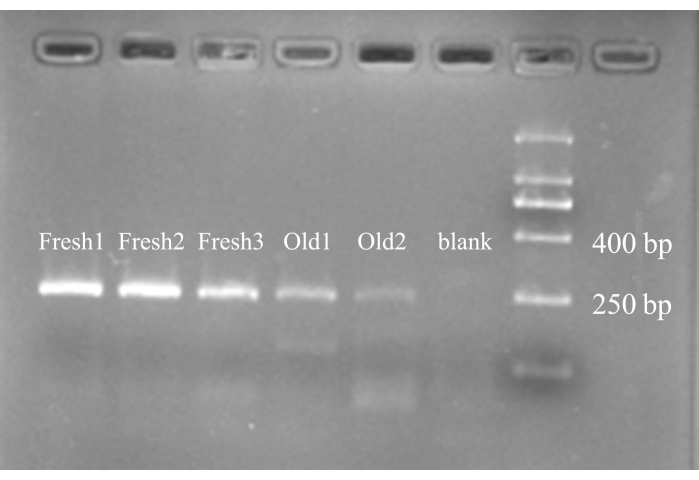
Figure 2: Electropherogram of PCR amplification products. The first three bands from the left are PCR amplification products of DNA from fresh fly samples. The fourth electrophoretic band is the PCR product of DNA from the old fly sample preserved in alcohol. The fifth band is the PCR product of DNA from the old fly sample without any special preservation. The sixth band is a blank control; it is clean, proving that no contamination occurred during PCR amplification. On the far right is the DNA ladder, where we labeled DNA positions with lengths of 250 bp and 400 bp. All the samples' PCR products' electrophoretic bands were slightly above 250 bp and under 400 bp ladder bands. This position matches the length of the 278 bp target gene. It is more obvious to the naked eye that the DNA bands representing fresh samples are brighter than those of old samples. The old samples comprise other DNA bands that are present there in less intense, non-target genes, of different lengths. Please click here to view a larger version of this figure.
| Sample | Fresh1 | Fresh2 | Fresh3 | Old1 | Old2 |
| OD260/OD280 | 2.354±0.036 | 2.245±0.027 | 2.060±0.038 | 2.143±0.012 | 1.753±0.421 |
| DNA(ng/µL) | 119.91±1.686 | 116.084±4.965 | 95.239±3.401 | 86.845±6.14 | 10.151±0.168 |
Table 1: Measuring DNA purity and concentration with a microplate reader.
| Sample | Fresh1 | Fresh2 | Fresh3 | Old1 | Old2 |
| DNA(ng/µL) | 243.333±1.528 | 237.667±2.082 | 226.000±2.000 | 101.000±0.000 | 11.433±0.058 |
Table 2: Measuring DNA concentration with a fluorometer.
DNA extraction is the most critical link in the molecular identification of necrophilous flies, and its extraction method and the quality of the extracted DNA directly affect subsequent detection. In this experiment, we successfully extracted DNA from necrophilous flies by using a common blood kit, without the need to purchase a special insect DNA extraction kit, which makes insect DNA extraction easier to accomplish.
The surface of flies is rich in chitin, especially in the larval and pupal stages where the epidermal chitin can reach 60-70%, making DNA extraction from necrophilic flies difficult9. We found during the extraction process that if the sample was wet, although we had adequately sheared the sample, the sample remained gelatinous when proteinase K was applied for digestion. This prevented the added liquid from passing back through the adsorption column. To solve this problem, we first applied liquid nitrogen to rapidly freeze the samples to make the flies brittle and easy to grind, as well as easy to fully digest. If liquid nitrogen is unavailable for grinding and DNA extraction efficiency is still to be improved, the fly samples can be placed in a ventilated area for approximately 48 h. The samples can be allowed to dry before they are adequately sheared and subsequently DNA extracted.
Considering that the DNA degradation of old samples was a greater concern, fly thorax samples were selected for DNA extraction in this experiment because of the high thorax DNA content. However, the use of the thorax is too disruptive to the morphological integrity of the fly for the complete preservation of subsequent evidence and the need for morphological identification. The samples are difficult to extract when the thorax was rotting. If the samples are fresh, DNA extraction of the foot and wing may be preferable. The foot and wing are symmetrically and bilaterally distributed, and more complete morphological characteristics can be retained after extraction of tissue from one side. However, the concentration of DNA extracted from the wing and foot is relatively low, which is risky for subsequent studies. In addition, the samples were small and easily lost10.
When employing the DNA extraction kit for DNA extraction, the OD260/OD280 values measured by the microplate reader were greater than 2 except for Old sample 2. First, it can be determined that the protein was removed more thoroughly, but there may be RNA contamination, DNA double-stranded breaks due to repeated centrifugation, or DNA degradation in the old samples11. Second, it may also indicate that alcohol prolongs the preservation of RNA.
The DNA concentration is calculated from the OD260 value of the microplate reader, while the Qubit fluorometer is used to establish a standard curve first, and then measure the absorbance value to calculate the DNA concentration. Both methods can realize the measurement of trace DNA concentration, but each has its advantages and disadvantages: The microplate reader applies OD260 to calculate the DNA concentration, but its calculation method is also an estimation. If the sample is mixed with a large number of nucleotides or proteins and other substances that can absorb ultraviolet light, the photometric error will be larger, so we should try to remove them beforehand.
Microplate readers and UV spectrophotometers use UV absorbance for detection, which cannot distinguish between DNA, RNA, degraded nucleic acids, free nucleotides, and other impurities, and the absorbance is also greatly affected by the contamination of other substances, making its readings relatively unreliable. While spiking samples, which are usually measured in drops, the samples are spiked directly without dilution or processing, allowing for simultaneous measurement of multiple samples and direct calculation of DNA purity from OD260/OD280 measurements. The Qubit fluorometer, on the other hand, is designed to measure only the concentration of double-stranded DNA by applying two standard solutions of known concentration to establish a standard curve and applying the characteristics of fluorescent dyes that bind specifically to double-stranded DNA. However, each sample needs to be individually pretreated and then individually measured, which is cumbersome for batch sample applications, and the purity of the extracted DNA cannot be measured. In the specific application of the two can be selected according to their own needs for quality testing of DNA12,13,14.
The DNA concentration of fresh samples was greater than that of old samples placed in alcohol and greater than that of untreated old samples, regardless of whether the DNA concentration was measured by a microplate reader or a Qubit fluorometer. For long-term storage, the samples can be immersed in alcohol to prevent the growth of bacteria and fungi15,16.
The different measurement methods had less impact on the DNA measurements of old samples without any treatment, probably because old samples were more degraded, especially protein and RNA may all be degraded faster than DNA. In contrast, fresh samples had more protein and RNA and therefore, had a greater impact on the results. If only double-stranded DNA concentrations are compared, we should use the results of the Qubit fluorometer, and the results of our experiments also created a significant DNA concentration gradient in the old and new samples.
The DNA content of both fresh and old samples after DNA extraction can be used for subsequent molecular biology analysis. As in this experiment, the primers selected for the mitochondrial CO gene were only 278 bp, and all of them could be successfully amplified by DNA. The mitochondrial CO gene is, in turn, a locus recognized in flies for its DNA barcoding potential, thus allowing for the identification of necrophilic fly species by subsequent sequencing analysis17. The molecular biology of longer preserved samples can be successfully achieved by selecting primers for other shorter DNA sequences. Of note, the electrophoretic bands of the old samples had two bands with different positions and shorter sequences, probably due to non-specific amplification of the primers caused by the degradation of the DNA coupled with the low annealing temperature.
However, in this experiment, fewer samples were preserved for a long period to satisfy the need for repetitive experiments, while the results only required representative samples. Therefore, we did not conduct a repeatability test, which may be exploratory for the preservation of old and new samples but does not affect the successful extraction of necrophilic fly samples.
In summary, the use of a blood DNA extraction kit can also aid in the extraction of necrophilic fly DNA. Both old and new samples can be successfully extracted, and all the extracted DNA can be used for subsequent analysis. Alcohol is also favorable for the long-term preservation of fly DNA samples.
