Summary

How to Build a Laser Speckle Contrast Imaging (LSCI) System to Monitor Blood Flow

Published: November 11, 2010
doi:

Summary

This video demonstrates how to build a Laser Speckle Contrast Imaging (LSCI) system that can easily be used to monitor blood flow.

Abstract

Laser Speckle Contrast Imaging (LSCI) is a simple yet powerful technique that is used for full-field imaging of blood flow. The technique analyzes fluctuations in a dynamic speckle pattern to detect the movement of particles similar to how laser Doppler analyzes frequency shifts to determine particle speed. Because it can be used to monitor the movement of red blood cells, LSCI has become a popular tool for measuring blood flow in tissues such as the retina, skin, and brain. It has become especially useful in neuroscience where blood flow changes during physiological events like functional activation, stroke, and spreading depolarization can be quantified. LSCI is also attractive because it provides excellent spatial and temporal resolution while using inexpensive instrumentation that can easily be combined with other imaging modalities. Here we show how to build a LSCI setup and demonstrate its ability to monitor blood flow changes in the brain during an animal experiment.

Protocol

1. Imaging Setup

  1. A camera with a macro zoom lens should be mounted to a vertical stage or surgical microscope (Instead of a macro zoom lens, a microscope objective and lens or a simple two lens system could be used depending on the desired magnification).
  2. Download appropriate software from our website to control the camera (http://bach.bme.utexas.edu/mediawiki/index.php/Software).
  3. The camera software should be used to confirm an object is in focus at the desired height
  4. A laser diode with a collimation kit should then be set up so that divergent laser light illuminates the object.
  5. Turn down/off all ambient light to confirm that the laser light is evenly illuminating the entire field of view of the camera.
  6. In this example, red laser light was used because it was easier to demonstrate how to build the system, but infrared laser light could just as easily be used and would have the additionally benefit of penetrating deeper in tissue. Also, with appropriate filters in front of the camera to block visible light, infrared light could be used with the room lights on.

2. Surgical Preparation

  1. This is a non-survival surgery, although the experiment could be done chronically in a survival study by using a chamber window.
  2. Anesthetize the animal and place it into a stereotactic frame.
  3. Remove the skin and tissue surrounding the skull.
  4. Using a dental drill, thin the skull over the desired brain region to transparency being careful to flush the surface with saline frequently in order to avoid damaging the brain.
  5. Use dental cement to create a well around the desired region and then place a drop of mineral oil or silicone gel into the well to improve visibility.
  6. Alternatively, the skull could be removed and a chamber window could be created here.

3. Collecting Data

  1. Use the camera software to acquire images and also calculate speckle contrast values.
  2. Place the animal into the field of view of the camera and adjust the camera height or lens focus until clear images of the vasculature are seen.
  3. Make sure that enough laser light is reaching the camera without saturating it. Using the histogram of the image, adjust the laser power to ensure the majority of camera pixels are excited to about half their capacity.
  4. Select the number of images you wish to acquire and how much averaging to do before beginning the experiment.
  5. Once the experiment begins, blood flow changes can easily be monitored by selecting regions of interest or by generating an image of relative blood flow.

4. Representative Results

Figure 1 shows an example of a typical raw speckle image and a converted speckle contrast image that should be generated when using the software to examine blood flow in the brain. For visualizing changes in blood flow, it is easier to have the software generate relative maps of blood flow. Figure 2 shows a typical series of relative blood flow images during a transient increase in blood flow that travels across the field of view. The red color represents an increase in blood flow while the blue color shows a decrease. The green color indicates that there is no change in blood flow relative to a given baseline.

Figure 1
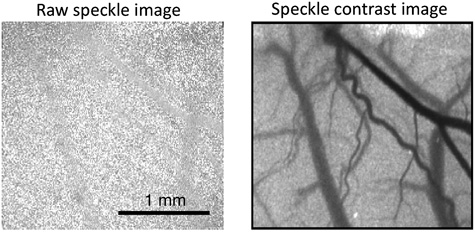
Figure 1. Example of a raw speckle image (left) and speckle contrast image (right).

Figure 2
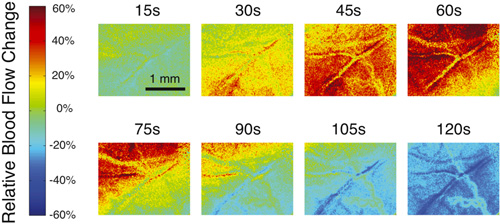
Figure 2. Example of several relative blood flow images at different time points during a transient increase in blood flow followed by a decrease in blood flow.

Discussion

In this video we have demonstrated how easy it is to build and use a laser speckle contrast imaging (LSCI) system to look at changes in blood flow. LSCI was developed in the 1980s as a way to generate maps of blood flow in the retina1. While still used to image the retina and skin perfusion, it has become extremely popular as a technique to image blood flow in the brain2. This is largely due to the excellent spatial and temporal resolution provided and the simplicity of the instrumentation. LSCI has been used to investigate changes in blood flow due to functional activation3,4, cortical spreading depression5, and stroke6,7. It also has the advantage of easily combining with other techniques like reflectance imaging8, voltage sensitive dyes9, or oxygen probes10,11 so that multiple physiological parameters can be imaged simultaneously.

Divulgations

The authors have nothing to disclose.

Acknowledgements

The authors acknowledge support from the American Heart Association (0735136N), Dana Foundation, National Science Foundation (CBET/0737731), and the Coulter Foundation.

Materials

Material Name Type Company Catalogue Number Comment
Firewire camera   Basler scA640-74f  
Macro zoom lens   Edmund Optics NT58-240  
Laser diode   Thorlabs HL6501MG  
Laser diode controller   Thorlabs LDC201CU  

The technique is versatile enough to be used with a wide range of equipment. The only things necessary to perform the experiment are a compatible camera with a lens, a laser diode of any type with a controller, and the provided software. A table of the specific equipment used in the video is included above.

A complete list of additional parts that can be used in this experiment is found on our website, http://bach.bme.utexas.edu/mediawiki/index.php/Hardware

References

  1. Briers, J. D., Fercher, A. F. Retinal blood-flow visualization by means of laser speckle photography. Invest. Ophthalmol. Vis. Sci. 22, 255-259 (1982).
  2. Boas, D. A., Dunn, A. K. Laser speckle contrast imaging in biomedical optics. J. Biomed. Opt. 15, 011109-011109 (2010).
  3. Dunn, A. K. Simultaneous imaging of total cerebral hemoglobin concentration, oxygenation, and blood flow during functional activation. Opt Lett. 28, 28-30 (2003).
  4. Devor, A. Coupling of the cortical hemodynamic response to cortical and thalamic neuronal activity. Proc Natl Acad Sci U S A. 102, 3822-3827 (2005).
  5. Ayata, C. Pronounced hypoperfusion during spreading depression in mouse cortex. J Cereb Blood Flow Metab. 24, 1172-1182 (2004).
  6. Jones, P. Simultaneous multispectral reflectance imaging and laser speckle flowmetry of cerebral blood flow and oxygen metabolism in focal cerebral ischemia. J. Biomed. Opt. 13, (2008).
  7. Dunn, A. K., Bolay, H., Moskowitz, M. A., Boas, D. A. Dynamic imaging of cerebral blood flow using laser speckle. J Cereb Blood Flow Metab. 21, 195-201 (2001).
  8. Dunn, A. K., Devor, A., Dale, A. M., Boas, D. A. Spatial extent of oxygen metabolism and hemodynamic changes during functional activation of the rat somatosensory cortex. Neuroimage. 27, 279-290 (2005).
  9. Farkas, E., Bari, F., Obrenovitch, T. P. Multi-modal imaging of anoxic depolarization and hemodynamic changes induced by cardiac arrest in the rat cerebral cortex. Neuroimage. 51, 734-742 (2010).
  10. Sakadzic, S. Simultaneous imaging of cerebral partial pressure of oxygen and blood flow during functional activation and cortical spreading depression. Appl. Opt. 48, (2009).
  11. Ponticorvo, A., Dunn, A. K. Simultaneous imaging of oxygen tension and blood flow in animals using a digital micromirror device. Opt Express. 18, 8160-8170 (2010).

Play Video

Citer Cet Article
Ponticorvo, A., Dunn, A. K. How to Build a Laser Speckle Contrast Imaging (LSCI) System to Monitor Blood Flow. J. Vis. Exp. (45), e2004, doi:10.3791/2004 (2010).

View Video