Here, we present a method for light microscopy analysis of tracheal terminal cells in Drosophila larvae. This method allows for quick examination of branch and lumen morphology in whole animals and would be useful for analysis of individual mutants or screens for mutations affecting terminal cell development.
Cell shape is critical for cell function. However, despite the importance of cell morphology, little is known about how individual cells generate specific shapes. Drosophila tracheal terminal cells have become a powerful genetic model to identify and elucidate the roles of genes required for generating cellular morphologies. Terminal cells are a component of a branched tubular network, the tracheal system that functions to supply oxygen to internal tissues. Terminal cells are an excellent model for investigating questions of cell shape as they possess two distinct cellular architectures. First, terminal cells have an elaborate branched morphology, similar to complex neurons; second, terminal cell branches are formed as thin tubes and contain a membrane-bound intracellular lumen. Quantitative analysis of terminal cell branch number, branch organization and individual branch shape, can be used to provide information about the role of specific genetic mechanisms in the making of a branched cell. Analysis of tube formation in these cells can reveal conserved mechanisms of tubulogenesis common to other tubular networks, such as the vertebrate vasculature. Here we describe techniques that can be used to rapidly fix, image, and analyze both branching patterns and tube formation in terminal cells within Drosophila larvae. These techniques can be used to analyze terminal cells in wild-type and mutant animals, or genetic mosaics. Because of the high efficiency of this protocol, it is also well suited for genetic, RNAi-based, or drug screens in the Drosophila tracheal system.
Cell shape is critical for function of individual cells within an organism, as well as cells that function as part of a tissue or organ. We use Drosophila tracheal terminal cells, a component of the insect respiratory system, to investigate the molecular mechanisms that participate in controlling two conserved types of cellular morphology: branching and tube formation (lumenogenesis). Terminal cells are located at the tips of a network of branched tubes that functions to deliver oxygen to internal tissues1 and have an elaborate branched morphology which depends on an FGF signaling pathway that is controlled by local oxygen levels within target tissues2. Terminal cell branches are thin tubes, with a gas-filled subcellular lumen running through each branch. The distinct cellular architectures of terminal cells, along with the ease by which genetic analysis can be performed in Drosophila, make these cells an excellent model for investigating mechanisms of cellular outgrowth, branching, and intracellular tube formation. Terminal cells have proved a useful model for understanding some of the signaling pathways leading to branched cell differentiation, outgrowth, and maturation2-4. Using this system unbiased, forward genetic screens for cell morphogenesis mutants have been performed, yielding insights into mechanisms controlling cell shape5,6. For instance, these screens have revealed that a specific RabGAP is required for cytoskeletal polarity and vesicle trafficking in lumen formation and positioning7; that integrin-mediated adhesion is required for branch stability8; and that epithelial PAR-polarity proteins regulate polarized membrane trafficking required for both branching and lumen formation9. Other studies in terminal cells have shown that asymmetric actin accumulation and microtubule organization is required for cell elongation and lumenogenesis10. Thus, diverse, conserved cell biological mechanisms contribute to terminal cell morphogenesis.
Here, we describe a method to rapidly fix intact third-instar Drosophila larvae for analysis of terminal cell branching and lumen formation. This protocol can also be carried out on both first and second instar animals. Key to this technique is the ability to visualize terminal cells that are genetically labeled by fluorescent protein expression directly through the larval cuticle of intact animals. Since this procedure does not require any post-fixation manipulations, such as antibody staining, to observe the cells, it is well suited to high throughput analysis, including genetic or drug screening. Fluorescent protein expression reveals the structure of the cytoplasmically-filled branches. Tube formation can be monitored in parallel using brightfield microscopy to identify the gas-filled lumen, which contrasts with the surrounding fluid-filled tissues.
Included in this protocol is the method for generating genetic mosaics based on the MARCM system11, to produce homozygous mutant terminal cells labeled with fluorescent proteins in otherwise unlabeled animals. This is necessary, since terminal cells only elaborate their complex structures relatively late in development; genetic mosaics allow for bypass of gene requirements in other tissues earlier in development. To generate MARCM clones, trachea are labeled using the tracheal-specific driver breathless (btl)12. Described here is the protocol for the Drosophila X chromosome; for other chromosomes, a similar procedure can be used, with genetic reagents appropriate to the chromosome being examined. Here, trachea are labeled by expression of a cytoplasmically localized GFP, but the procedure works equally well with expression of other fluorescent proteins, such as DsRed.
Additionally, we have included a method to quantify branching patterns and lumen formation in terminal cells, based on methods developed for characterizing neuronal branch patterns13. This kind of quantitative data can be critical in discerning the precise role of genes in the branching or lumenogenesis process, as well as allowing for direct comparisons between different mutants9.
1. Mosaic Generation
2. Screen for Mosaic Animals
3. Heat Fixation
4. In vivo Imaging of Tracheal Terminal Cells
5. Analysis and Quantification of Terminal Cell Morphology Using ImageJ
Results are shown in Figure 2. A single lateral group (LG) terminal cell shows extensive subcellular branching (visualized by GFP; A) and a gas-filled subcellular lumen running through each of the branches (visualized by brightfield microscopy; B). These images were collected from a mosaic L3 larva, generated using the MARCM system described in sections 1 & 2, and heat fixed and imaged, as described in sections 3 & 4. Panels C & D show a NeuronJ generated trace, as described in section 5, of the branches and the lumen respectively of the images shown in A & B. Panels E & F show the location of the fat body (FB) branch in a larva prepared for imaging as described in sections 3 & 4. Note that in this example, the animal is not a mosaic, and GFP is expressed throughout the entire tracheal system. Panels G and H show an example of a GFP-labeled terminal cell that was heat fixed for too long a time. GFP is diffuse (G), branches have broken down and portions of lumens are no longer gas filled, thus appearing as breaks in the brightfield image.
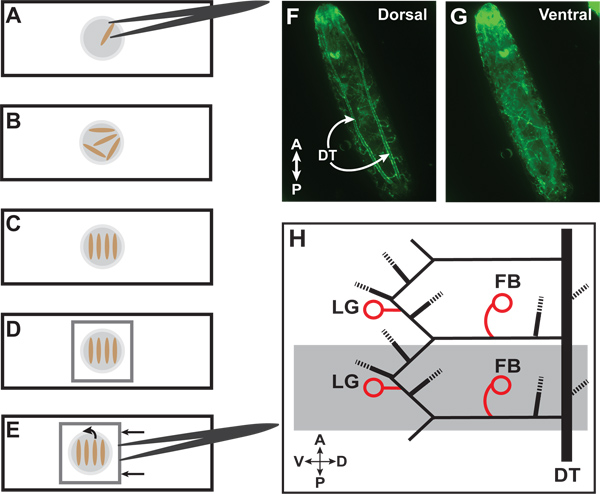
Figure 1. Larvae preparation and identification of terminal cells. (A) Place larva in a drop of 100% glycerol on a glass slide. (B) Multiple larvae can be placed for heat fixation. (C) After heat fixation, organize larvae parallel to each other and perpendicular to the long axis of the slide. (D) Place cover glass over larvae. (E) To reorient larvae, carefully push cover glass with forceps to roll the animals. (F) Wild-type third instar larva with GFP expressed throughout the tracheal system. The paired dorsal trunks (DT) are visible on the dorsal side. (G) The same larva after the rolling technique with the ventral side now facing upwards. (H) Diagram of lateral view of two third-instar tracheal hemisegments (one hemisegment is highlighted in grey). Circles indicate lateral group (LG) and fat body (FB) terminal cells which we use for quantitation. Dashed lines represent other branches of the tracheal system which we do not routinely quantitate. For a full description of the tracheal branches in a larval segment, refer to Ref 1.
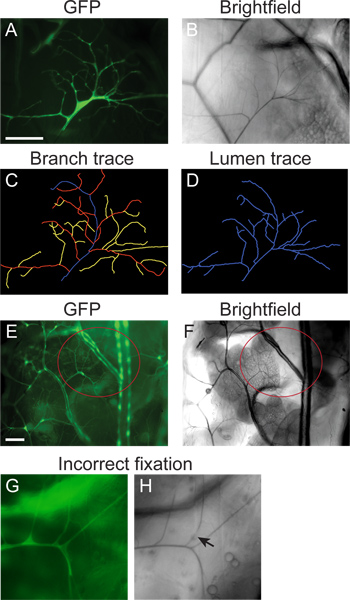
Figure 2. Representative images. (A-D) Mosaic L3 larvae were generated using the MARCM technique (section 1) and fixed and imaged using the protocol in sections 2-4. The branching pattern of a single LG terminal cell was visualized by mosaic expression of GFP (A); the gas-filled lumen visualized with brightfield microscopy (B). (C) Tracing of the branching pattern of the cell in A, generated using NeuronJ (section 5). (D) Tracing of the gas-filled lumen of the cell in B, generated using NeuronJ (protocol section 5). (E, F) A fat body (FB) terminal cell (highlighted by the red circle) visualized by GFP expression throughout the tracheal system (E) and brightfield microscopy (F) in a larva prepared by the protocol in sections 2-4. (G, H) Example of fixation artifacts obtained when the sample is heated for too long a period. GFP is diffuse and small branches have degraded (G). Areas of lumen also no longer appear air-filled (arrow in H). Scale bar: 100 μm.
The heat fixation technique described here is a rapid and convenient tool for imaging Drosophila larval tracheal terminal cells. Here, we use this technique to examine the branching and lumen pattern of wild-type cells. Tracheal cells expressing GFP, driven by the tracheal specific promoter breathless, can be easily visualized through the larval cuticle after heat fixation. The specific branching patterns of individual terminal cells, as well as those of the air-filled lumen, can be quickly visualized and measured using this method. This technique can also be performed on both first and second instar larvae. However, care must be taken in fixing smaller animals, as fluorescent protein expression can easily be disrupted.
In the method shown here, we describe an analysis of mosaic animals with GFP expressed in single tracheal cells. However, the same techniques are applicable to analysis of tracheal cells under a number of experimental manipulations. For instance, animals in which gene expression has been altered by molecular approaches, throughout the tracheal system or in individual cells by expression of RNAi transgenes or modified proteins, can also be examined with this approach. Non-genetic treatments which affect terminal cell development, such as drugs or hypoxia2,14, can also be characterized using these methods. In these latter cases, it is necessary to start with a Drosophila stock constitutively expressing GFP or another fluorescent protein throughout its tracheal system in order to visualize branching patterns. Gas-filling can be examined regardless of fluorescent protein expression.
Here, we only show examples of untagged (cytoplasmically localized) GFP being used to label the tracheal system. However, the methods described here are also suitable for detection of other native fluorescent proteins, such as DsRed, as well as fluorescent proteins which have been modified to be localized to specific subcellular structures. For instance, actin:GFP or tubulin:GFP fusions can be used to visualize the tracheal cytoskeleton10.
The authors have nothing to disclose.
We thank Gillian Stanfield for comments on the manuscript. T.A.J. is supported by the University of Utah Genetics Training Grant T32-GM007464 from NIH NIGMS.
Name of Reagent/Material | Company | Catalog Number | Comments |
Student Dumont #5 forceps | Fine Scientific Tools | 91150-20 | |
Leica MZ16 Dissecting microscope (or equivalent) | Leica | MZ16 | |
AxioImager M1 compound microscope (or equivalent) | Carl Zeiss | Equiped with AxioCam MRm, A-PLAN 10X/0.25, EC PLAN-NEOFLUAR20X/0.5, Filter Set 38HE | |
100% Glycerol | BioExpress | M152-4L | |
Fly stock | Genotype: w FRT19A tub:GAL80 FLP122; Btl-GAL4, UAS-GFP y w FRT19A | ||
Fly stock | Genotype: y w FRT19A |