Semi-automated Imaging of Tissue-specific Fluorescence in Zebrafish Embryos
Summary
Described here is a protocol for semi-automated imaging of tissue-specific fluorescence in zebrafish embryos.
Abstract
Zebrafish embryos are a powerful tool for large-scale screening of small molecules. Transgenic zebrafish that express fluorescent reporter proteins are frequently used to identify chemicals that modulate gene expression. Chemical screens that assay fluorescence in live zebrafish often rely on expensive, specialized equipment for high content screening. We describe a procedure using a standard epifluorescence microscope with a motorized stage to automatically image zebrafish embryos and detect tissue-specific fluorescence. Using transgenic zebrafish that report estrogen receptor activity via expression of GFP, we developed a semi-automated procedure to screen for estrogen receptor ligands that activate the reporter in a tissue-specific manner. In this video we describe procedures for arraying zebrafish embryos at 24-48 hours post fertilization (hpf) in a 96-well plate and adding small molecules that bind estrogen receptors. At 72-96 hpf, images of each well from the entire plate are automatically collected and manually inspected for tissue-specific fluorescence. This protocol demonstrates the ability to detect estrogens that activate receptors in heart valves but not in liver.
Introduction
Transgenic zebrafish have been developed that allow for the direct visualization of activity in signaling pathways, such as fibroblast growth factors1, retinoic acid2 and estrogens3, in live embryos. Such tools enable screening for chemicals that perturb signaling pathways (assayed as change in fluorescence intensity) or for chemicals that modulate signaling in a tissue-specific manner (change in fluorescence localization)4. Automated image capture increases the throughput of chemical screens dramatically5,6. Screens that automatically assay fluorescence in live zebrafish often rely on expensive, specialized equipment. So-called high-content screening provides the benefit of high resolution, quantitative imaging but at the cost of using specialized plate readers equipped for confocal microscopy7,8. The goal of this method is to automatically assay tissue-specific fluorescence in zebrafish embryos in a 96-well plate using a standard epifluorescence microscope. Tissue-specific fluorescence can be distinguished using this technique and may be a reasonable approach for laboratories that lack access to specialized plate readers or high-content screening equipment.
In this protocol, we use automated imaging to detect tissue-specific estrogen receptor (ER) agonists in live zebrafish at 3 days post fertilization (dpf). The transgenic line Tg(5xERE:GFP)c262/c262 contains 5 tandem estrogen response element DNA sequences (ERE) upstream of green fluorescent protein (GFP)3. In the absence of ligand, ERs are normally inactive. Ligand binding triggers a conformational change, allowing receptors to bind ERE DNA and regulate transcription9. 5xERE:GFP fish can be used to screen chemical libraries for ER modulators and can be used to screen environmental water samples for estrogenic contaminants.
Protocol
NOTE: This protocol was approved by the University of Alabama at Birmingham Institutional Animal Care and Use Committee.
1. Zebrafish Breeding and Egg Collections
- Three days before beginning chemical exposures, assemble breeding tanks with dividers to separate males and females. Fill each tank halfway with aquaculture system water. Using a net, transfer Tg(5xERE:GFP)c262/c262 fish to breeding tanks, placing 2 males and 3 females in each tank separated by a divider. Place a lid on each tank and label with date and strains to be crossed.
- The following morning, remove all barriers and tilt baffles to create a shallow area at one end of the breeding tank. Allow zebrafish to mate, collecting embryos at 10 min intervals to ensure precise developmental staging. Clean eggs by rinsing through a tea strainer using E3B medium and gently flush embryos into Petri dishes. Return adult fish to permanent tanks.
- Using a dissecting microscope, sort, count, and remove any unfertilized, abnormal or damaged embryos. Place embryos in Petri dishes in E3B medium and house at 28.5 °C with a 14:10 light:dark cycle. Embryo density can affect development. Place no more than 100 embryos in a 100 x 35 mm dish and no more than 50 embryos in a 60 x 15 mm dish.
- By 24 hpf, replace media with E3B containing 200 μM 1-phenyl 2-thiourea (PTU). PTU prevents pigment formation and keeps zebrafish embryos and larvae transparent for improved image clarity. CAUTION: concentrated PTU stock is hazardous; wear gloves when making E3B+PTU solution.
- At 1 day post fertilization (dpf), manually remove the chorion from each embryo using fine forceps. The chorion does not appear to affect penetration of estrogens, however removal enhances image clarity. There is no need to remove chorions from the media. NOTE: As an alternative to manual dechorionation, batches of embryos can be chemically dechorionated using 1 mg/ml pronase treatment, as previously described11.
2. Chemical Treatment of Embryos
- The day before treatment, prepare stock solutions of each chemical at 1,000-fold concentration in DMSO (or appropriate solvent). For example, to expose embryos to 10 μM bisphenol A (BPA), prepare a 10 mM BPA stock solution in 100% DMSO. This ensures uniform DMSO concentration in each treatment and allows a non-toxic 1:1,000 dilution of DMSO to serve as a vehicle control. Store stock solutions at -20 °C. For this protocol, embryos will be exposed to 1 μM and 10 μM BPA, 18.5 nM and 1.85 μM genistein, 367 nM estradiol (positive control) and vehicle (0.1% DMSO, negative control).
CAUTION: Chemicals such as BPA and estradiol are hazardous and can have deleterious effects on the human fetus. Handle endocrine disruptors with care and always use proper personal protective equipment. - On the day of treatment, thaw prepared stock chemical solutions. Dilute 1:1,000 by pipetting 1 ml E3B + PTU into a 1.5 ml microcentrifuge tube and adding 1 μl of stock chemical solution. Vortex vigorously. Dilute DMSO 1:1,000 into E3B + PTU as a vehicle control. Use 1 mL E3B + PTU in a 1.5 ml microcentrifuge tube as an untreated control.
- Using a large bore plastic transfer pipette, transfer embryos from Petri dishes into each well of a 96-well plate, 3 embryos per well, 3 wells per condition. To prevent evaporation during prolonged treatment, omit embryos from outer rows and columns of the plate (rows A and E, columns 1 and 12). Outer wells can be filled with 300 μl of E3B + PTU. Label the plate lid appropriately.
- Remove media from each well with a fine tipped plastic transfer pipette. Work quickly to avoid drying out the embryos.
- Add 200 μl of treatment solution into corresponding well. Place the lid underneath the plate as a guide to ensure addition of treatments into the proper wells. Vortex each tube prior to pipetting to distribute the chemical in solution. Visually confirm each embryo is in the treatment solution. If embryos are on the side of the well, use a clean transfer pipet to wash them into the well with the treatment solution.
- Place the plate in the incubator at 28.5 °C. Embryos will be analyzed for fluorescence at 72 hpf.
3. Automated Imaging of Embryos in 96-well Plates
- Anesthetize embryos by adding 10 μl of 4 mg/ml tricaine to each well.
NOTE: Anesthetize embryos prior to imaging. At 24-96 hpf, zebrafish exhibit spontaneous movement and a startle response to the changing light source during image capture. Anesthetizing embryos reduces movement during imaging. - Place the 96-well plate in the motorized stage and calibrate the stage. Using Zeiss Zen Blue 2011 software for microscopy automation and control, select the sample carrier option and select multiwell 96. Select calibrate. Follow the stepwise directions to calibrate the stage.
NOTE: Do not uncheck the tiles button after this step. If the tiles button is unchecked, calibration settings may be lost and the 96-well plate will need to be recalibrated. - Using a 10x objective and the brightfield (BF) setting, identify a positive control embryo and set exposure settings appropriately for BF and GFP channels, making sure that fluorescence signal is not saturating the camera. Focus on a single embryo and program the microscope to acquire 3 total Z-sections, one image 50 μm above and one 50 μm below the current focal plane.
NOTE: Because different tissues occupy different focal planes, this will ensure that for each zebrafish images are captured with the heart and liver in focus. - Set the software parameters to acquire a tiled image using GFP and BF channels. Under the acquisition tab, select advanced setup. Select tile regions, then tiles. Choose the circle well option.
NOTE: Tiling is used to create a composite image of each well. A single field-of-view captures only a small portion of each well. The tiling function can automatically capture multiple adjacent fields-of-view from each well, creating a composite image of the entire well. It is therefore possible to automatically capture 96 composite images per plate, where each composite image contains several dozen individual images from a single well. - Select carrier and fill factor 90%. Selecting a fill factor of 90% will capture multiple images of the selected wells such that 90% of the area of each well will be visible in the composite image.
NOTE: When selecting fill factor, a diagram will be displayed representing the area to be imaged. Select a percentage that will include the area of the well that is appropriate for the experiment. - Under options, select the amount of overlap desired.
NOTE: When stitching together tiles for a single representative image, an overlap of 5-10% allows for a smooth seam between images. However, if image stitching is unnecessary, using a 0% overlap will reduce imaging time. Using 90% fill factor and 5% overlap, a composite image of a single well consists of 59 individual images. - Start imaging. The microscope will automatically acquire images.
- Manually inspect composite images of each well for tissue-specific fluorescence (Figure 1).
- NOTE: It is best to start with the positive control to confirm that the chemical exposure worked prior to observing experimental treatment wells.
4. Manual Image Capture of Embryos in 96-well Plate
NOTE: To confirm results, use a 20x long working distance objective to acquire more detailed images manually (Figure 2).
- Using a 20x objective and the brightfield (BF) setting, identify a positive control embryo and set exposure settings for BF and GFP channels appropriately, making sure that fluorescence signal is not saturating the camera.
- Identify individual embryos and capture images manually.
NOTE: Once the exposure settings have been selected for the positive control embryo, do not alter the settings. This allows a comparison of the fluorescence intensity as each image is captured under uniform conditions.
Representative Results
Figure 1 shows composite images from individual wells of a 96-well plate. Each composite image is composed of 59 individual images with 5% image overlap. Note that the live zebrafish are oriented randomly within each well, yet we are able to distinguish fluorescence in the heart from the liver. Brightfield images are useful as references to assess zebrafish orientation and visualize morphological abnormalities (Figures 1A and 1C). Automated imaging using a 10x objective is used to screen chemicals and determine which warrant manual evaluation at a higher magnification. Figure 2 shows images captured with a 20x long working distance objective for more detailed analysis. These images were taken directly after the automated scan depicted in Figure 1 without removing the plate from the microscope stage. Using a 20x objective, the fluorescence in the heart can be precisely localized to heart valves (Figures 2C-2F). Occasionally, the orientation of the embryos may be sub-optimal for capturing images and can lead to ambiguous results. Placing 3 zebrafish per well and performing each treatment in triplicate (protocol step 2.3) provides multiple opportunities to visualize fluorescence accurately.
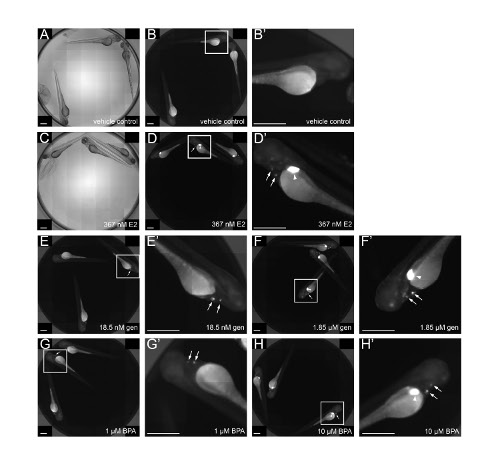
Figure 1. Automated composite imaging reveals tissue-specific fluorescence in heart valves and liver. Brightfield (A, C) and fluorescent (B, D-H) images of Tg(5xERE:GFP)c262/c262 embryos treated with indicated chemicals at 2 days post fertilization (dpf) and imaged at 3 dpf. Each panel shows a composite image of a single well (composed of 59 individual images with 5% overlap) from a 96-well plate. A and B, Embryos incubated in 0.1 % DMSO (vehicle control) are GFP-negative. C-H, Embryos incubated with 100 ng/ml 17β-estradiol (E2), 1.85 μM genistein (gen), or 10 μM BPA exhibit fluorescence in the heart valves (arrows) and liver (arrowheads), embryos treated with 18.5 nM gen or 1 μM BPA exhibit fluorescence in heart valves but not liver. B’, digitally magnified image of a single larva from the boxed region in panel B. D’, digitally magnified image from boxed region of panel D, and so on. Scale bar = 500 μm. Please click here to view a larger version of this figure.
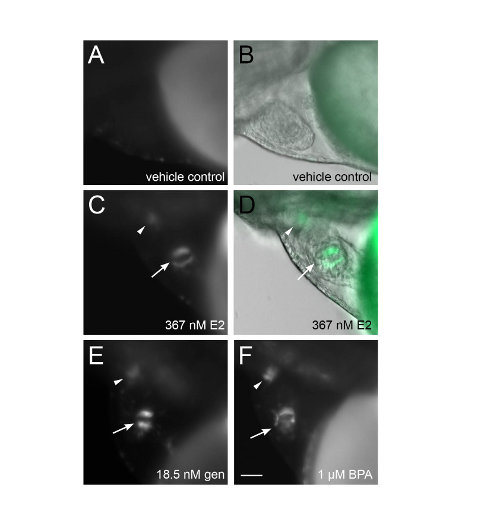
Figure 2. Detailed visualization of GFP-positive heart valves. Tg(5xERE:GFP)c262/c262 embryos exposed to indicated chemicals in 96-well plate (see Figure 1) were imaged manually at higher magnification, allowing visualization of GFP in the atrioventricular valves (arrows) and the aortic valves (arrowheads) of the heart. B, D fluorescence and brightfield images merged. All images are lateral view, anterior to the left, dorsal to the top. Scale bar = 50 μm. Please click here to view a larger version of this figure.
Discussion
This protocol describes a straightforward method to automatically image tissue-specific fluorescence in zebrafish embryos. The protocol was developed using a Zeiss Axio Observer. Z1 with Zen Blue 2011 software, however the technique can be adapted using any inverted microscope with a motorized stage and microscope control software that can perform tiling to create composite images. Equipping an inverted microscope with a motorized stage can provide a practical, less expensive alternative to purchasing specialized equipment for high-content screening. Motorized stages range from several thousand to tens of thousands of US dollars, depending on the make and model of the microscope and quality of the stage.
There are several critical steps within the protocol. Some chemicals are light sensitive, thus it may be beneficial to incubate embryos in the dark during treatment. Zebrafish embryos are sensitive to desiccation. Therefore, for chemical exposures lasting more than one day it is critical to fill the wells along the edges of the 96-well plate with media to limit evaporation (protocol step 2.3).
It is also important to ensure that the stage is carefully calibrated (protocol step 3.2). One common mistake is to place the plate onto the stage without securing the plate completely. In this case, the plate’s position on the stage can change when the stage moves, which could cause some wells to be imaged partially or not at all. When imaging several plates in succession, it is not absolutely necessary to recalibrate the stage for each plate, as long as the plates are from the same manufacturer and are all placed in the stage in identical orientations.
When setting the automated image tiling parameters (protocol step 3.5), ensure that a majority of each well will be imaged. At 3 dpf and older, zebrafish larvae tend to position themselves near the edges of the well, therefore a 90% fill factor is recommended to ensure that edges of each well will be visualized. However, the greater the fill factor the longer the time for image acquisition.
It is possible to perform a stitching algorithm on composite images to improve resolution. If a stitching algorithm is to be performed, then set tiling parameters to include a 5-10% image overlap (protocol step 3.6). The higher the overlap, the better the performance of the stitching algorithm. In some cases, a 10% overlap may allow stitching to produce an informative image for analysis that does not require further visualization using a higher magnification objective. However, the greater the overlap the longer image acquisition will take, as more images will be captured per well. An overlap of 0% may be used to reduce image acquisition time and to minimize fluorescent light exposure and photobleaching. In this case, capture more detailed images of select wells using a 20x objective (Figure 2).
Image capture time for this protocol will depend on the experiment parameters. Image acquisition using the parameters in this protocol (90% fill factor, 5% overlap, three z-sections per captured image and an exposure time of 50 msec for the GFP channel and 1 msec for the brightfield channel) takes three minutes and fifty seconds per well. Therefore, it is possible to screen 60 wells in three hours and fifty minutes. It is feasible to screen 180 wells per day, or 60 unique compounds in triplicate.
This protocol allows automated imaging for tissue specific fluorescence but has several limitations. Widefield fluorescence imaging lacks the resolution of confocal imaging used in many high-content screening techniques. Additionally, fluorescence quantitation is difficult due to the high variability in the orientation of each zebrafish within a well. This could be avoided by imaging zebrafish under uniform orientation conditions, for example by using molds or microplates with wells that force zebrafish embryos into uniform orientations5,10. The image acquisition time limits the number of wells that can be screened per day to 180. Screening 180 wells per day is a significant improvement over manual imaging. However, typical high throughput methods can screen an average of 10,000 wells per day but require complex and expensive workstations.
This protocol represents a practical, less expensive alternative to high-content screening that can be readily adapted by laboratories with an inverted widefield fluorescence microscope. The imaging method described here allows for the analysis of tissue-specific fluorescence in embryos that have not been carefully mounted or oriented, which drastically improves the speed and ease of sample preparation. Composite images can be archived for reference. This protocol was developed to allow high-throughput screening of tissue-specific estrogen receptor ligands from chemical libraries and environmental water samples. Alternatively, this imaging protocol could be used to screen any fluorescent reporter for tissue-specific activity.
Divulgations
The authors have nothing to disclose.
Acknowledgements
We thank Susan Farmer and the staff of the UAB zebrafish research facility for zebrafish care. Funding provided by start-up funds from the Department of Pharmacology and Toxicology.
Materials
| Name of Material/ Equipment | Company | Catalog Number | Comments/Description |
| Plastic transfer pipettes; wide bore | Fisher | 13-711-23 | |
| Plastic transfer pipettes; fine tip | Fisher | 13-711-26 | |
| 96-well, round, flat bottom plates | Fisher | 21-377-203 | |
| 100 x 35mm paltes | Fisher | 08-757-100D | |
| 35 x 60mm plates | Fisher | 08-757-100B | |
| Dumont #5 fine forceps | Fine Science Tools | 11254-20 | tip dimensions 0.05 x 0.01 mm, for manually removing chorions from embryos |
| Tricane methanesulfonate | Sigma Aldrich | A5040-25G | see Zebrafish Book for recipe (http://zfin.org/zf_info/zfbook/chapt10.html#wptohtml63) |
| 1-phenyl 2-thiourea (PTU) | Sigma Aldrich | P7629-10G | Prepare 20 mM stock (100x) and use at 200 μM in E3B |
| Zeiss Axio Observer Z1 | Carl Zeiss | Protocol requires an inverted fluorescence microscope with a motorized stage | |
| 20x long working distance objective | Carl Zeiss | We use an objective with 0.4 NA and 8.4 mm working distance | |
| Axiocam HRm digital camera | Carl Zeiss | ||
| ZenBlue 2011 microscope control software | Carl Zeiss | Protocol requires microscopy automation and control software to enable capturing of tiled images using a motorized stage | |
| Methylene Blue | Sigma Aldrich | MB-1; 25 grams | make 2% solution in RO water for use in E3B (below) |
| E3B | 60X E3 SOLUTION: NaCl – 17.2 grams KCl – 0.76 grams CaCl2-2H2O – 2.9 grams MgSO4-7H2O – 4.9 grams or MgSO4 – 2.39 grams Dissolve in 1 liter Milli-Q water; store in sterile 1 liter bottle. 1X E3B SOLUTION FOR ZEBRAFISH: 60X E3 150mls 2% methylene blue 100μl Bring to 9 liters with Milli-Q water |
References
- Molina, G., Watkins, S., Tsang, M. Generation of FGF reporter transgenic zebrafish and their utility in chemical screens. BMC Developmental Biology. 7, 62 (2007).
- Perz-Edwards, A., Hardison, N. L., Linney, E. Retinoic acid-mediated gene expression in transgenic reporter zebrafish. Biologie du développement. , 89-101 (2001).
- Gorelick, D. A., Halpern, M. E. Visualization of Estrogen Receptor Transcriptional Activation in Zebrafish. Endocrinology. 152, 2690-2703 (2011).
- Tsang, M. Zebrafish: A tool for chemical screens. Birth Defects Research Part C: Embryo Today: Reviews. 90, 185-192 (2010).
- Peravali, R., et al. Automated feature detection and imaging for high-resolution screening of zebrafish embryos. Biotechniques. 50, 319-324 (2011).
- Walker, S. L., et al. Automated reporter quantification in vivo: high-throughput screening method for reporter-based assays in zebrafish. PLoS One. 7, (2012).
- Vogt, A., et al. Automated image-based phenotypic analysis in zebrafish embryos. Developmental Dynamics. 238, 656-663 (2009).
- Vogt, A., Codore, H., Day, B. W., Hukriede, N. A., Tsang, M. Development of automated imaging and analysis for zebrafish chemical screens. J. Vis. Exp. , (2010).
- Gruber, C. J., Gruber, D. M., Gruber, I. M., Wieser, F., Huber, J. C. Anatomy of the estrogen response element. Trends in Endocrinology and Metabolism. 15, 73-78 (2004).
- Rovira, M., et al. Chemical screen identifies FDA-approved drugs and target pathways that induce precocious pancreatic endocrine differentiation. Proceedings of the National Academy of Sciences USA. 108, 19264-19269 (2011).
- Westerfield, M. The Zebrafish Book: A guide for the laboratory use of zebrafish (Danio rerio). , (2000).
