Ethics Statement: The following procedure involving animal subjects were done in accordance with the National Institutes of Health guidelines and were approved by the Dana-Farber Cancer Institutional Animal Care and Use Committee. All human subjects work was reviewed by the Institutional Review Board Committees of the Brigham and Women's Hospital and Dana-Farber Cancer Institute, and by Stanford University for appropriate use, that informed consent was obtained from all subjects when required, and appropriate waiver of consent requirements was obtained for minimal risk studies.
Timeline of Slice Culture Protocol:
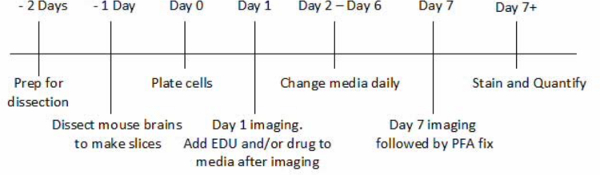
Figure 1. Timeline of Brain Tumor/ Organotypic Slice Co-culture Protocol. This figure depicts the timeline of the slice culture procedure encompassing all eight days of the experiment and major steps of the procedure. The timeline is relative to Day 0 when the cells are plated onto the slice in order to highlight the importance of beginning the procedure days before plating cells. Please click here to view a larger version of this figure.
1. Dissection Buffer
- Prepare 15 mM HEPES (1 M), 6.5mg/ ml glucose, 1.3 mM MgSO4 (1 M), 20 mM KCl (2 M) and 1% penicillin/streptomycin in 1x HBSS.
- Adjust pH to 7.4 with NaOH.
- Filter and store at -20 °C.
2. Slice Culture Media
- Prepare 2% B-27, 1% N2 supplement, 1% penicillin/streptomycin, 1% Glutamax, and 1.5 mg/ml Glucose in Neurobasal-A Medium minus phenol Red.
- Filter and store at -20 °C. Thaw as needed, and discard after 1 week at 4 °C.
Note: The following procedure can be done up to one day before starting the dissection. - 3% low melting point agarose
Note: The following procedure can be done up to one day before starting the dissection. - Mix 0.9 g low melting point agarose into ~31 ml of dissection buffer, microwave for 25 sec with cap loose. Microwave until melted and make sure the mixture doesn’t overflow.
- Keep at 55-65 °C until needed.
Note: The following procedure can be done up to one day before starting the dissection.
4. Coat the Slice Culture Inserts with Laminin
Note: The following procedure can be done up to one day before starting the dissection.
- In a tissue culture hood, using sterile forceps, place one slice culture insert in each well of a 6-well plate (match the number of slices you intend to obtain, around 12 can be collected from one procedure. The following procedure is written for six slices). Fill a 15 ml conical tube with 1x PBS (800 µl/insert) and add laminin (10 µg/ml).
- Add 800 µl of the laminin mixture to the top of each slice culture insert. Incubate at 37 °C until needed.
5. Preparation for Dissection
- Fill each well of a 6-well plate with 1,200 µl of slice culture media. Fill any unused wells with 1,200 µl PBS and fill the center space of the plate with 5 ml 1x PBS. Store this plate at 37 °C.
- Sterilize dissection tools in 70% ethanol. Wipe vibratome blade with acetone to remove oil and sterilize before use.
- Place three 35 mm2 dishes and five 10 cm2 tissue culture dishes in the hood. Fill one 10 cm2 dish with dissection buffer and place on ice.
Note: Process pups one at a time.
6. Dissection
Note: Process pups one at a time.
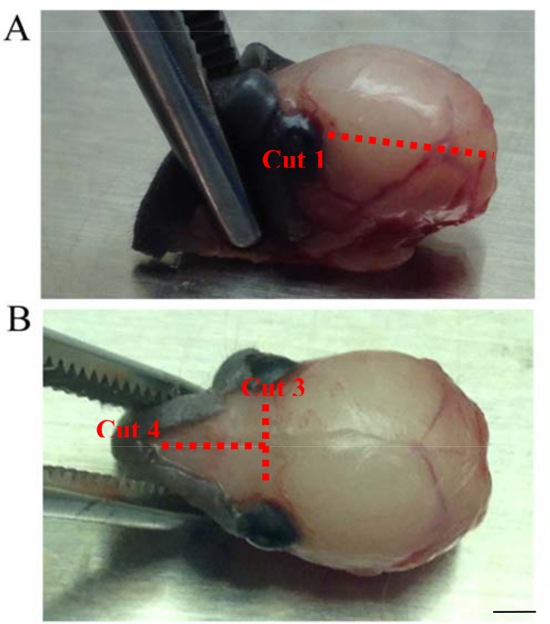
Figure 2. Dissection Cuts. These images show the necessary dissection cuts to remove the skull from the brain of a P6 mouse. Cuts are shown as dotted lines. (A) Cut 1 is shown. Cuts 1 and 2 are made from the brainstem/posterior bilaterally connecting to the eye socket on each side.. (B) Cuts 3 and 4 are shown. Cut 3 is made from one eye socket to the other connecting Cuts 1 and 2. Cut 4 begins at the midline of cut 3 and continues towards the tip of the nose dividing the skull between the olfactory bulbs (Scale bar = 4.4 mm). Please click here to view a larger version of this figure.
- Anesthetize the P6 mouse using isoflurane exposure (100% isoflurane). After approximately 5 min when breathing is slowed or there is no sign of respiration, quickly decapitate the mouse with sharp scissors. Spray the head with 70% ethanol and place in a tissue culture dish.
- Using large blunt forceps hold head steady by grabbing the nose. Using medium sized dissection scissors, remove excess skin to reveal skull.
- Make cuts 1 and 2 by cutting the skull bilaterally, from posterior of the skull towards the front on each side, connecting the cut to the eye socket. Keep the tip of the scissors as close to the skull as possible to avoid tissue damage.
- For cut 3, use small spring scissors to connect cuts 1 and 2. Then use the small blunt forceps to gently peel off the skull.
- Using the small spring scissors, gently cut the remaining skull along the midline on top, such that the remaining skull becomes 2 halves (Figure 2, cut #4). Using forceps peel off the skull to reveal the two olfactory bulbs.
- Insert a flat-faced spatula (moistened with dissection buffer, so tissue won’t stick to it) in between bottom of the brain and base of skull, gently remove the brain and place into the dish containing dissection buffer on ice.
- Repeat step 6 to obtain a second brain for slicing
7. Embedding the Brains in Agarose
- Place two of the 35 mm2 dishes open on the ice and wipe down a pair of large blunt forceps with 70% ethanol.
- Pour 3% low-melting point agarose (prepared in step 3) into the two dishes until a dome forms on top. Set timer for 3 min. At 3 mins (test by touching the rim of the agarose-filled dome, if polymerization of agarose can be observed, it’s ready) pick up one brain with blunt forceps and place into the side of an agarose-filled 35 mm dish, then move it to the center of the dish (this removes excess dissection buffer around the brain so it mounts better).
- Repeat for the 2nd brain. Start a timer for 10 min.
- After 10 min, insert a flat spatula into the space between agarose and dish to pop out the polymerized agarose containing the P6 brains.
- Use a flat razor blade to trim the agarose into a cube around the brain, making sure that the edges are as straight as possible.
- Place superglue on the vibratome plate in two strips. Then, pick up the agarose mounted brain and gently drop it down over the glue, positioned for sagittal slices. Do the same for the other brain. Make sure both brains are lined up with one another.
- Let the glue dry at RT for 5-8 min. During this time, fill the ice holder area of the vibratome with crushed ice and water.
8. Slicing with the Vibratome
- Place the cutting reservoir into the ice holder area, moving the tab to the right to lock it into place.
- Using the circular head screw driver, pick up the circular vibratome plate with the brains glued on it, and fit it into the reservoir. Remove the screw driver and secure the plate in place with the hexagonal head screw driver. Make sure the plate and the cutting reservoir are firmly in place.
- Using forceps, pickup the vibratome blade, fit it into the cutting head, lock in place with hexagonal screw driver. Then, secure the cutting head with the attached blade onto the vibratome using the round screw.
- Bring up the position of the razor to as close to the agarose-embedded brains as possible, while making sure the razor is at the same height (or just above) the brains. Fill chamber with enough cold dissecting buffer to cover the blade.
- Press ↕ button once (you should see it blink, this button defines the boundaries when the blade will go back and forth), then press and hold “Forward” to manually cut the embedded brain, release until the razor clears the agarose block. Immediately press ↕ button again, this will define the end of the range for automatic cutting.
- Press the “SINGLE/CONT” button once and the light by CONT should go on. Set the cutting thickness to 400-450 µm, vibrating frequency to 5.5-6, and speed to 4. This will be the trimming setting.
- Press the “start/stop” button once, and automatic cutting should begin. Press “pause” to collect tissue using the spoon with holes, as needed. It should take about 5-10 min, to reach closer to midline. At this point, press “pause” and change the speed to 3 and change the thickness to 200 µm. Do not collect the first slice produced after making this change.
- The desired slices of 200 µm thickness will have the olfactory bulb through the cerebellum nicely defined. Transfer each desired slice as they are cut into 6-well plates filled with dissection buffer on ice. Do this by moving the buffer in the slicing chamber around the tissue to float the slice, touching it as little as possible, lift it out of the buffer when it is squarely over the slotted spoon. Typically around 12 slices with the desired structures can be collected. The slices can be left in dissecting buffer on ice for up to 20 min.
- While slices are on ice, take out 6-well plate with inserts being coated with laminin from 37 °C incubator. In the dissection hood discard the laminin taking care not to damage the inserts. Add 3.5 ml of slice culture media to the top of each insert. The top of the media will form a dome-shape without spilling out into the wells.
9. Plating the Slices onto the Inserts
- Using the slotted spoon tool, place a brain slice into the media on the insert, gently pushing the slice to be fully submerged. Repeat for all slices.
- Use a p1000 to draw out 1 ml of slice culture media from the top of the insert and dispense it into the bottom of the well. Remove and discard the excess media until the edges of the agarose around the brain slicebecome visible. Do this for the remaining slices.
- Pick up the insert by the rim with forceps, tilt and remove excess media. Then, quickly transfer the insert into 35 mm2 dish containing 1 ml of slice culture media. Use 2 pairs of sharp forceps to remove the agarose around the tissue, taking care not to stretch/damage slice or poke a hole in the membrane (easiest if you make a tear at the very edge of the agarose, then pull apart the agarose from either side). Then move the insert back to the 6-well plate and repeat for the remaining slices.
- In a tissue culture hood with the blower off (to prevent slices from drying out) remove agarose fragments from each membrane.
- Transfer the slices to the 6-well plate prepared in step 5.1 and store the plate at 37 °C. Incubate slices for 24-48 hr.
10. Changing the Slice Culture Media
- Repeat step 5.1 with a fresh 6-well plate.
- In a tissue culture hood with the blower off, transfer the inserts to new 6-well plates containing fresh slice media.
11. Plating Tumor Cells on the Slice
- Sonicate the Cm-DiI dye and spin on medium speed for 2 min.
- Spin down tumor cells being used for the overlay at 201 x g for 5 min. Then resuspend in 2 ml of slice culture media.
- Add 7 µl of Cm-DiI into the 2 ml of cells and media and incubate at 37 °C for 20 min.
- Spin down cells at 201 x g for 5min and resuspend in 200 µl of slicing media. Triturate gently to dissociate the cells (10-20 times or until pellet is gone) and then add 800 µl slicing media to make 1,000 µl total volume.
- Count viable tumor cells using Trypan blue. Add green fluorescent microspheres to tumor cells, at the same concentration as cells. These inert microspheres will serve as a control. Spin down the cell/microsphere mixture at 201 x g for 5 min and resuspend in desired amount of slice culture media. Plate cells at a density of 6,000 cells/slice in 65 µl volume. The number of cells plated per slice can be increased depending on preference and availability.
- In the tissue culture hood dispense cells in 65 µl of media/slice onto the center of the slice.
12. Imaging and Fixing
Note: a Nikon Eclipse Ni C2si upright confocal was used to take a large image scan of the whole sagittal slice at 4X with red and green fluorescent channels. If scanning feature is not available, take multiple images sequentially across the slice and later stitch the images together in Photoshop (using the location of microspheres and the edge of the slice to navigate).
- The next day (Day 1 imaging), transfer slices into six 35 mm2 dishes with 1 ml slice culture media. Image each slice one at a time on the fluorescent upright microscope. Take a large image scan of the whole sagittal slice at 4X with red and green fluorescent channels. Keep laser and gain settings the same for each slice. At the end of imaging, transfer all slices back to a 6-well plate containing fresh slice media.
- If addition of EDU, other proliferation marker or drug condition is desired, create a stock of slice media with the drug that will be used for the media changes daily for the treatment condition. The treatment condition should be introduced at step 12.1 (directly after Day 1 imaging). Any EDU or proliferation marker should be added to the media also beginning at 12.1 and refreshed daily (use EDU at 10 µM).
- Image again on Day 7 using the same settings as the Day 1 images.
- After Day 7 imaging is complete, move each slice into a 6-well plate with each well containing 1.2 ml of 4% Paraformaldehyde (PFA). Carefully and slowly drop an additional 1 ml of PFA on top of each slice. Leave at RT for 1 hr.
- Remove PFA from each well and from the top of each slice. Wash each well 3x with PBS. Store the slices in PBS at 4 °C for staining or mounting on slides.
Note: ImageJ settings may need to be adjusted and optimized to account for image and microscope quality as well as tumor cell size.
13. Quantification of Images (Using ImageJ)
Note: ImageJ settings may need to be adjusted and optimized to account for image and microscope quality as well as tumor cell size.
- In ImageJ, use the polygon tool to outline the whole slice or the region that you want to quantify. Add this selection to the ROI manager where you can rename it and save it.
- Right click on the selected area and choose duplicate. Name this duplicate image with the region, slice, day. Press Ctl+Shift+E to show the outline, then select Process – subtract background – Rolling ball Radius = 4.
- After background subtraction, select “adjust threshold” in the “Image” dropdown menu. Check dark background – look at image zoomed in and set the threshold. As you set the threshold by moving the threshold bar, ensure all cells are included/highlighted but extremely small dots that are debris (or smaller than a cell) are not included. Use the same threshold for all images. Move the threshold window to the side.
- Select “Process” – “Find Maxima” and set the noise tolerance between 5 and 10 and check the following: Preview point selection, output type as segmented particles, exclude edge maxima, above lower threshold. Then reselect the region of interest by pressing Ctl+Shift+E.
- Select “Analyze Particles” from the Analyze drop down menu. Set the pixel size to 4-40 and the circularity to 0.00-1.00. Also click “show overlay outlines” “display results” and “summarize”, then press OK.
- Record all raw data and the summary in a Microsoft office document. The “Count” for each region is needed to calculate fold change over the week in culture.
- Repeat this process for all images and areas of interest, making sure that the threshold and other settings remain consistent.
- Calculate the fold change in cell number on the slice during the week in culture by dividing the number of tumor cells on the slice on Day 7 by the number of cells on the slice on Day 1. Similarly, fold change in cell number within each region is calculated by dividing the number of cells in that region on Day 7 by the number of cells in that region on Day 1.
- Perform step 13.8 for microspheres as well. The microsphere number on the slice should be the same on Day 7 as on Day 1 (Fold change = 1). Similarly, microsphere number within each region should be the same on Day 7 as on Day 1 (Fold change =1). If Fold change differs from 1, this indicates changes in slice topography over time.
14. Staining
- Tape a piece of parafilm on the lab bench and draw six circles with a liquid blocker pap pen (one for each slice, just larger than the size of a slice). Place about 400 µl of PBS in a dot in the middle of each circle. Number or label the circles to identify each slice.
- In 1 ml of PBS, use a razor blade to cut a square around the slice, leaving some space of membrane around the slice. Using forceps move the cut out slice into the first circle and carefully lay the slice on top of the bubble of PBS. It is essential to make sure that the slice does not fold over on itself or get flipped upside down during this process. Then, remove the PBS from underneath the slice and put it on top of the slice and add more PBS if needed to make sure it remains submerged. Repeat this step for each slice.
- Make 10 ml of 3% BSA in PBS. Take out 2 ml, and add 100 µl of digitonin to it. Mix and add to slices to block and permeabilize, 30 min at RT.
Note: Use of other permeabilization agents such as Triton X-100 will result in loss of CM-DiI labeling. - Remove permeabilization/blocking solution and rinse 3x with PBS for 10 min.
- If staining for EDU, follow the directions provided by the kit to assemble the mixture. Apply the mixture for 45 min. If staining with other antibodies, the protocol must be optimized for the concentration of primary and secondary antibodies (~1 hr RT for primary and secondary). Rinse 3x with PBS for 10 min.
- Stain with DAPI 1:1,000 in PBS for 5 min RT. Rinse 2x with PBS.
15. Mounting the Slices
- Transfer the slice to a microscope slide. Make sure the side of the membrane with the slice remains facing up, and does not fold over on itself. Draw a border around the slice with a liquid blocker pap pen.
- Place a small glass coverslip (5 mm) on each side of the slice (to keep the slice from being damaged). Drop two or three drops of Fluoromount-G (for immunofluorescence) on top of the slice to just barely cover it. Then cover the slice long coverslip (24 x 50 mm).
- Repeat for each slice. Seal the edges of the slides with nail polish and store at 4 °C. Do confocal imaging of staining.
This section exemplifies the type of results to be expected from utilizing the brain tumor/organotypic slice co-culture to investigate regional microenvironment preference as well as to test new therapies. We show that the assay is designed to replicate the microenvironment for brain tumors, as the tissue organization and proliferative state of the slice is maintained (Figure 3). We also demonstrate that an increase in the number of tumor cells on the slice over time may partially be due to the migration of cells onto the brain slice microenvironment (Figure 4). We have also shown that this co-culture can be used as a quantitative assay by calculating the fold change in cell number over the week in culture for specific regions of the slice, or for the entire brain slice (Figure 6) Preliminary results from multiple tumor cell types have shown that the number of tumor cells can be quantified by confocal imaging of the 200 µm thick slice due to the fact that the cells only migrate to a depth of 20-50 µm into the slice.
We have found that green fluorescent microspheres are an effective control for changes in slice topography because they show no movement or change in number throughout the time in culture (Figure 5). After fixing the co-culture, staining can be done to examine tumor cells in a brain microenvironment and the effects of drugs on tumor cell proliferation, cell death, or changes in protein expression (Figure 7). We have demonstrated that this assay can be used to test drug therapies through a comparison of mouse medulloblastoma cells treated with a Smo (Smoothened) antagonist LDE225 (Sonidegib) or with a vehicle control. Fold increase in cell number on the slice over one week in culture was quantified and represented graphically (cell number on Day 7/cell number on Day 1) These data indicate that LDE225 greatly decreases tumor cell number in comparison to the control6. This effect can also be seen in the representative images included (Figure 8). We also show images of human medulloblastoma cells grown in the slice culture assay (Figure 9).
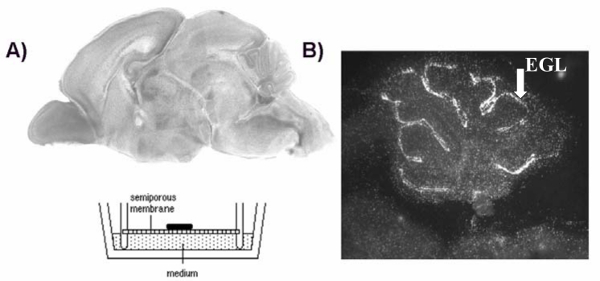
Figure 3. Brain Tumor/ Organotypic Slice Co-culture Assay Design. (A) Organotypic sagittal brain slice from a P6 mouse is placed directly on a semi-porous membrane and medium is added to the bottom of the culture dish. The culture is immersed in the medium on one side and is accessible to oxygen from the other side. Labeled tumor cells are overlaid onto the slice and cell number can be followed over time. (B) In culture, the slice maintains a tissue organization that closely resembles that observed in vivo. Preservation of the brain microenvironment is demonstrated by EdU labeling of proliferative granule neuron precursors in the external granule layer (EGL) of the cerebellum within the slice culture. In the slice culture, these precursor cells incorporate the thymidine analog EdU, as would be observed in vivo at this developmental stage (P6) (white arrow indicates EGL). Please click here to view a larger version of this figure.
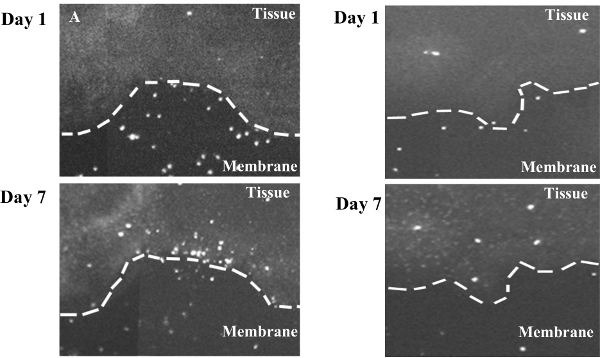
Figure 4. Human Astrocytoma Cells in Brain Tumor/ Organotypic Slice Co-culture Assay. An increase in human brain tumor cells on the slice may reflect relocalization of tumor cells from the membrane to the slice culture. (A) An area on the edge of a slice at Day 1 (top) and Day 7 (bottom) where cells may migrate from the membrane onto the brain slice. (B) A second example of possible cell migration onto the brain at the edge of the slice. Day 1 (top) and Day 7 (bottom). Please click here to view a larger version of this figure.
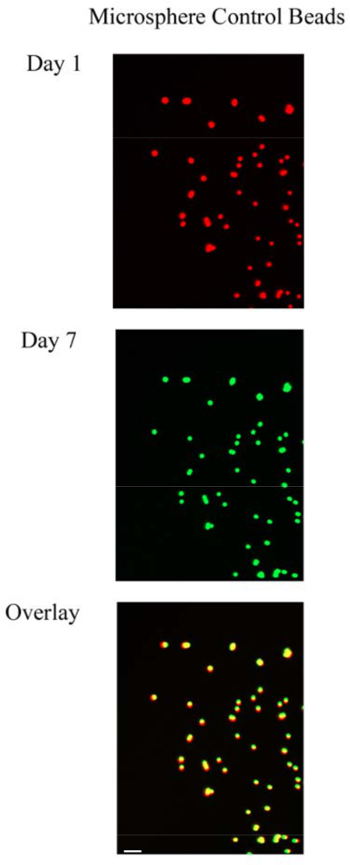
Figure 5. Microsphere Control Beads. Day 1 (red) and Day 7 (green) control images of fluorescent microspheres are overlaid (yellow) to reveal no movement of the microspheres over a week in culture. Day 1 and Day 7 images were taken at the same position within the slice (Scale bar = 45 µm). Please click here to view a larger version of this figure.
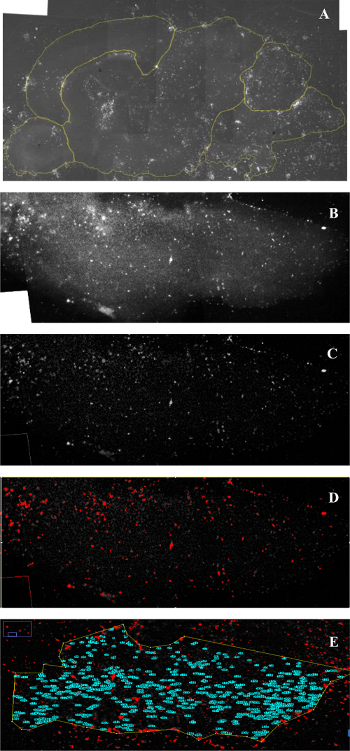
Figure 6. Quantification in ImageJ. (A) The image of a slice is opened in ImageJ and the whole slice and/or regions are outlined for quantification. (B) The region of interest is selected and a duplicate image is made. (C) The background fluorescence is subtracted out of the image. (D) The threshold is set for cell size and shape, determining what will be counted. (E) Analyze particles to count the cell number within the region of interest. Fold change in cell number can then be calculated by dividing the number of cells on Day 7 by the number of cells on Day 1 for each region of interest or the entire area of the slice. Please click here to view a larger version of this figure.
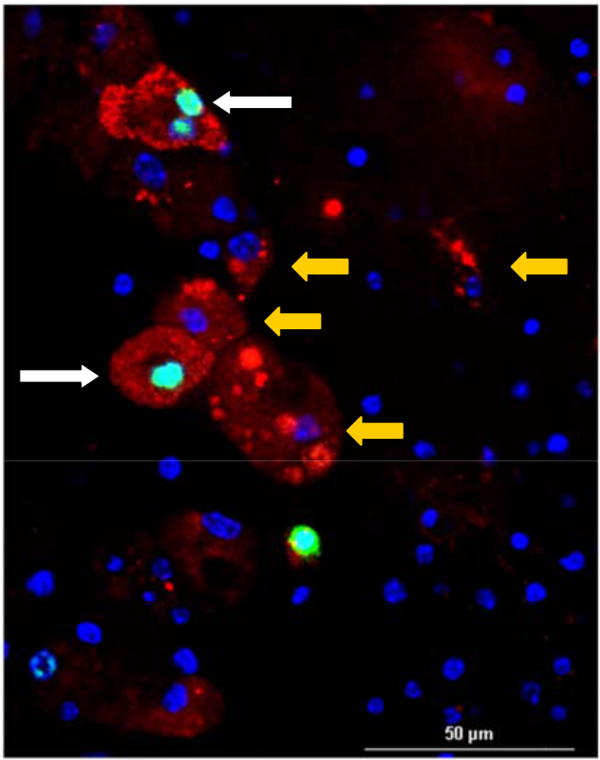
Figure 7. Staining for Proliferation. Image exemplifies how staining (after fixing the slice in PFA) can successfully be done on the slice after one week in culture. Image shows DAPInuclear staining (blue), red fluorescently labeled mouse medulloblastoma cells, and green labeling for incorporation of Thymidine analogue into DNA as a marker for proliferation. EDU was included in the slice culture media (10 µM) for one week (white arrows indicates cells positive for EDU and yellow arrows indicate cells negative for EDU) (Scale bar = 50 µm). Please click here to view a larger version of this figure.
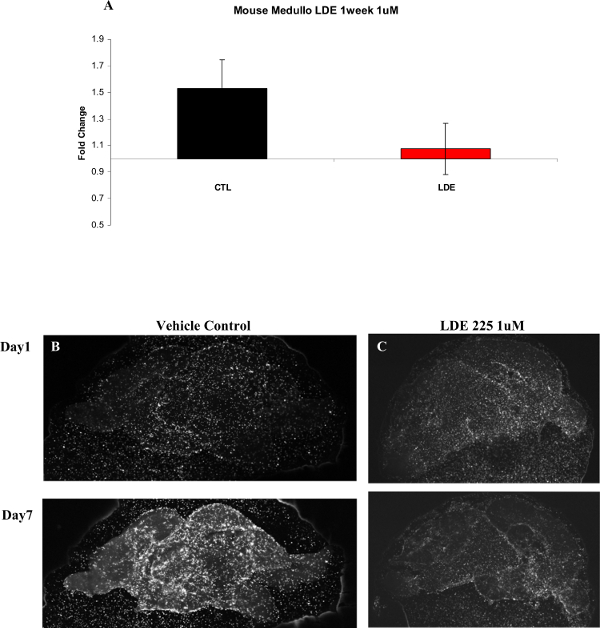
Figure 8. Mouse Medulloblastoma Cells Treated with LDE225. This figure demonstrates drug treatment of tumor cells in the slice overlay assay system. (A) Graphical representation of data collected from a mouse medulloblastoma experiment. DMSO was the control condition (CTL) and LDE225 (Sonidegib) (1 µM) (LDE) was the treatment condition. Fold increase in cell number on the slice over one week in culture was quantified (cell number on Day 7/cell number on Day 1), (n = 12 CTL, n = 13 LDE, Error bars = SEM). (B) Representative images of vehicle control treated slices on Day 1 (top) and Day 7 (bottom). (C) Representative images of LDE treated slices on Day 1 (top) and Day 7 (bottom). Images were taken at 4X magnification. Please click here to view a larger version of this figure.
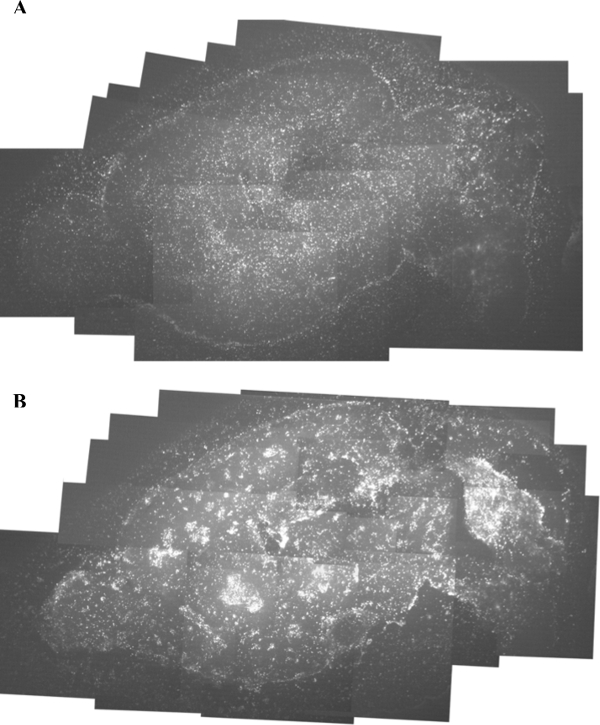
Figure 9. Human Medulloblastoma Cells in Brain Tumor/Organotypic Slice Co-culture. Human medulloblastoma cells were obtained from James M. Olson at the University of Washington, and were grown for one week in the slice culture assay. (A) Day 1 image of human medulloblastoma cells grown on the mouse brain slice. (B) An image of the same mouse brain slice with human medulloblastoma cells after one week in culture (Day 7). Images were taken at 4X magnification. Please click here to view a larger version of this figure.
