The goal of this protocol is to noninvasively assess cardiac structural and functional changes in a mouse model of heart disease created by transverse aortic constriction, using B- and M-mode echocardiography and color/pulse wave Doppler imaging.
Transverse aortic constriction (TAC) in mice has been used as a valuable model to study mechanisms of cardiac hypertrophy and heart failure1. A reliable noninvasive method is essential to assess real-time cardiac morphological and functional changes in animal models of heart disease. Transthoracic echocardiography represents an important tool for noninvasive assessment of cardiac structure and function2. Here we used a high-resolution ultrasound imaging system to monitor myocardial remodeling and heart failure progression over time in a mouse model of TAC. B-mode, M-mode, and Doppler imaging were used to precisely assess cardiac hypertrophy, ventricular dilatation, and functional deterioration in mice following TAC. Color and pulse wave (PW) Doppler imaging was used to noninvasively measure pressure gradient across the aortic constriction created by TAC and to assess transmitral blood flow in mice. Thus transthoracic echocardiographic imaging provides comprehensive noninvasive measurements of cardiac dimensions and function in mouse models of heart disease.
Mouse models of heart disease, such as TAC and myocardial infarction (MI), have been proven to be valuable to study disease mechanisms as well as to develop novel therapeutic strategies3. TAC initially induces compensatory hypertrophy, but prolonged pressure overload leads to cardiac dilatation and heart failure4. The tightness of the aortic constriction directly determines the degree of cardiac hypertrophy and its transition to heart failure. Noninvasive and reliable measurement of pressure gradient across the aortic constriction is essential for the success of these studies. Doppler imaging has been used to assess pressure gradient produced by TAC5, which is a noninvasive alternative for catheter-based pressure measurement.
Echocardiography has been widely used to noninvasively measure cardiac morphology as well as systolic and diastolic function in mice6-8. Two-dimensional B-mode imaging is used to detect abnormal movements or structural changes of the heart. One-dimensional M-mode imaging is used for quantification of cardiac dimensions and contractility. Color and PW Doppler imaging has recently been used on rodent ultrasound, which has broad applications for echocardiography, including measurement of flow directionality and velocity, as well as systolic and diastolic performance9.
Longitudinal real-time monitoring of cardiac function using echocardiography in B-mode, M-mode, color and PW Doppler mode provides comprehensive assessment of cardiac structure and function in mice under physiological and pathological conditions. Here we provide a detailed description of the use of echocardiographic imaging to monitor dynamic cardiac morphological and functional changes in mice following TAC or sham surgery.
The protocol follows the guidelines of the Institutional Animal Care and Use Committee of University of Washington.
1. Surgical Procedure and Preparation for Imaging
2. In the Aortic Arch View, Use B-mode and Doppler Imaging to Evaluate Transverse Aortic Constriction
3. In the Parasternal Long Axis View, Use B-mode and M-mode Imaging to Assess Cardiac Dimensions and Contractility
4. In the Parasternal Short Axis View, Use B-mode and M-mode Imaging to Assess Cardiac Morphology and Function
5. In the Apical Four-chamber View, Use Doppler Imaging to Assess Systolic and Diastolic Function
6. Post-procedural Treatment of Animal
Figure 1 shows B-mode images of the aortic arch view of mouse heart subjected to sham (Figure 1A) or TAC surgery (Figure 1B). The aortic arch, innominate artery, left common carotid artery, and left subclavian artery are shown. Note that aortic constriction is clearly visible in TAC but not sham heart. Color Doppler images from aortic view are shown in Figure 2A. The waveforms of aortic flow across the constriction site were captured by PW Doppler imaging (Figure 2B). Successful TAC will lead to a significantly increased flow velocity downstream the constriction site (typically ~4 m/sec in TAC mice). Pressure gradient across the constriction was calculated based on peak flow velocity, according to the modified Bernoulli's equation (Figure 2C).
Figure 3 shows B- and M-mode images of the parasternal long axis view of sham (Figure 3A) or TAC heart (Figure 3B). The upper panel shows the B-mode images of the left ventricle, the interventricular septum, and a portion of the right ventricle from sham or TAC mice. The lower panel shows the M-mode tracings of several cardiac cycles from sham or TAC mice. The measurements of cardiac dimensions are shown, including the left ventricular anterior wall thickness (LVAW), left ventricular internal diameter (LVID), left ventricular posterior wall thickness (LVPW) in diastole and systole. Note significantly increased wall thickness in mouse heart subjected to TAC compared with sham surgery.
Figure 4 shows images of the parasternal short axis view of sham (Figure 4A) or TAC heart (Figure 4B). The upper portion of each panel shows the M-mode axis (the dotted line) placed in the center of the left ventricle. The lower portion of each panel is the M-mode tracing with lines indicating cardiac dimensions as described above. As a marker of hypertrophy, ventricular and septal wall thickness can be accurately determined. Mice subjected to TAC showed increased wall thickness as assessed by LVAWd and LVPWd, ventricular dilatation as assessed by LVISd and LVISs, decreased contractility as assessed by LVFS and LVEF, and increased LV mass (Figure 5).
Figure 6 shows B-mode apical four-chamber view (Figure 6A,B) and PW Doppler images of transmitral flow patterns (Figure 6C,D). Measurements of peak E and A velocity, IVCT, IVRT, and ET are shown. The E/A ratio and MPI are calculated (Figure 6E – I). A healthy mouse heart has an E/A ratio ≥1 and a MPI value ≤0.5. In pathological conditions with diastolic or systolic cardiac dysfunction, such as in mice subjected to TAC, a decreased E/A ratio and/or an increased MPI value are typically observed.
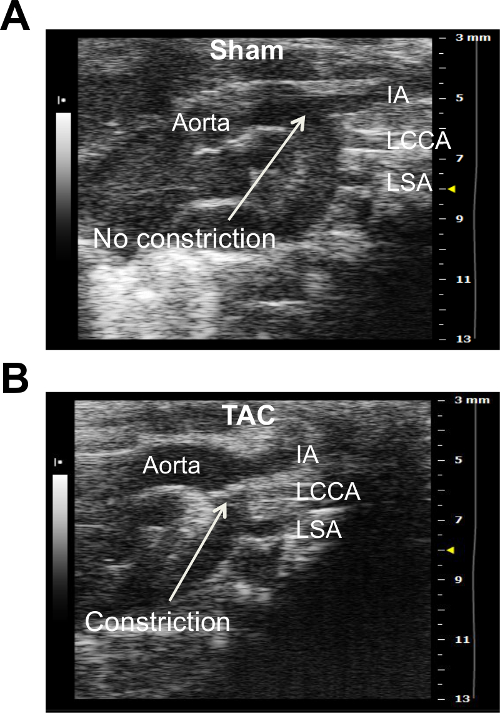
Figure 1. B-mode Image of the Aortic Arch View of Mouse Heart Subjected to Sham Surgery (A) or TAC (B). Major aortic branches including innominate artery (IA), left common carotid artery (LCCA), and left subclavian artery (LSA) are shown. Note that transverse aortic constriction (indicated by the white arrow) can be visualized in TAC but not sham heart. Please click here to view a larger version of this figure.
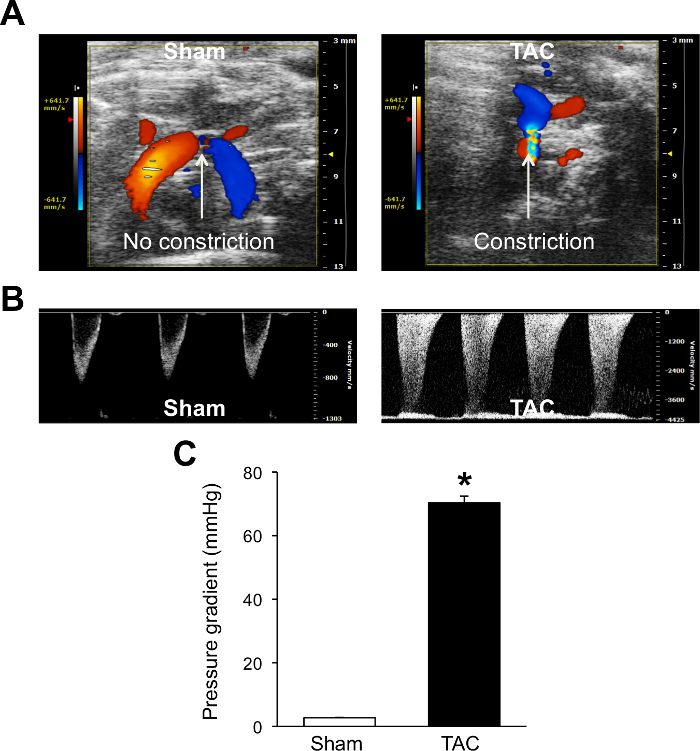
Figure 2. Color/PW Doppler Imaging of the Transverse Aorta Blood Fow from the Aortic Arch View. Color (A) and PW (B) Doppler images from sham and TAC hearts are shown. Peak aortic velocity obtained from PW Doppler imaging is used to calculate pressure gradient according to the modified Bernoulli equation (C). These data confirm a successful TAC surgery with the pressure gradient of ~70 mmHg. *P <0.05 vs. Sham. Data are expressed as mean ± s.e.m. n = 15 for Sham and n = 13 for TAC. Student's t-test was used to determine statistical significance. Please click here to view a larger version of this figure.
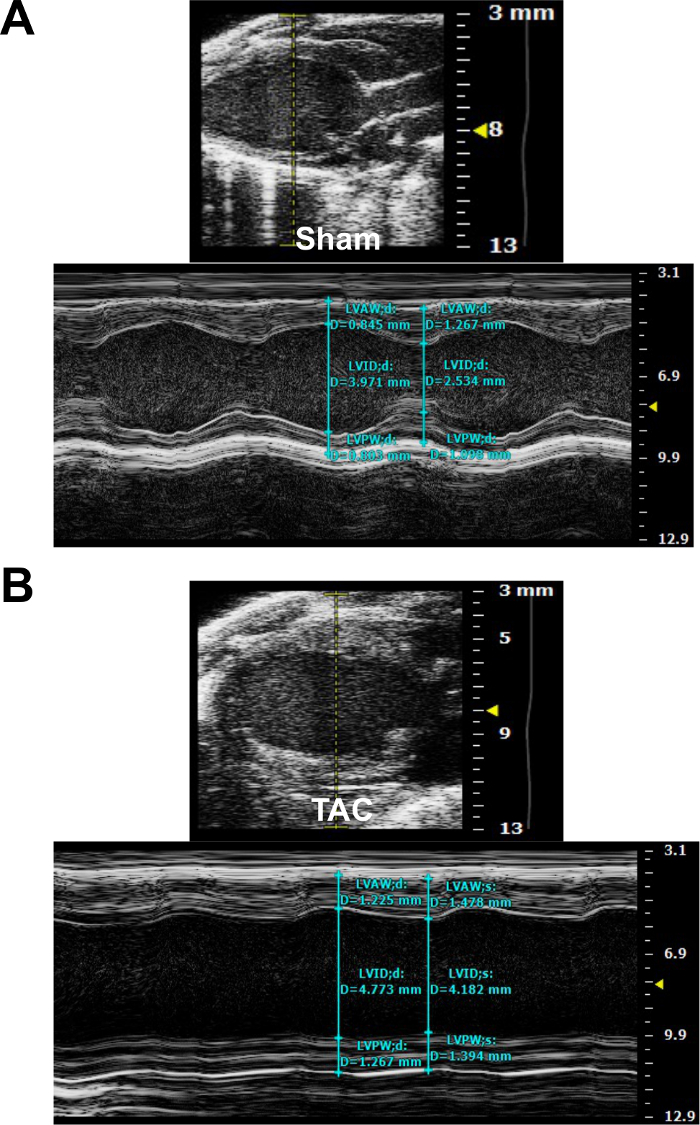
Figure 3. Parasternal Long Axis (PLAX) View of Mouse Heart Subjected to Sham Surgery (A) or TAC (B). M-mode images indicate the placement of the sample volume (dotted yellow line in the upper panel) and measurement of cardiac dimensions in diastole and systole (blue lines in the lower panel). Please click here to view a larger version of this figure.
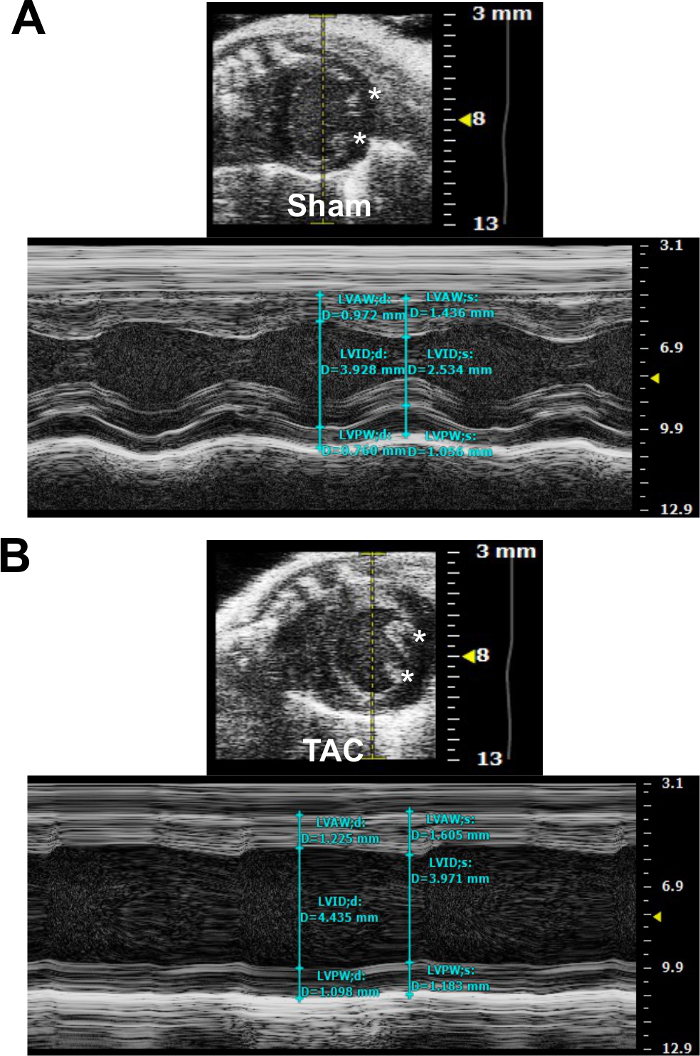
Figure 4. Parasternal Short Axis (PSAX) View of Mouse Heart Subjected to Sham Surgery (A) or TAC (B). M-mode images indicate the placement of the sample volume (dotted yellow line in the upper panel) and measurement of cardiac dimensions in diastole and systole (blue lines in the lower panel). The asterisks indicate papillary muscles. Please click here to view a larger version of this figure.
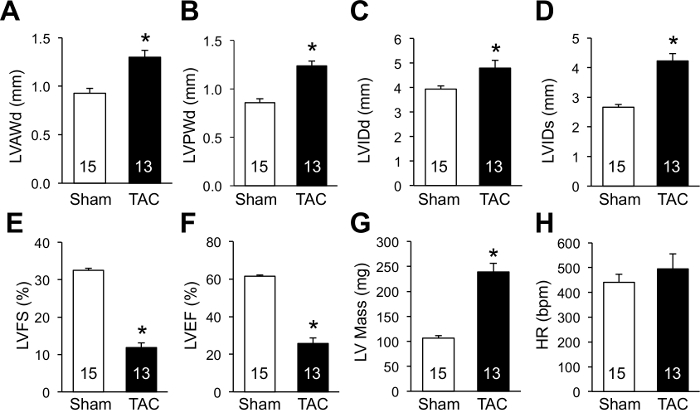
Figure 5. Echocardiographic Assessment of Cardiac Morphological and Functional Changes Following TAC. M-mode imaging in short axis view was performed as in Figure 4. (A) LVAWd, left ventricular anterior wall thickness in diastole. (B) LVPWd, left ventricular posterior wall thickness in diastole. (C) LVIDd, left ventricular internal diameter in diastole. (D) LVIDs, left ventricular internal diameter in systole. (E) LVFS, left ventricular fractional shortening. LVFS (%) = (LVIDd-LVIDs)/LVIDd x100%. (F) LVEF, left ventricular ejection fraction. LVEF (%) = (LVEDV-LVESV)/LVEDV x100%. LVEDV and LVESV denote left ventricular end-diastolic and end-systolic volume, respectively. LV volume and ejection fraction are precisely assessed by Simpson's method. LV volume is estimated by fitting numerous disks into the ventricle: Simpson volume = [area(1) + area(2) + … + area(n)] x length. Simpson area and length are obtained by tracing the endocardial border of the LV in the long axis and short axis view. (G) LV (left ventricular) mass. LV mass (mg) = 1.05 x [(LVIDd + LVPWd + IVSd)3 – (LVIDd)3]. The factor 1.05 represents the specific density of the myocardium. (H) HR, heart rate. *P <0.05 vs. Sham. The number of mice analyzed is shown in the bars of each panel. Data are expressed as mean ± s.e.m. Student's t-test was used to determine statistical significance. Please click here to view a larger version of this figure.
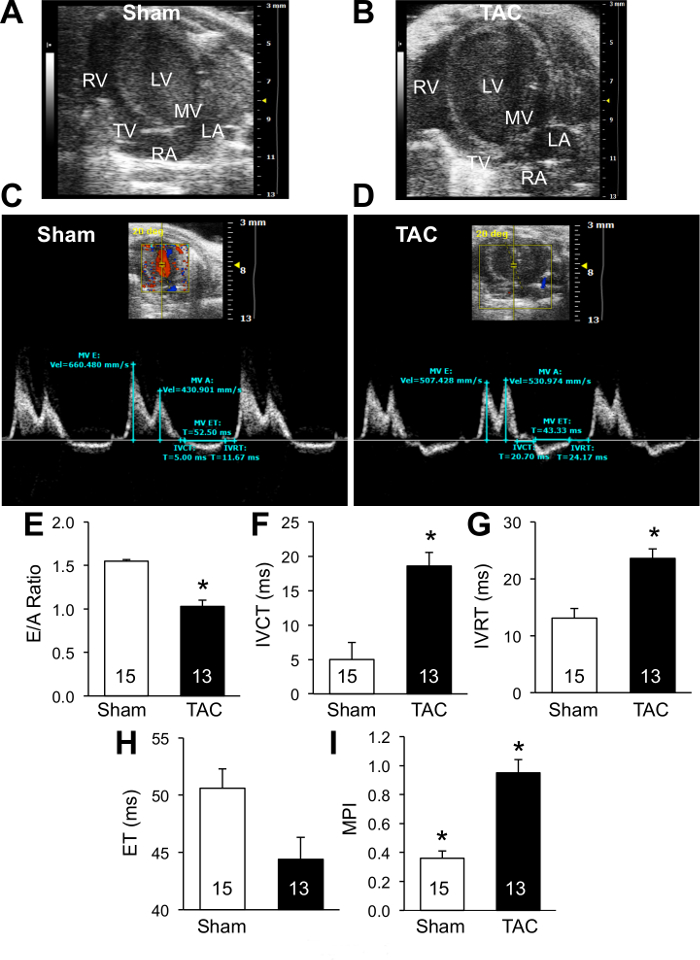
Figure 6. Assessment of Transmitral Blood Flow by Doppler Imaging. (A and B) B-mode apical four-chamber view of sham (A) or TAC (B) heart. LV, left ventricle; RV, right ventricle; MV, mitral valve; TV, tricuspid valve; LA, left atrium; RA, right atrium. (C and D) PW Doppler waveform of trans-mitral blood flow in sham (C) or TAC (D) heart. Relevant measurements are shown. (E) E/A, peak E and A velocity ratio. (F) IVCT, isovolumic contraction time. (G) IVRT, isovolumic relaxation time. (H) ET, ejection time. (I) MPI, myocardial performance index. *P <0.05 vs. Sham. The number of mice analyzed is shown in the bars of each panel. Data are expressed as mean ± s.e.m. Student's t-test was used to determine statistical significance. Please click here to view a larger version of this figure.
Echocardiography has been widely used to assess cardiac function in rodent models of heart disease2,6. Compared to invasive or terminal methodologies such as pressure-volume loop measurement11 and ex vivo working heart12, echocardiography provides a powerful, noninvasive tool to assess ongoing cardiac structural and functional changes in living animals. To obtain reliable data, it is important to maintain body temperature and heart rate within physiological range13 by careful adjusting the heating apparatus and the anesthesia level. All images should be captured and analyzed consistently according to the standardized imaging procedures, to facilitate the comparison between mice of different strain or genotype.
TAC is commonly used to induce cardiac hypertrophy and heart failure in mice1. Noninvasive measurement of pressure gradient across the constriction site by Doppler imaging represents a reliable assessment of the degree of pressure overload in mice. Successful TAC typically produces a pressure gradient ≥40 mmHg. Only mice subjected to similar degree of pressure overload should be included for further analysis, while mice with a pressure gradient too low or too high should be excluded. Following TAC, mice are expected to develop cardiac hypertrophy within 1-2 weeks, and cardiac dilatation after 4 weeks, depending the degree of pressure overload and the genetic background of mice tested. The dynamic cardiac remodeling and functional changes following TAC can be reliably assessed by echocardiographic imaging as described above.
In contrast to its frequent usage in humans14, color/PW Doppler has only been recently available in rodent ultrasound imaging9. Here also we described the applications of Doppler imaging in measuring pressure gradient as well as systolic and diastolic performance. Measurement of mitral and tricuspid blood flow directionality and velocity (i.e., E/A ratio, IVRT, IVCT, ET, and MPI) provides important information on cardiac function. Thus echocardiographic imaging represents an important tool to study cardiac physiology and pathophysiology in small animals.
The limitation of cardiac ultrasound imaging is related to measurement variability and reproducibility. To reduce inter- and intra- operator variability, it is important to standardize how images are acquired and analyzed. Measurements should be performed from multiple acoustic windows and modes (B-mode, M-mode, and PW/color Doppler) and at least 3 separate measurements should be averaged to ensure accuracy and reliability. In addition, there are limited acoustic windows and sometimes low quality images are obtained in small rodents subjected to surgical procedures such as TAC, due to tissue swelling, surgical scars, and lung edema that interfere with the ultrasound beams. For Doppler imaging, sometimes it is challenging to separate E and A waves and obtain a complete waveform of the mitral flow, due to a relatively high heart rate in small rodents, especially in mice subjected to TAC or MI surgery. Lowering the heart rate may be helpful to get measurements, but this will affect values obtained by Doppler imaging and hence the data interpretation.
With recent technical advances, newly released ultrasound systems provide high image resolution and frame/sampling rates to ensure accurate quantitative measurement in small animals. New echocardiography technologies will also improve the sensitivity of echocardiographic evaluation of cardiac function and permit early detection of cardiac pathology. For example, speckle-tracking strain imaging15 has been used to precisely measure regional myocardial function. New transducer technologies currently under development will provide the potential for real-time, 3D or 4D imaging. Contrast echocardiography that is in advanced development will allow for volumetric measurements, tissue perfusion assessments, molecular imaging of cardiovascular disease, and delivery of therapeutic agents.
The authors have nothing to disclose.
Anesthesia equipment | Harvard Apparatus, 84 October Hill Road Holliston, MA |
723015 | |
Vevo 2100 Imaging System | VisualSonics Inc., 3080 Yonge Street Suite 6100, Box 66, Toronto, Ontario, Canada | Vevo 2100 | |
Aquasonic ultrasound gel | Parker Laboratories, 286 Eldridge Rd, Fairfield, NJ | 03-50 | |
Isoflurane | Piramal Healthcare, Inc, 3950 Schelden Circle Bethlehem, PA |
NDC 66794-017-25 | |
F/air anesthesia gas filter unit | A.M. Bickford, Inc, 12318 Big Tree Rd, Wales Center, NY | 80120 |