There is a growing recognition that cellular heterogeneity, arising from the stochastic expression of genes, proteins, and metabolites, exists within a large cell population and serves as a fundamental principle in biology to allow for cell adaptation and evolution1. Therefore, it is often inaccurate and unreliable to use population-based bulk measurements to understand the function of individual cells and their interactions. Developing new technologies for single-cell analysis is therefore of high interest in biological and pharmacological research, and can be used, for example, to better understand the key signaling pathways and processes in stem cell biology and cancer therapy2-4. In recent years, the emergence of microfluidic platforms has greatly facilitated single-cell analysis, where the positioning, treatment, and observation of the response from individual cells have been performed with novel analytical strategies5.
Cavitation plays an important role in a diverse range of biomedical applications, including the treatment of cancers by high-intensity focused ultrasound (HIFU)6, the non-invasive fragmentation of kidney stones by shock wave lithotripsy (SWL)7, drug or gene delivery by sonoporation8, and the recently reported destruction of cells or tissues by hydrodynamic bubble cavitation9,10. Despite this, the dynamic processes of cavitation bubble(s) interactions with biological tissue and cells have not been well understood. This is due to the randomness in cavitation initiation and bubble dynamics produced by ultrasound, shock waves, and local hydraulic pressure; furthermore, there is a lack of enabling techniques to resolve the inherently complex and fast responses of biological cells, especially at the single-cell level.
Because of these challenges, it is not surprising that very few studies have been reported to investigate bubble-cell interactions under well-controlled experimental conditions. For example, membrane poration of individual cells trapped in suspension11 and the impulsive large deformation of human red blood cells12 have been demonstrated using laser-generated single bubbles in microfluidic channels. The latter technique, however, can only produce very small deformation in eukaryotic cells because of the presence of the nucleus13. Moreover, it is difficult to monitor downstream bioeffects when treating cells in suspension. In other studies, ultrasound excitation of a cell-bound microbubble (or ultrasound contrast agent) for producing membrane poration and/or intracellular calcium responses in single adherent cells has been reported8. Membrane poration of single adherent cells can also be produced by using laser-generated tandem bubbles in a thin liquid layer containing light-absorbing Trypan blue solution14, or by an oscillating gas bubble generated by microsecond laser pulses irradiating through an optically absorbing substrate in microchambers15. When compared, the optically absorbing substrate has an advantage over the laser-absorbing Trypan blue solution because the latter is toxic to cells. More importantly, laser-generated bubbles are more controllable in terms of bubble size and location than acoustically excited bubbles. Nevertheless, in all these previous studies, the cell shape, orientation, and adhesion conditions were not controlled, which may substantially influence the cell response and bioeffects produced by mechanical stresses16.
To overcome these drawbacks in previous studies, we have recently developed an experimental system for bubble generation, cell patterning, bubble-bubble-cell interactions, and real-time bioassays of cell response in a microfluidic chip constructed by using a unique combination of microfabrication techniques. Three main features that distinguish our experimental system from others in the field are: 1) the patterning of micron-sized gold dots on the glass substrate to enable localized laser absorption for bubble generation17; 2) the patterning of micron-sized islands of extracellular matrix (ECM) for cell adhesion on the same substrate to control both the location and geometry of individual cells; and 3) the compression of the dimension of the bubble-bubble-cell interaction domain from 3D to a quasi-2D space to facilitate in-plane visualization of bubble-bubble interactions, jetting flow fields, cell deformation, and bioeffects, all captured in one streamlined imaging sequence (Figure 1d).
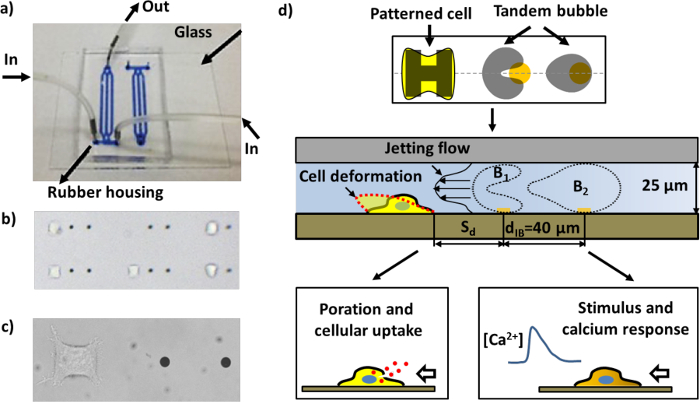
Figure 1: The microfluidic chip and schematics of different assays. a) An assembled microfluidic chip with channels filled with blue ink for visualization. b) A region inside the microfluidic chip with patterned cells and gold dots (the distance between the two gold dots in proximity is 40 µm). Many pairs of working units can be arranged in a channel. c) Close-up image of a single working unit consisting of a pair of gold dots and a HeLa cell adhered to the cell-patterning region. d) Schematic of the device operation. A single cell adheres to and spreads on the "H"-shaped island coated with fibronectin. A pair of cavitation bubbles (tandem bubble) with anti-phase oscillation are produced by illuminating pulsed laser beams on the gold dots (see Figure 4a), leading to the generation of a fast and localized jet moving towards the target cell nearby. The cell may be deformed, porated for macromolecular uptake, and/or stimulated with a calcium response, depending upon the standoff distance (Sd) of the cell to the tandem bubble. Please click here to view a larger version of this figure.
This platform can be further combined with fluorescence assays and functionalized beads attached to the cell surface for cavitation-induced bioeffects. In particular, this platform opens the way for reliable and quantifiable assays at the single-cell level. Up to now, we have used the device for the analysis of tandem bubble-induced cell membrane deformation, cell poration and intracellular uptake, viability, apoptosis, and intracellular calcium response. In the following protocol, we describe the process of chip fabrication and the procedure for analyzing the various bioeffects mentioned above. Moreover, the operations of the chip are also described.
1. Microfabrication
NOTE: All the microfabrication procedures are performed in a cleanroom. A chrome mask is designed prior to the microfabrication, see Figure 2.
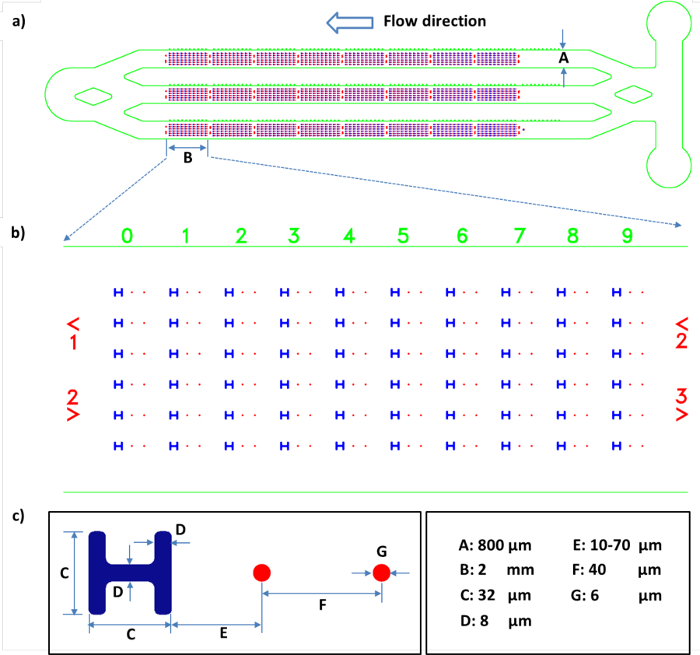
Figure 2: Schematic of the channel design in the microfluidic chip and the dimensions of the working units. a) Mask design of the aligned PDMS microchannels (green) and the patterns on the glass substrate (blue and red). b) Enlarged image of the mask design in a representative section of the working unit arrays. c) Schematic of one working unit showing a cell pattern (blue) and a pair of gold dots (red). All the length scales are shown on the bottom right. Please click here to view a larger version of this figure.
- Gold dot patterning
NOTE: The area of each gold dot is designed to be within 25-30 µm2, so that it is large enough to absorb laser energy for bubble generation, but small enough to avoid individual cells adhering to it. A schematic diagram for the gold dot fabrication is shown in Figure 3a.- Glass slide cleaning (in a chemical hood)
- Flush the glass slide with acetone followed by isopropyl alcohol (IPA), and then dry it with N2 flow.
- Soak the slide in piranha solution (H2SO4:H2O2 = 4:1) for 10 min.
- Take out the slide, rinse it with DI water, and then dry it with N2 flow.
- Bake the glass slide on a hotplate at 120 °C for 10 min.
- Treat the slide in a plasma asher at 100 W for 90 s.
- Spin-coating (spin-coating hood)
- Turn on a hotplate and wait until the temperature is stable at 95 °C.
- Follow the coating procedure:
1,000 rpm for 5 s with a 500-rpm/s ramp;
then 3,000 rpm for 30 s with a 1,000-rpm/s ramp. - Fix the cleaned glass slide onto the spin coater by applying a vacuum.
- Cover the slide surface with P-20 and start the coating recipe.
- Repeat the coating process for NFR-negative photoresist.
- Bake the slide at 95 °C for 60 s and wait until it cools down to room temperature.
- Photolithography
- Mount the chrome mask onto the mask aligner and make sure that the pattern side is facing down towards the slide.
- Set the photolithography recipe to hard exposure mode with 9 s of UV exposure and quickly align the glass substrate with the mask.
- After carrying out the UV exposure, bake the slide at 95 °C for 1 min, and then let it cool down to room temperature.
- Development
- Develop the pattern on the slide in developer solution for 60 s.
- Remove the slide from the developer, flush it with DI water, and dry it with N2 flow.
- Check the pattern geometry under a microscope, and measure and record the feature size.
- Gold deposition (E-beam evaporation) and lift-off
- Bake the slide at 120 °C for 5 min, and let it cool down to room temperature.
- Clean the slide with plasma in the reactive ion etching (RIE) machine for 90 s at 500 Torr and 100 W.
- Deposit 5 nm of Ti and 15 nm of Au onto the slide using an E-beam evaporator17.
- Soak the slide overnight in a glass beaker containing photoresist remover solvent to remove the gold resting on top of the NFR resist.
- Retrieve the slide, flush it with acetone followed by IPA, and dry it with N2 flow.
- Dry the slide on a hot plate at 115 °C before cleaning it in the oxygen plasma asher at 100 W for 90 s.
- Glass slide cleaning (in a chemical hood)
- Molecular-assembly patterning by lift-off (MAPL)
Note: The area of each fibronectin-coated island is set to be within 700-900 µm2 to facilitate adequate HeLa cell spreading in a square region while minimizing the chances of multiple cells aggregating on the island. A schematic diagram for the preparation of cell-patterning islands is shown in Figure 3b.- Spin coating
- Repeat step 1.1.2, but use S1813-positive photoresist and a temperature of 115 °C.
- Aligned photolithography
- Mount the chrome mask onto the mask aligner and make sure that the side with the pattern is facing down towards the slide with the gold dots.
- Set the photolithography recipe to hard exposure mode with 9 s of UV exposure.
- Align the top mask with the bottom slide using alignment marks, located around the edge of the mask, as a spatial reference.
- Check the central portion of the mask and verify that the pattern features are aligned correctly.
- Complete the UV exposure without a post-bake.
- Development
- Repeat step 1.1.3 but with 45 s of development before drying on a hotplate and preserving in N2 storage.
- Spin coating
- Chemical treatment
- Prepare the passivating solution: 0.5 mg/mL PLL-g-PEG in 10 mM HEPES buffer.
- Retrieve the slide from N2 storage and clean it using RIE with the parameter setting: 500-Torr pressure, 100-W power, and 90-s duration.
- Pipette one drop of passivating solution onto a piece of paraffin film.
- Sandwich the solution with the film and the slide, making sure that the side with the pattern features is facing down towards the film; avoid the formation of bubbles.
- Wait for 45 min before removing the slide from the film.
- Soak the slide consecutively in photoresist remover, photoresist remover and DI water (1:1), and DI water, and agitate it in an ultrasound bath for 90 s for each soak.
- Dry the slide on a hotplate to remove the moisture before sealing it in a desiccator and storing it in a refrigerator.
- Chip assembly
- Repeat steps 1.1.1-1.1.4, but with SU8-2025-negative photoresist and the parameter setting referred called the Microchem protocol18, to prepare a silicon mold with a photomask.
- Fabricate a PDMS microchannel (40 mm x 25 mm x 5 mm, L x W x H) and a small PDMS slab (800 µm-wide groove structure) using soft lithography.
- Punch the microchannel for fluid access ports and clean it with tape and then with IPA.
- Shield the patterned area of the glass substrate with the PDMS slab, and apply RIE (100 W, 500 mTorr, 60 s) to remove PLL-g-PEG from the peripheral area.
- Treat the microchannel with a reduced dose of RIE (25 W, 500 mTorr, 25 s), and then align it to the patterned glass substrate (with the small PDMS slab removed); bring the microchannel and the patterned glass substrate in conformal contact under a stereoscope.
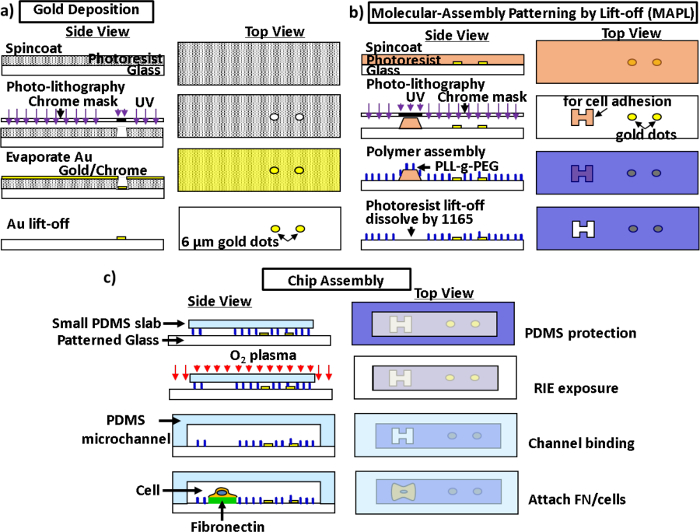
Figure 3: Schematic diagrams for microfabrication and chip assembly. a) Pattern of gold dots on the glass substrate. b) Preparation of the glass substrate for cell patterning via MAPL. c) Assembly of the microfluidic channel with plasma bonding. See the Materials List for the definitions of the abbreviations. Please click here to view a larger version of this figure.
- Cell attachment
NOTE: HeLa cells are routinely maintained in DMEM supplemented with 10% FBS and 1% antibiotic/antimitotic solution in a cell culture incubator. A schematic diagram for the chip assembly and cell attachment is shown in Figure 3c.- Prime the chip with PBS for 30 min at 1 µL/min, and then infuse fibronectin solution (50 µg/mL in PBS, 1 µL/min) for 45 min.
- While waiting, trypsinize cell culture with 0.25% trypsin-EDTA, wash them in culture medium, centrifuge individual cells, and reconstitute the cell suspension in pre-warmed (37 °C) culture medium at 5×10⁶ cells/mL.
- Replace the fibronectin solution with PBS and flush the chip at 10 µL/min for 5 min.
- Inject the prepared cell suspension into the chip, stop the flow, clamp the outlet, and maintain the chip in a cell culture incubator for 30 min.
- Release the outlet and flush the chip with cell culture medium at 10 µL/min for 5 min. Reduce the perfusion flow rate of the culture medium to 0.75 µL/min and maintain the cell culture for 2 h in the incubator.
2. Bubble Generation and Flow Visualization
NOTE: A schematic of the experimental setup is shown in Figure 4a for tandem bubble generation and the resultant flow interaction with a single cell grown nearby in a microfluidic channel.
- Generation of tandem bubbles with two lasers and timing control
- Place the microfluidic chip on the stage of an inverted microscope and align the foci of two pulsed Nd:YAG lasers (λ = 532 nm, 5-ns pulse duration) on a pair of patterned gold dots separated by 40 µm.
- Use a digital delay generator to trigger the two lasers with a time delay about 2.5 µs to produce two bubbles initiated at the gold dots.
- Adjust the laser output energy (~10 µJ) to produce a maximum diameter of the bubbles within 50 ± 2 µm.
- Synchronize a high-speed camera (200-ns exposure and 2 million frames per second (fps)) to the lasers and capture the dynamics of bubble expansion, collapse, bubble-bubble interaction, and jet formation.
- Quantification of jet velocity
- Record the position of the jet tip (J1) at the proximal end of the first bubble (B1) and the distal end of B1, starting at the generation of the second bubble (B2) and ending with the touchdown of J1 towards the distal end of B1; see the schematic in Figure 5a.
- Linearly fit the time course of position for both the proximal (jet tip) and the distal ends. Calculate the slope of the tip position versus time curve for the proximal end to determine the jet speed. The intersection of the two lines indicates the jet touchdown time. More details can be found in Reference 19.
- Visualization of the tandem bubble-induced flow field
- Prepare 1 µm of polystyrene (PS) bead suspension in DI water (2.6% w/v) and inject the beads into the microfluidic chip.
- Generate tandem bubbles as described in step 2.1.1-2.1.3.
- Record the tandem bubble dynamics using a high-speed video camera at a framing rate of 5 M fps with a 100-ns exposure time.
- Upload the acquired image sequence into a commercial PIV software.
- Divide each image into smaller interrogation windows of 16 x 16 pixels (px) with a 75% overlap.
- Apply multi-pass iteration and regional filters to reduce the errors in velocity field computation, and output the results in a velocity vector map.
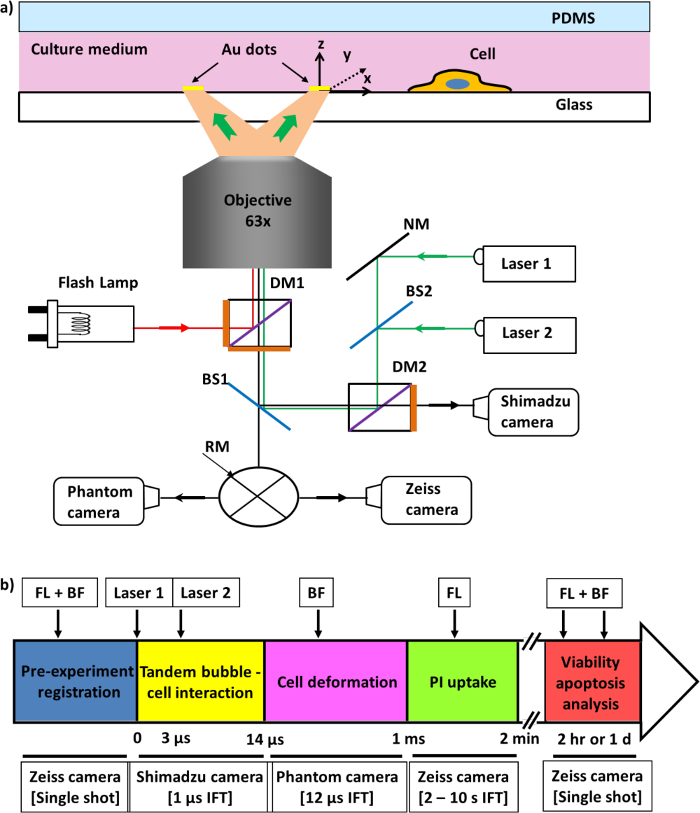
Figure 4: Schematic of the experimental setup and image recording. a) Experimental setup for tandem bubble generation. b) Time sequence used for different types of imaging acquisitions. FL: fluorescence microscopy, BF: bright field, IFT: interframe time. Please click here to view a larger version of this figure.
3. Single-cell Analysis and Bioeffects
NOTE: The tandem bubble is produced next to the target cells, and the resultant bioeffects are studied in a standoff distance-dependent manner. The time sequence for different types of image acquisitions is depicted in Figure 4b.
- Membrane poration and macromolecular uptake
NOTE: The uptake of extracellular macromolecules into the target cell is characterized by the progressive diffusion of membrane impermeant propidium iodide (PI) through the poration site on the cell membrane.- Following step 1.5, replace the regular culture medium (i.e., DMEM) with PI solution (100 µg/mL in DMEM) running at a perfusion flow rate of 0.5 µL/min throughout the experiment.
- Program the microscope control software to automatically select the PI fluorescent cube on the rotating turret and synchronize the timing of the CCD camera with the PI fluorescence excitation to capture fluorescence images with an exposure time of 200 ms.
- After the two laser foci are aligned to a pair of gold dots next to a target cell, record both bright field (BF) and fluorescence (FL) images before the tandem bubble treatment.
- Use microscope control software to immediately start a time-lapse fluorescence image recording of the target cell shortly after step 2.1 to capture the history of PI uptake.
- Membrane deformation
- Prepare 1-µm beads (1% w/v, activated with water-soluble carbodiimide) and functionalize them with Peptide-2000 (100 µg/mL in PBS).
- Following step 1.5, incubate the attached cells with the functionalized beads at a density of 1×10⁹ beads/mL at 37 °C for 30 min.
- Repeat step 2.1 to produce tandem bubbles next to the target cell and record the cell deformation with an ultra-high-speed camera running at a framing rate of 5 million fps.
- Identify a triad of 3 beads that remain on the imaging plane throughout the experiment and compile their positions as (x1, y1) (x2, y2), and (x3, y3) in the experiment coordinates.
- Calculate the area of the triad before and after the tandem bubble treatment using the formula:

- Calculate the area strain as:

- Based on the coordinates of the three vertices before and after the tandem bubble treatment, calculate the local principal strain and area strain following established protocols20,21.
- Viability and apoptosis
NOTE: FITC Annexin V labels cells, including apoptotic ones, through the externalization of phosphatidylserine (green fluorescence). PI labels the nuclei of necrotic cells (red fluorescence). Bright field imaging is used to document cell morphology and to assist with the identification of cell viability and apoptosis.- Record the position of each treated cell in the microfluidic channel (facilitated by the address labels in the channel, see Figure 2b) while repeating step 3.1.
- Incubate the treated cells in the cell culture medium for another 2 h before perfusing the chip with FITC Annexin V solution for 15 min. Positive cells display green fluorescence.
- Repeat step 3.3.2 24 h after the tandem bubble treatment to study the long-term bioeffects in the targeted cells.
- Calcium response
- Mix 3 µL of fura-2 AM stock solution (1 mg/mL in DMSO) with 3 µL of 10% w/v Pluronic F-127 in 500 µL of reduced serum medium to prepare the final labeling solution (6 µM).
- Following step 1.5, replace the cell culture medium with the labelling solution and incubate under room temperature in the dark for 40 min (1 µL/min perfusion rate).
- Refill the channel with the reduced serum medium (0.75 µL/min perfusion rate) before starting the cell experiment.
- Start ratiometric imaging (wavelength: 340/380 nm, 50-ms exposure) of the target cell using the commercial PTI system.
- After 10 s of ratiometric imaging of the cell at resting level, produce tandem bubbles as in step 2.1; first record with an interframe time (IFT) of 0.1 s for 1 min, then increase the IFT to 1 s for another min, and further increase to 5 s after 2 min.
- Use the PTI software to calculate the ratio R = F340/F380 in the region of interest (ROI), which is proportional to the intracellular calcium concentration.
The microfluidic platform described in this work can be used to investigate bubble-bubble interactions and to analyze a variety of cavitation-induced bioeffects at the single-cell level. Here, we present several examples to demonstrate a variety of experimental studies and bioassays that can be performed in our experimental system. We will first illustrate the transient interactions of tandem bubbles with the jet formation, the visualization of the resultant flow field, and the calculation of the jet speed (Figure 5a). We will then present examples of tandem bubble-induced localized cell membrane deformation (Figure 5b), pinpointed membrane poration with PI uptake (Figure 5c), and intracellular calcium response (Figure 5d). Other examples, such as cell viability and apoptosis assays, can be found in Reference 22.
Figure 5a shows an example of the tandem bubble interaction with the jet formation, captured by high-speed imaging, and the resultant flow field revealed by PIV. Specifically, following its maximal expansion, the collapse of the first bubble B1 (produced at 0 µs) is distorted asymmetrically by the rapid expansion of the second bubble B2 (produced at 2.5 µs), leading to the formation of an "upward" jet (J1) at 3.4 µs and the subsequent jetting flow, shown at 5.4 µs. The average jet speed is determined by the slope of a fitted line for the position of the proximal end (or pole) of B1 before touchdown (i.e., contact with the distal end of B1) versus time. The average jet speed is found to increase from 20 to 58 m/s when the maximum diameter of B2 increases from 40 to 60 µm. Based on the results of PIV analysis, the directional jetting flow around the tandem bubble is on the order of 10 m/s and is confined within a width on the order of 10 µm. It is thus capable of producing an impulsive and localized shear stress and stress gradient onto a target cell grown nearby.
Another example shown in Figure 5b illustrates the cell membrane deformation induced by the directional and localized jetting flow produced by the tandem bubbles at standoff distance Sd = 40 µm. The membrane deformation and recovery are highlighted by the displacement of a functionalized bead (indicated by the yellow dotted line) attached to the leading edge of the cell membrane. The local area strain can be calculated from the coordinates of a triad of adjacent beads. A schematic of the calculated maximum area change at different locations on the cell surface is shown in the middle. The leading edge is primarily stretched (see the green circles), while the trailing edge or lateral sides of the cell are compressed (as indicated by the red circles), indicating heterogeneity in cell deformation produced by the tandem bubble induced jetting flow. The temporal variation of the area strain at the cell leading edge is illustrated on the right. It is comprised of a few rapid oscillations in the beginning, followed by a large and sustained stretch for about 100 µs (FWHM) and a subsequent gradual recovery on a time scale of several ms.
Furthermore, the large area strain and strain integral at the cell leading edge may be responsible for the cell membrane poration observed at small Sd, as shown in Figure 5c. At small Sd (i.e., 10 µm, or in some cases, 20 µm) and intermediate Sd (i.e., the majority of 20 and 30 µm), a localized membrane disruption is induced, leading to a pinpoint uptake of extracellular PI into the cytosol. If the PI intensity inside the cell keeps increasing without saturation, necrosis occurs. In comparison, if the PI intensity is an order of magnitude lower and reaches a plateau within 10 s following the tandem bubble treatment, repairable poration with likely cell survival will occur, which is further supported by the minimal change in cell morphology. At large Sd (i.e., 40 µm), negligible PI uptake is found following tandem bubble treatment, indicating negligible or non-poration. The cell can survive with regular growth and proliferation22. Overall, the results show a clear transition in cell response from necrosis, through repairable membrane poration, to non-poration in the range of Sd ≈ 20-40 µm.
Finally, we show the results of ratiometric imaging of the intracellular calcium response elicited by tandem bubbles in individual cells at different Sd, especially in the sublethal range of Sd = 30-50 µm (Figure 5d). The intensity ratio is proportional to the amount of intracellular calcium. At small Sd (i.e., 30 µm or, in some cases, 40 µm), a calcium wave travelling from the leading edge to the trailing edge is clearly observed within a few seconds following the tandem bubble treatment. After the intracellular calcium reaches a peak concentration, it decays slowly back to the resting level within a few minutes. In contrast, at large Sd (i.e., a majority of 50 µm, or in some cases, 40 µm), the increase of intracellular calcium is much milder, and no clearly visible travelling calcium wave can be identified. These two different calcium responses can also be distinguished from their intensity ratio versus time profiles, with significant differences in the peak amplitude of the intensity ratio and the rise time from resting level to peak value. At an even larger Sd (i.e., above 60 µm), no calcium response can be observed. The percentage of HeLa cells displaying calcium responses at various Sd is summarized in Figure 5d (right).
All in all, our results have demonstrated that, by altering the strength of the jetting flow (or changing Sd), a variety of bioeffects can be produced in individual HeLa cells under similar culture conditions, which is likely correlated with the amplitude and duration of the mechanical deformation imposed on the cell membrane22.
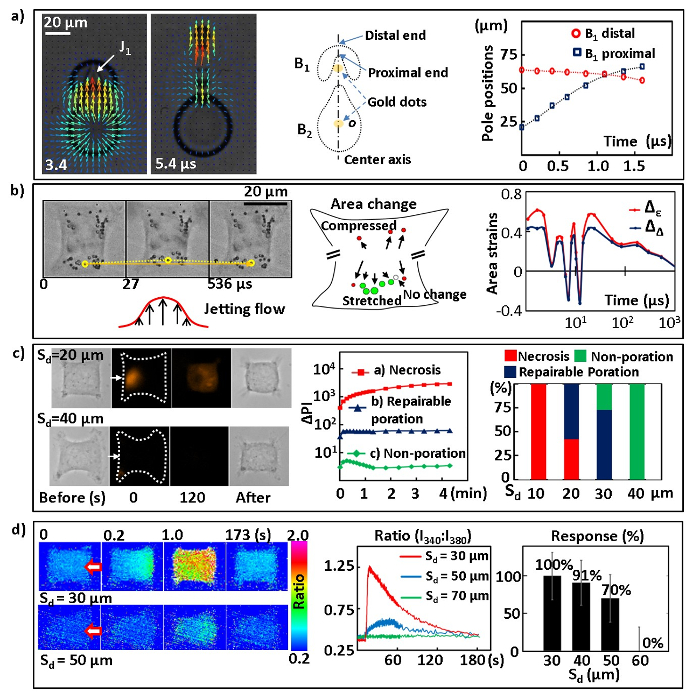
Figure 5: Results from tandem bubble interaction, cell membrane deformation, membrane poration, and calcium response assays. a) Fluid motion and the jet induced by tandem bubble interaction. Left: Selected frames showing tandem bubble interactions with the jet formation and flow field revealed by PIV. The maximum diameters of the two bubbles are about 50 ± 2 µm. Middle: Schematic of the jetting tandem bubbles, illustrating the center axis, origin of the coordinates (o), and proximal and distal ends (or poles) of the first bubble B1. Right: Measured pole positions (with error = ±1 µm) at the proximal and distal end of B1. b) Cell membrane deformation. Left: The yellow dotted line labels the displacement of a PS bead attached to the leading edge of the cell membrane, indicating the local membrane deformation and recovery. Middle: a schematic showing the peak area strains at different locations on the cell surface shown on the left. Right: The time courses of the area strains in the middle of the cell leading edge. Δε is the area strain calculated based on principal strains and ΔΔ is the area strain calculated based on the triad geometry change. More details about the area strain calculation and error analysis are documented in Reference 22. c) Cell membrane poration. Left: bright field images before and after tandem bubble treatment and time-lapse fluorescence images of PI uptake (0 and 120 s). The white arrows indicate the jetting flow direction. Middle: the typical change of average PI intensity versus time inside the cells. Right: Statistical results of the percentage of cells undergoing necrosis (red), repairable poration (blue), and non-poration (green) at different Sd. Number of cells treated: N = 9, 14, 14, and 8 for Sd = 10, 20, 30, and 40, respectively. The statistic error is ±1/√N. d) Intracellular calcium response. Left: sequences of ratiometric images showing the intracellular calcium responses of individual cells at Sd of 30 µm and 50 µm. The red arrows indicate the jet direction. Middle: typical response profiles (ratio-time curves) at different Sd. Right: the probability of a calcium response at different Sd. Please click here to view a larger version of this figure.
| standoff distance (Sd) (μm) | Reynolds number (Re) | averaged shear stress (Pa) in yz plane |
| 20 | 206.96 | 618.64 |
| 30 | 354.8 | 709.69 |
| 40 | 378.78 | 657.22 |
| 50 | 163.85 | 323.61 |
| 60 | 105.08 | 42.21 |
Table 1: A list of parameters for flow physics from the PIV results. Estimated Reynolds number and averaged shear stress with respect to different standoff distances (Sd). The YZ plane refers to the channel width x height plane. The averaged shear stress is estimated from a height of 0 to 7.7 µm from the channel bottom because the cell height in the channel is around 6-7 µm.
