This study implemented whole genome sequencing for analysis of mutations in genes conferring antifungal drug resistance in Candida glabrata. C. glabrata isolates resistant to echinocandins, azoles and 5-flucytosine, were sequenced to illustrate the methodology. Susceptibility profiles of the isolates correlated with presence or absence of specific mutation patterns in genes.
Candida glabrata can rapidly acquire mutations that result in drug resistance, especially to azoles and echinocandins. Identification of genetic mutations is essential, as resistance detected in vitro can often be correlated with clinical failure. We examined the feasibility of using whole genome sequencing (WGS) for genome-wide analysis of antifungal drug resistance in C. glabrata. The aim was torecognize enablers and barriers in the implementation WGS and measure its effectiveness. This paper outlines the key quality control checkpoints and essential components of WGS methodology to investigate genetic markers associated with reduced susceptibility to antifungal agents. It also estimates the accuracy of data analysis and turn-around-time of testing.
Phenotypic susceptibility of 12 clinical, and one ATCC strain of C. glabrata was determined through antifungal susceptibility testing. These included three isolate pairs, from three patients, that developed rise in drug minimum inhibitory concentrations. In two pairs, the second isolate of each pair developed resistance to echinocandins. The second isolate of the third pair developed resistance to 5-flucytosine. The remaining comprised of susceptible and azole resistant isolates. Single nucleotide polymorphisms (SNPs) in genes linked to echinocandin, azole and 5-flucytosine resistance were confirmed in resistant isolates through WGS using the next generation sequencing. Non-synonymous SNPs in antifungal resistance genes such as FKS1, FKS2, CgPDR1, CgCDR1 and FCY2 were identified. Overall, an average of 98% of the WGS reads of C. glabrata isolates mapped to the reference genome with about 75-fold read depth coverage. The turnaround time and cost were comparable to Sanger sequencing.
In conclusion, WGS of C. glabrata was feasible in revealing clinically significant gene mutations involved in resistance to different antifungal drug classes without the need for multiple PCR/DNA sequencing reactions. This represents a positive step towards establishing WGS capability in the clinical laboratory for simultaneous detection of antifungal resistance conferring substitutions.
Candida glabrata is an increasingly encountered pathogen with importance as a species that exhibits resistance to the azoles as well as more recently, to the echinocandins1,2,3. Unlike the diploid C. albicans, the haploid genome of C. glabrata may allow it to acquire mutations and develop multi-drug resistance more easily. Co-resistance to both drug classes has also been reported4. Hence, early evaluation of antifungal susceptibility and detection of drug resistance in C. glabrata is crucial for correct, targeted therapy as well as in the context of antifungal stewardship to limit drivers of antimicrobial resistance1,5,6. Establishing an efficient workflow to rapidly detect the presence of confirmatory mutations linked to resistance biomarkers in resistant isolates will also help to improve prescribing decisions and clinical outcomes.
Antifungal susceptibility is usually assessed by measuring minimum inhibitory concentration (MIC) which is defined as the lowest drug concentration that results in a significant reduction in growth of a microorganism compared with that of a drug-free growth control. The Clinical and Laboratory Standards Institute (CLSI) and European Committee on Antimicrobial Susceptibility Testing (EUCAST) have standardized susceptibility testing methods in order to make MIC determination more accurate and consistent7,8. However, the utility of antifungal MIC remains limited especially for the echinocandins, in particular with regards to inter-laboratory comparisons where varying methodologies and conditions are used9. There is also uncertain correlation of MICs with response to echinocandin treatment and inability to distinguish WT (or susceptible) isolates from those harboring FKS mutations (echinocandin-resistant strains)10,11. Despite the availability of confirmatory single-gene PCRs and Sanger sequencing of antifungal resistance markers, realization of results is often delayed due to lack of simultaneous detection of multiple resistance markers5,12. Hence, concurrent detection of resistance-conferring mutations in different locations in the genome, enabled by whole genome sequencing-based analysis, offers significant advantages over current approaches.
Whole genome sequencing (WGS) has been successfully implemented to track disease transmission during outbreaks as well as an approach for genome-wide risk assessment and drug resistance testing in bacteria and viruses13. Recent advances in nucleic acid sequencing technology have made the whole genome sequencing (WGS) of pathogens in a clinically actionable turn-around-time both technically and economically feasible. DNA sequencing offers important advantages over other methods of pathogen identification and characterization employed in microbiology laboratories14,15,16. First, it provides a universal solution with high throughput, speed and quality. Sequencing can be applied to any of microorganisms and allows economies of scale at local or regional laboratories. Second, it produces data in a 'future-proof' format amenable to comparison at national and international levels. Finally, the potential utility of WGS in medicine has been augmented by the rapid growth of public data bases containing reference genomes, which can be linked to equivalent data bases that contain additional clinical and epidemiological metadata17,18.
Recent studies have demonstrated the utility of WGS for identification of antifungal resistance markers from clinical isolates of Candida spp.10,19,20. This is mostly due to the availability of high-throughput benchtop sequencers, established bioinformatics pipelines and decreasing cost of sequencing21,22. The advantage of fungal WGS over Sanger sequencing is that WGS allows sequencing of multiple genomes on a single run. In addition, WGS of Candida genomes can identify novel mutations in drug targets, track genetic evolution, and emergence of clinically relevant sequence-types20,22,23. Most importantly, in cases of intrinsic multidrug resistance, WGS can assist in early detection of resistance-conferring mutations prior to treatment selection22,24.
Here, we examined the feasibility of WGS-enabled screening for mutations associated with drug resistance to different classes of antifungal agents. We present a methodology for the implementation of WGS from end-user and diagnostic mycology laboratory perspectives. We included in this analysis three isolate pairs cultured from three separate clinical cases in which in vitro resistance to the echinocandins and 5-flucytosine developed over time following antifungal treatment.
No ethical approval was required for this study.
1. Subculture and inoculum preparation for Candida glabrata
2. Determination of Antifungal Susceptibility
3. Genomic DNA extraction for sequencing
4. Genomic DNA quantification
5. DNA Library Preparation
Note: Library preparation and sequencing was performed following manufacturer's protocols and guidelines provided by company (Figure 1A) (see Table of Materials).
6. Library pooling and Initiating Sequencing in Benchtop Sequencer
7. Data Download from Sequencing Website
8. Sequencing Data analysis
Thirteen C. glabrata comprising C. glabrata ATCC 90030 and 12 isolates from the Clinical Mycology Reference laboratory (isolates CMRL1 to CMRL12), Westmead Hospital, Sydney were studied (Table 1). These included three pairs of isolates CMRL-1/CMRL-2, CMRL-3/CMRL-4 and CMRL-5/CMRL-6 obtained before and after antifungal therapy with no epidemiological links between them 24 (Table 1).
The MICs were determined using CLSI interpretative breakpoint for nine antifungal agents namely, Amphotericin (AMB), Anidulafungin (ANI), Micafungin (MIF), Caspofungin (CAS), 5-Flucytosine (5-FC), Posaconazole (POS), Voriconazole (VRC), Itraconazole (ITR) and Fluconazole (FLC). Candida parapsilosis ATCC 22019 and Candida krusei ATCC 6258 were used as quality control strains. Among the isolate pair, CMRL-1 and CMRL-2, the second isolate CMRL-2 was resistant to caspofungin (MIC 8 vs. 0.12 mg/L, Table 1). CMRL-2 also had similar proportional increases in the MICs of anidulafungin and micafungin (≥ 0.5 mg/L) resulting in in vitro resistance to all three echinocandins24. Likewise, isolate CMRL-4 had developed echinocandin resistance than those of isolate CMRL-3 (Table 1). Between the third pair, isolate CMRL-6 had a 5-flucytosine MIC (>64 vs. 0.06 mg/L)24. Both these isolate pairs were susceptible/wild-type (WT) to other antifungal agents tested. Isolate CMRL-6 and CMRL-12 were found to be resistant or non-WT to all azoles. CMRL-7 was resistant to fluconazole and non-WT to voriconazole (Table 1). C. glabrata ATCC 90030 and isolates CMRL-8 to CMRL-11 were susceptible susceptible/WT to all antifungal agents24.
WGS of 13 isolates was performed using the benchtop sequencer. On an average, a mid-output sequencing run, yielded around 27-40 GB data with an error rate between 0.5-1.4%. The average percentage Q30 obtained was usually around 80-85%. The flow-cell cluster density (K/mm2) ranged between 200-250 (Table 4). The raw sequence data from this study have been deposited at NCBI Sequence Read Archive (SRA) under the project number PRJNA310057. 98% of sequencing reads mapped to the C. glabrata reference genome (strain CBS138) through analysis in integrated data analysis software. The average read depth coverage was 75x with average read length of 143-bp. Structural variant detection identified more than 50, 000 SNPs per isolate. Particularly, when analyzing the strain pairs CMRL1/CMRL-2, total SNPs found on each isolate were around 79,000, for CMRL-3/CMRL-4, the total number of SNPs were around 60,000 and for CMRL-5/CMRL-6, more than 56,000 when compared to CBS13824. The SNP difference when compared between isolates in a strain pair was less than 25.
Based on the susceptibility profile of the isolates, known resistance biomarkers were selected for analysis24, particularly, FKS1, FKS2 and FKS3 (echinocandin resistance), FCY1 and FCY2 (5-flucytosine resistance), and ERG9, ERG11, CgCDR1, CgPDR1 and CgFLR1 (azole resistance). The genes were checked for known mutations, and frequency of SNP occurrences. Only non-synonymous SNPs in genes with read depth coverage of ≥20 i.e., high-quality SNPs (hq-SNPs) were specifically studied.
Notably, FKS mutations were identified in the genome of both echinocandin-resistant isolates24. Of the first two pairs, the echinocandin resistant isolates, CMRL-2 harbored a single FKS2 mutation S629P, and CMRL-4, the FKS2 mutation S663P (Table 6). Of the third pair, a SNP in FCY2 (Ala237Thr) was found in both CMRL-5 (5-flucytosine susceptible) and CMRL-6 (resistant) (Table 6). However, SNPs in FCY2 were also found in other phenotypically-WT isolates (CMRL-1, CMRL-2, CMRL-10)24. Isolates CMRL-6 and CMRL-12 were noteworthy for their pan-azole resistant/non-WT character and had SNPs in both CgCDR1 (encoding azole efflux pumps) and CgPDR1 (encoding the transcription factor regulating the efflux pumps) (Table 6)26,27. The presence of mutations in another efflux pump gene, CgFLR1 occurred in both azole-susceptible, and azole-resistant isolates26,28. Investigation for SNPs within the ERG9 (coding squalene synthase) revealed mutations but there were no mutations identified in ERG1124.
WGS analysis also revealed multiple non-synonymous SNPs in Candida cell wall adhesion genes namely, EPA1, EPA6, PWP2 and PWP5. EPA6 mutations were present in 9/12 isolates. SNPs in PWP2 and PWP5 were also present in almost all isolates, except isolates CMRL-1 and CMRL-1124.
Isolate | AMB | ANI | MIF | CAS | 5-FC | POS | VRC | ITR | FLC | Interpretation of antifungal susceptibility | Genes Conferring Resistance Identified by WGS | ||
CMRL-1 | 0.5 | 0.03 | < 0.008 | 0.12 | < 0.06 | 0.5 | 0.12 | 0.25 | 8 | Susceptible to all | – | ||
CMRL-2 | 0.5 | 1 | 1 | 8 | < 0.06 | 0.25 | 0.06 | 0.12 | 4 | Resistant to all echinocandins only | FKS1 | ||
CMRL-3 | 0.25 | 0.015 | 0.015 | 0.12 | < 0.06 | 1 | 0.25 | 0.5 | 8 | Susceptible to all | – | ||
CMRL-4 | 2 | 1 | 1 | > 8 | < 0.06 | 0.5 | 0.12 | 0.25 | 8 | Resistant to all echinocandins only | FKS2 | ||
CMRL-5 | 1 | 0.12 | 0.015 | 0.12 | < 0.06 | 1 | 0.5 | 0.5 | 16 | Susceptible to all | – | ||
CMRL-6 | 1 | 0.06 | 0.015 | 0.06 | > 64 | > 8 | 8 | > 16 | 256 | Resistant to 5-FC and azoles | FCY2, CgPDR1, CgCDR1 | ||
CMRL-7 | 0.25 | 0.06 | 0.015 | 0.25 | < 0.06 | 1 | 8 | 0.5 | 256 | Resistant to all azoles only | CgPDR1, CgCDR1, CgFLR1 | ||
CMRL-8 | 0.5 | 0.03 | 0.008 | 0.06 | < 0.06 | 0.5 | 0.25 | 0.25 | 4 | Susceptible to all | – | ||
CMRL-9 | 1 | 0.03 | 0.015 | 0.25 | < 0.06 | 1 | 0.5 | 1 | 16 | Susceptible to all | – | ||
CMRL-10 | 1 | 0.03 | < 0.008 | 0.5 | < 0.06 | 1 | 0.5 | 0.5 | 16 | Susceptible to all | – | ||
CMRL-11 | 0.5 | 0.03 | < 0.008 | 0.03 | < 0.06 | 0.5 | 0.25 | 0.5 | 8 | Susceptible to all | – | ||
CMRL-12 | 0.5 | 0.03 | 0.015 | 0.06 | < 0.06 | > 8 | 2 | 8 | 128 | Resistant to all azoles only | CgPDR1, CgCDR1, CgFLR1 | ||
ATCC 90030 | 1 | 0.03 | 0.015 | 0.06 | < 0.06 | 1 | 0.5 | 0.5 | 8 | Susceptible to all | – | ||
Abbreviations: MIC, minimum inhibitory concentration; AMB, amphotericin B; ANI, anidulafungin; CAS, caspofungin; FLC, fluconazole; ITR, itraconazole; MIF, micafungin; POS, posaconazole; VRC, voriconazole; 5-FC, 5-flucytosine. |
Table 1. In vitro susceptibility of 13 Candida glabrata isolates including CMRL-1/CMRL-2, CMRL-3/CMRL-4 and CMRL-5/CMRL-6 isolate pairs obtained before and after antifungal therapy
Standards | DNA Standard Volume (μL) | 1X TE buffer | Reagent (μL) | Total in 96-well plate (μL) | Final DNA Concentration (ng/mL) |
Std-Pico 1 | 8 (Standard DNA tube 100 µg/mL) | 1992 | 100 | 200 | 1000 |
Std-Pico 2 | 10 (from Std-Pico 1) | 90 | 100 | 200 | 100 |
Std- Pico 3 | 5 (from Std-Pico 1) | 95 | 100 | 200 | 50 |
Std-Pico 4 | 2 (from Std-Pico 1) | 198 | 100 | 200 | 10 |
Std-Pico 5 | 10 (Std-Pico 4) | 90 | 100 | 200 | 1 |
Blank | – | 100 | 100 | 200 | Blank |
Table 2. Protocol for Preparing Standards for Standard Curve Generation for DNA Quantification
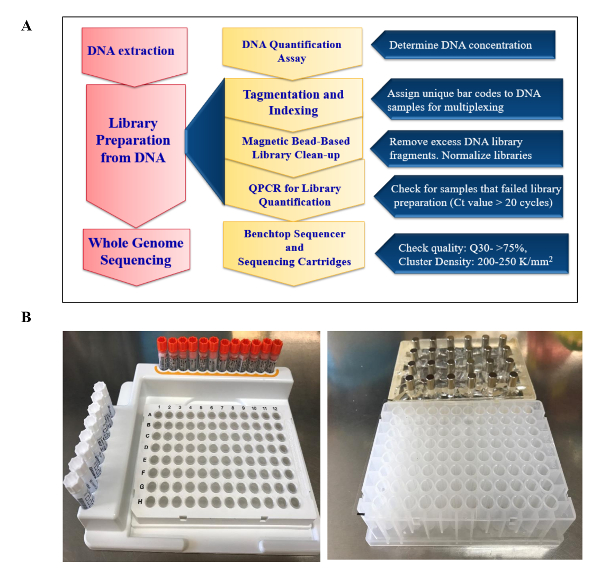
Figure 1. Sequencing Workflow: (A) An outline of major analytical steps for library preparation and sequencing on a benchtop sequencer. (B) Important components for DNA library preparation such as the (left to right) index plate rack for arrangement of indices during indexing and magnetic rack with deep 96-well plate for magnetic bead based clean-up of DNA libraries. Please click here to view a larger version of this figure.
1 | 2 | 3 | 4 | 5 | 6 | 7 | 8 | 9 | 10 | 11 | 12 | ||
Index Set A |
N701 | N702 | N703 | N704 | N705 | N706 | N707 | N710 | N711 | N712 | N714 | N715 | |
A | S502 | Sample 1 | Sample 2 | Sample 3 | Sample 4 | Sample 5 | Sample 6 | Sample 7 | Sample 8 | Sample 9 | Sample 10 | Sample 11 | Sample 12 |
B | S503 | Sample 13 | Sample 14 | Sample 15 | Sample 16 | Sample 17 | Sample 18 | Sample 19 | Sample 20 | Sample 21 | Sample 22 | Sample 23 | Sample 24 |
C | S505 | Sample 25 | Sample 26 | Sample 27 | Sample 28 | Sample 29 | Sample 30 | Sample 31 | Sample 32 | Sample 33 | Sample 34 | Sample 35 | Sample 36 |
D | S506 | Sample 37 | Sample 38 | Sample 39 | Sample 40 | Sample 41 | Sample 42 | Sample 43 | Sample 44 | Sample 45 | Sample 46 | Sample 47 | Sample 48 |
E | S507 | Sample 49 | Sample 50 | Sample 51 | Sample 52 | Sample 53 | Sample 54 | Sample 55 | Sample 56 | Sample 57 | Sample 58 | Sample 59 | Sample 60 |
F | S508 | Sample 61 | Sample 62 | Sample 63 | Sample 64 | Sample 65 | Sample 66 | Sample 67 | Sample 68 | Sample 69 | Sample 70 | Sample 71 | Sample 72 |
G | S510 | Sample 73 | Sample 74 | Sample 75 | Sample 76 | Sample 77 | Sample 78 | Sample 79 | Sample 80 | Sample 81 | Sample 82 | Sample 83 | Sample 84 |
H | S511 | Sample 85 | Sample 86 | Sample 87 | Sample 88 | Sample 89 | Sample 90 | Sample 91 | Sample 92 | Sample 93 | Sample 94 | Sample 95 | Sample 96 |
1 | 2 | 3 | 4 | 5 | 6 | 7 | 8 | 9 | 10 | 11 | 12 | ||
Index Set B | N716 | N718 | N719 | N720 | N721 | N722 | N723 | N724 | N726 | N727 | N728 | N729 | |
A | S502 | Sample 1 | Sample 2 | Sample 3 | Sample 4 | Sample 5 | Sample 6 | Sample 7 | Sample 8 | Sample 9 | Sample 10 | Sample 11 | Sample 12 |
B | S503 | Sample 13 | Sample 14 | Sample 15 | Sample 16 | Sample 17 | Sample 18 | Sample 19 | Sample 20 | Sample 21 | Sample 22 | Sample 23 | Sample 24 |
C | S505 | Sample 25 | Sample 26 | Sample 27 | Sample 28 | Sample 29 | Sample 30 | Sample 31 | Sample 32 | Sample 33 | Sample 34 | Sample 35 | Sample 36 |
D | S506 | Sample 37 | Sample 38 | Sample 39 | Sample 40 | Sample 41 | Sample 42 | Sample 43 | Sample 44 | Sample 45 | Sample 46 | Sample 47 | Sample 48 |
E | S507 | Sample 49 | Sample 50 | Sample 51 | Sample 52 | Sample 53 | Sample 54 | Sample 55 | Sample 56 | Sample 57 | Sample 58 | Sample 59 | Sample 60 |
F | S508 | Sample 61 | Sample 62 | Sample 63 | Sample 64 | Sample 65 | Sample 66 | Sample 67 | Sample 68 | Sample 69 | Sample 70 | Sample 71 | Sample 72 |
G | S510 | Sample 73 | Sample 74 | Sample 75 | Sample 76 | Sample 77 | Sample 78 | Sample 79 | Sample 80 | Sample 81 | Sample 82 | Sample 83 | Sample 84 |
H | S511 | Sample 85 | Sample 86 | Sample 87 | Sample 88 | Sample 89 | Sample 90 | Sample 91 | Sample 92 | Sample 93 | Sample 94 | Sample 95 | Sample 96 |
1 | 2 | 3 | 4 | 5 | 6 | 7 | 8 | 9 | 10 | 11 | 12 | ||
Index Set C | N701 | N702 | N703 | N704 | N705 | N706 | N707 | N710 | N711 | N712 | N714 | N715 | |
A | S513 | Sample 1 | Sample 2 | Sample 3 | Sample 4 | Sample 5 | Sample 6 | Sample 7 | Sample 8 | Sample 9 | Sample 10 | Sample 11 | Sample 12 |
B | S515 | Sample 13 | Sample 14 | Sample 15 | Sample 16 | Sample 17 | Sample 18 | Sample 19 | Sample 20 | Sample 21 | Sample 22 | Sample 23 | Sample 24 |
C | S516 | Sample 25 | Sample 26 | Sample 27 | Sample 28 | Sample 29 | Sample 30 | Sample 31 | Sample 32 | Sample 33 | Sample 34 | Sample 35 | Sample 36 |
D | S517 | Sample 37 | Sample 38 | Sample 39 | Sample 40 | Sample 41 | Sample 42 | Sample 43 | Sample 44 | Sample 45 | Sample 46 | Sample 47 | Sample 48 |
E | S518 | Sample 49 | Sample 50 | Sample 51 | Sample 52 | Sample 53 | Sample 54 | Sample 55 | Sample 56 | Sample 57 | Sample 58 | Sample 59 | Sample 60 |
F | S520 | Sample 61 | Sample 62 | Sample 63 | Sample 64 | Sample 65 | Sample 66 | Sample 67 | Sample 68 | Sample 69 | Sample 70 | Sample 71 | Sample 72 |
G | S521 | Sample 73 | Sample 74 | Sample 75 | Sample 76 | Sample 77 | Sample 78 | Sample 79 | Sample 80 | Sample 81 | Sample 82 | Sample 83 | Sample 84 |
H | S522 | Sample 85 | Sample 86 | Sample 87 | Sample 88 | Sample 89 | Sample 90 | Sample 91 | Sample 92 | Sample 93 | Sample 94 | Sample 95 | Sample 96 |
1 | 2 | 3 | 4 | 5 | 6 | 7 | 8 | 9 | 10 | 11 | 12 | ||
Index Set D | N716 | N718 | N719 | N720 | N721 | N722 | N723 | N724 | N726 | N727 | N728 | N729 | |
A | S513 | Sample 1 | Sample 2 | Sample 3 | Sample 4 | Sample 5 | Sample 6 | Sample 7 | Sample 8 | Sample 9 | Sample 10 | Sample 11 | Sample 12 |
B | S515 | Sample 13 | Sample 14 | Sample 15 | Sample 16 | Sample 17 | Sample 18 | Sample 19 | Sample 20 | Sample 21 | Sample 22 | Sample 23 | Sample 24 |
C | S516 | Sample 25 | Sample 26 | Sample 27 | Sample 28 | Sample 29 | Sample 30 | Sample 31 | Sample 32 | Sample 33 | Sample 34 | Sample 35 | Sample 36 |
D | S517 | Sample 37 | Sample 38 | Sample 39 | Sample 40 | Sample 41 | Sample 42 | Sample 43 | Sample 44 | Sample 45 | Sample 46 | Sample 47 | Sample 48 |
E | S518 | Sample 49 | Sample 50 | Sample 51 | Sample 52 | Sample 53 | Sample 54 | Sample 55 | Sample 56 | Sample 57 | Sample 58 | Sample 59 | Sample 60 |
F | S520 | Sample 61 | Sample 62 | Sample 63 | Sample 64 | Sample 65 | Sample 66 | Sample 67 | Sample 68 | Sample 69 | Sample 70 | Sample 71 | Sample 72 |
G | S521 | Sample 73 | Sample 74 | Sample 75 | Sample 76 | Sample 77 | Sample 78 | Sample 79 | Sample 80 | Sample 81 | Sample 82 | Sample 83 | Sample 84 |
H | S522 | Sample 85 | Sample 86 | Sample 87 | Sample 88 | Sample 89 | Sample 90 | Sample 91 | Sample 92 | Sample 93 | Sample 94 | Sample 95 | Sample 96 |
Table 3. Template of Different Index Arrangement
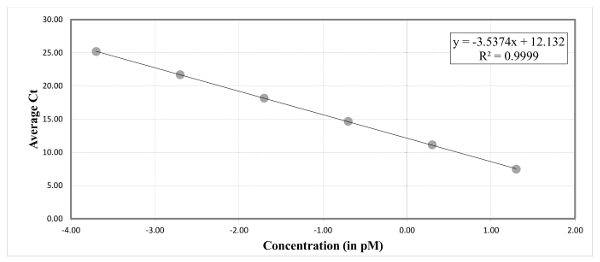
Figure 2: A standard graph generated with the Ct values of standards. Use the standard curve intercept and slope values to determine the average library concentration from Ct value of sample libraries in duplicates. Please click here to view a larger version of this figure.
Metrics | Standard Values | Values Obtained (Average) |
Yield | 32.5-50 Gb for mid-output | 42 Gb for mid-output |
100-130 Gb for high-output | 120 Gb for high-output | |
Percentage Q30 | ≥ 75% | 80% |
Cluster Density | 170-230 K/mm2, Optimal at 200 K/mm2 | 210 K/mm2. |
Clusters Passing Filters | > 70% | 89.09% |
Intensity by Cycle | Above 1000 for each tile in flowcell | Above 1500 for each tile in flowcell |
Error Rate | Below 1.5 | 1.4 |
Table 4. Metrics for a standard sequencing run in Benchtop Sequencer
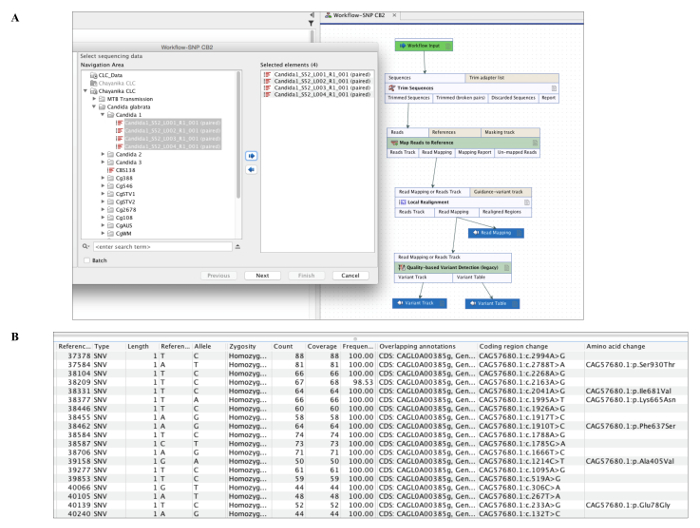
Figure 3: Sequencing Data Analysis Software. (A) Create a desired workflow including sequence trimming, mapping to reference and quality based variant detection. Run workflow by selecting sample FASTQ files (individual or multiple samples in batch). (B) List of structural variants showing reference position, coverage, nucleotide change and amino acid change obtained for analysis of sample sequences. Please click here to view a larger version of this figure.
1. Trim sequences | Setting Used |
Trim Bases | Default settings |
Filter on length with maximum number of nucleotide in reads | 1000 |
Filter on length with minimum number of nucleotide in reads | 50 |
2. Mapping Reads to reference | |
Reference selected | CBS138 |
Reference masking with masking mode | No masking |
Mapping Options | Default settings |
3. Local Realignment | |
Alignment settings | Default settings |
4. Quality Based Variant Detection | |
Neighbourhood radius | 5 |
Minimum gap and mismatch count | 2 |
Minimum neighbourhood quality | 15 |
Minimum central quality | 20 |
Read filters | Default settings |
Minimum coverage | 4 |
Minimum variant frequency (%) | 75 |
Variant filters | Default settings |
Maximum expected alleles (Ploidy) | 2 |
Genetic code | Standard |
Table 5. Workflow Parameters and Settings on the Software
Structural Variant Nucleotide Position | Gene | Drug(s) | Found in Number of Isolates |
Resistant Isolates | Susceptible Isolates | |
SNP_Cg_95352_S629P_fks1 | CgFKS1 | CAS, ANI, MIF | 1 | CMRL-2 | – | |
SNP_Cg_375361_S633P_fk2 | CgFKS2 | CAS, ANI, MIF | 1 | CMRL-4 | – | |
SNP_Cg_285870_A237T_fcy2 | CgFCY2 | 5-FC | 2 | CMRL-6 | CMRL-5 | |
SNP_Cg_286311_I384F_fcy2 | CgFCY2 | 5-FC | 2 | 0 | CMRL-1, CMRL-2 | |
SNP_Cg_720995_C128F_erg9 | CgERG9 | FLC, POS, VRC, ITR | 3 | CMRL-6 | CMRL-5, CMRL-10 | |
SNP_Cg_48683_R376Q_pdr1 | CgPDR1 | FLC, POS, VRC, ITR | 1 | CMRL-6 | – | |
SNP_Cg_50384_G250N_pdr1 | CgPDR1 | FLC, POS, VRC, ITR | 1 | CMRL-7 | – | |
SNP_Cg_49640_P695L_pdr1 | CgPDR1 | FLC, POS, VRC, ITR | 1 | 0 | CMRL-11 | |
SNP_Cg_49858_N768D_pdr1 | CgPDR1 | FLC, POS, VRC, ITR | 1 | CMRL-12 | – | |
SNP_Cg_203787_H58Y_cdr1 | CgCDR1 | FLC, POS, VRC, ITR | 5 | CMRL-6, CMRL-12 | CMRL-5, CMRL-10, CMRL-11 | |
SNP_Cg_205529_M638I_cdr1 | CgCDR1 | FLC, POS, VRC, ITR | 1 | CMRL-7 | – | |
SNP_Cg_206938_N1108S_cdr1 | CgCDR1 | FLC, POS, VRC, ITR | 1 | CMRL-7 | – | |
SNP_Cg_589884_I116V_flr1 | CgFLR1 | FLC, POS, VRC, ITR | 4 | CMRL-7 | CMRL-1, CMRL-2, CMRL-9 | |
SNP_Cg_589470_V254I_flr1 | CgFLR1 | FLC, POS, VRC, ITR | 1 | CMRL-12 | – |
Table 6. Report of structural variant position in genes linked to antifungal drug resistance found in the number of isolates of C. glabrata
This study determined feasibility, approximate timelines and precision of WGS-guided detection of drug resistance in C. glabrata. The turnaround time (TAT) for the library preparation and sequencing was four days and reporting of analyzed results one-two days. This compares with at least a similar amount TAT for susceptibility assays from culture plates and Sanger sequencing with significantly higher number of samples. Around 30-90 C. glabrata genomes can be sequenced based on sequencing flow-cell capacity, with 80-100% sequencing coverage. Since the sequencing was performed on an in-house WGS laboratory setup, the costs/resource requirements in this study was equivalent to current costs of Sanger sequencing and probe-based assays with an estimated cost of AUD 80-100 per sample. Susceptibility of all isolates were determined by a commercial assay kit that were read visually using a reading mirror. Culture growth was indicated by change in colorimetric growth indicator from blue to pink. MIC was read as the first blue well after a series of pink (growth) wells i.e., the lowest concentration of the antifungal agent that substantially inhibits growth. For WGS, genomic DNA libraries were prepared using the library preparation kit. The isolate libraries were quantified by qPCR. The quantified libraries were pooled together for the final sequencing run performed in the benchtop sequencer.
In our analysis, the presence of SNPs in genes conferring resistance in isolates correlated well with the elevated in vitro MIC against the drugs. The mutationsS629P in FKS1 and S663P in FKS2 identified were clearly associated with resistance to echinocandins. Both mutations are well-known to confer phenotypic resistance29,30. Simultaneous genome-wide sequencing also revealed mutations in genes linked to 5-flucytosine (gene FCY2) and azole resistance (CgPDR1, CgCDR1 and CgFLR1) that are associated with resistance through activation/overexpression as efflux pumps26,27,28. However, the effects of mutations in genes linked to azole and 5-flucytosine resistance31 needs to be confirmed by additional functional analyzes to assess the gene expression level. Interestingly, large number of SNPs were also found in cell wall adhesins in all isolates32,33. Mutations in adhesion gene EPA6, which encodes biofilm formation, occurred relatively frequently33. Additionally, isolates CMRL-3, CMRL-4 and CMRL-8 that lacked mutations in azole resistance genes had no documented SNPs in EPA1 and EPA624,34. However, overall, no specific association between the SNPs in adhesins and drug MICs could be found due to the low number of test isolates included.
The implementation of WGS in clinical mycology requires the implementation of robust quality management system. High quality genomic DNA and quality control checkpoints that accompany each step in the experiment is essential for a good WGS outcome. The purity of C. glabrata sample DNA submitted for library preparation can be validated using UV absorbance method (absorbance at 260/280 nm and 260/230 nm25. In our experience, for C. glabrata DNA the 260/280 is expected to be within the recommended range of 1.8-2 and for 260/230 between 2-2.2. If DNA extracts do not meet these quality requirements, additional purification by ethanol precipitation can be performed. Tagmentation is an essential step of adding unique bar code sequences called index primers so as enable differentiation of multiple sample during sequencing (multiplexing). Hence, in the indexing process, extra caution must be taken to avoid cross-contamination between index tubes and samples in order to maintain uniqueness of the indices. Normalization in sequencing ensures that any differences arising in the sample DNA libraries that might introduce bias in sequencing data is eliminated. A normalization step using a bead based clean-up usually allows removal of excess DNA library fragments and variations in library size that may arise during library preparation. Therefore the 30 min incubation is critical for optimal cluster density. Cluster density which is the density of the clonal clusters of sample libraries generated by massive amplification during sequencing influences data quality like Q30 scores and total data output. While underclustering might give high data quality, it will also result in lower data output whereas overclustering low Q30 scores. The DNA libraries should be free of magnetic bead residue during PCR cleanup and normalization as that can interfere with sequencing data quality. QPCR should be performed on at least a few representative sample libraries including a reference strain as a positive control (the ATCC strain of C. glabrata in this case) from a particular set of indices. The average Ct values should be between 15 – 18 cycles. Any sample within this range is considered acceptable for the sequencing run. However, if the Ct values are outside this range the qPCR should be repeated. Samples can sometimes fail qPCR either due to low quality input DNA or error during library preparation. Based on calculations from the positive control, the minimum concentration of the libraries that will produce good sequence data should be established. Using the average concentration of the libraries obtained from qPCR, the volume of final library to be added for sequencing can be calculated. This should produce the recommended final library concentration between 1.4-1.8 pM. For C. glabrata libraries, the established Ct range using the C. glabrata ATCC isolate was between 16-18 cycles with an average library concentration range of 300-500 pM. The corresponding volume of pooled denatured DNA libraries was within the range of 60-65 µL for a cluster density range between 200-250 K/mm2.
The sequence data files should be demultiplexed before further analysis. This can be achieved by sorting into their respective libraries using their bar codes after sequencing has taken place. An optional step of quality trimming of the FASTQ files can be performed prior to data analysis. The sequence reads of the isolates from WGS were analyzed using a custom workflow created in a standard software package. This allowed trimming of low-quality reads and then mapping to the reference Candida genome. The reference genome, CBS138, was downloaded from Candida Genome Database (CGD) and linked to the workflow prior to analysis. The presence of DNA repeats in the Candida genome (for example, adhesin genes have DNA repeats) may complicate the alignment of short-read sequences and the SNP calling. This can be improved by the additional local realignment of mapped sequences. The output from the workflow was a structural variants list that provided annotated genes with non-synonymous and synonymous SNP positions and coverage. This was used to identify SNPs in genes of interest and prepare the final analysis report for the isolates (Table 6).
Some limitations of our study and approach should be acknowledged. Our report is based on small number of isolates and there is no standard fungal resistome database for clinical mycology. Although Sanger DNA sequencing is currently more accessible to clinical laboratories, it has limited ability to simultaneously detect multiple gene mutations that confer drug resistance in Candida spp. (>20 FKS mutations for echinocandin resistance alone). With consolidation of pathology services and decreasing sequencing costs, the practicality of using WGS over Sanger sequencing, is likely to increase. However, an important consideration is the initial laboratory setup and cost of WGS instrument implementation as well as end-user training of laboratory personnel. Long term costs would essentially include, procuring sequencing reagent kits, and accessories. Additional cost and a higher TAT should be expected if the WGS instrument is not in-house. Furthermore, the presence of DNA repeat sequences in genomes may complicate the alignment of short-read sequences and the SNP calling. The availability of high-quality reference genomes sequenced using long-read technologies will help to sustain the quality of SNP identification.
In future, WGS is expected to bring improvements in clinical therapy by fast-tracking reporting time in diagnostic settings that is easily accessible and interpreted by clinicians20,22. This can be achieved with development of curated and up-to-date WGS antifungal drug resistance databases of novel and confirmatory mutations to infer antifungal resistance. As more genomes of clinically relevant yeasts of known phenotypic drug susceptibility become available for analysis, novel markers and mechanisms of antifungal drug resistance are likely to be discovered. These developments will substantially reduce risks of treatment failures due to multi drug resistance and drug toxicity. In conclusion, the next generation sequencing with appropriate quality management protocols enables genome-wide detection of mutations conferring resistance in Candida glabrata which can augment phenotypic testing in mycology laboratories. The insights provided by rapid genome sequencing of clinically relevant Candida spp can fundamentally change our understanding of mechanisms of resistance to different classes of antifungal agents and improve the management of patients with invasive fungal diseases.
The authors have nothing to disclose.
This work was supported by the Centre for Infectious Diseases and Microbiology, Public Health. The authors have not received any other funding for this study. The authors thank Drs Alicia Arnott, Nathan Bachmann and Ranjeeta Menon for their expert advice and assistance with the whole genome sequencing experiment.
DensiCHECK Plus | BioMérieux Inc | K083536 | Densitometer used for McFarland readings |
Sensititre YeastOne | TREK Diagnostic Systems, Thermo Scientific | YO10 | Commercial susceptibility assay plate with standard antifungal drugs. |
Fisherbrand Disposable Inoculating Loops and Needles | Fisher Scientific, Thermo Fisher Scientific | 22-363-605 | Disposable plastic loops can be used directly from package. No flaming required. |
Eppendorf Safe-Lock microcentrifuge tubes | Sigma Aldrich, Merck | T2795 | Volume 2.0 mL, natural |
ZYMOLYASE 20T from Arthrobacter luteus | MP Biomedicals, LLC | 8320921 | Used for cell wall lysis of fungal isolate before DNA extraction |
Wizard Genomic DNA Purification Kit | Promega | A1120 | Does 100 DNA extractions |
Quant-iT PicoGreen dsDNA Assay Kit | Thermo Fisher Scientific | P7589 | Picogreen reagent referred to as fluorescent dye in the protocol. Includes Lambda DNA standard and picogreen reagent for assay. |
Nextera XT DNA Sample Preparation Kit | Illumina | FC-131-1096 | Includes Box 1 and Box 2 reagents for 96 samples |
Nextera XT Index Kit v2 | Illumina | FC-131-2001, FC-131-2002, FC-131-2003, FC-131-2004 |
Index set A Index set B Index set C Index set D |
NextSeq 500/550 High Output Kit v2 | Illumina | FC-404-2004 | 300 cycles, More than 250 samples per kit |
NextSeq 500 Mid Output v2 Kit | Illumina | FC-404-2003 | 300 cycles, More than 130 samples per kit |
PhiX Control Kit | Illumina | FC-110-3001 | To arrange indices from Index kit in order |
TruSeq Index Plate Fixture Kit | FC-130-1005 | 2 Fixtures | |
KAPA Library Quantification Kit for Next-Generation Sequencing |
KAPA Biosystems | KK4824 | Includes premade standards, primers and MasterMix |
Janus NGS Express Liquid handling system | PerkinElmer | YJS4NGS | Used for DNA dilutions during sequencing |
0.8 mL Storage Plate | Thermo Scientific | AB0765B | MIDI Plate for DNA Library cleanup and normalisation |
Agencourt AMPure XP | Beckman Coulter | A63881 | Magnetic beads in solution for library purification |
Magnetic Stand-96 | Thermo Fisher Scientific | AM10027 | Used for magnetic bead based DNA purification |
OrbiShaker MP | Benchmark Scientific | BT1502 | 96-well plate shaker with 4 platforms |
Hard Shell PCR Plate | BioRad | HSP9601 | Thin Wall, 96 Well |
LightCycler 480 Instrument II | Roche | 5015278001 | Accomodates 96 well plate |
Microseal 'B' PCR Plate Sealing Film, adhesive, optical | BioRad | MSB1001 | Clear 96-well plate sealers |
CLC Genomics Workbench | Qiagen | CLCBio | Software for data analysis, Version 8 |
NextSeq500 instrument | Illumina | Illumina | Benchtop Sequencer used for next generation sequencing |