The 'Boden Food Plate' is an electronic food diary designed to be an interactive and fun method to collect dietary intake using visual depictions. The purpose of this study was to validate the web-based application against a traditional three-day estimated food diary method.
Different methods can be used in research to assess dietary intake, many of which are still paper-based. Written estimated food diaries are often utilized in clinical trials, despite being a burden for both study participants and researchers. This method requires participant literacy, it is time consuming, labor intensive, and can easily lead to under-reporting. With advancements in technology, there is a growing interest in electronic diaries that automate the dietary assessment process. These are focused on improving accuracy, reducing both time and cost and providing users with a visual and more enjoyable experience. The methodology presented here aimed to validate the 'Boden Food Plate', a novel web-based platform for self-recording of food and drink items, compared to a traditional estimated food diary. The application was also rated on a satisfaction scale by study participants using a paper-based questionnaire. Sixty-seven participants completed the dietary measures on both the three-day electronic and paper food diaries. For the analysis, only dietary data completed at both study time points (baseline and week six) was utilized. Despite small mean differences between dietary data collection methods, Bland Altman analysis showed fairly wide 95% limits of agreement between the electronic platform and the written estimated food diary and there were few cases which did not fall within the 95% confidence intervals. Overall, participants found the electronic food diary to be more fun than the paper method and as easy to use as hard copy diaries. The new platform has potential as a self-recording tool for the collection of dietary data, particularly when utilized in clinical trial settings. However, further validation studies are needed to improve the validity of this novel electronic dietary data collection tool.
The ability to accurately collect dietary data and assess diet is an essential component of nutrition and weight management research. Many methods to assess dietary intake, both retrospective and prospective, have already been established. However, these commonly used tools come with their own limitations. Hereby, there is a need for a new technological platform that can improve the accuracy of the data and reduce the burden for both researchers and participants1,2,3.
Twenty-four hour recalls (24 h recalls) and Food Frequency Questionnaires (FFQs) are dietary data collection methods that rely on the participants' memory and suffer from potential recall bias and misreporting1,2,4. Written food records, such as FFQs and food diaries, require literacy and can place a high burden on the participants. Additionally, written records where food and drink items are reported at the time of consumption can lead to alterations in the habitual dietary intakes5. These traditional methods of nutritional data collection and coding can also be extremely time consuming and require highly trained personnel1. Seven-day weighed food diaries are considered the non-biomarker gold standard for dietary intake assessments. However, this method has been shown to increase the rate of under-reporting over a seven-day period due to a high participant burden6. Hence, a three-day estimated food diary using traditional household measures to quantify food and drink amounts is sought to be more feasible than seven-day written food records.
Previous studies have shown that collecting dietary intake using electronic tools is valid and efficient compared to traditional methods7,8. For this reason, there is an increased interest in technologies that can assist in the recording and analysis of dietary data. Despite the limitations of being costly and of requiring computer literacy from the participants9, electronic dietary assessment methods add the benefit of being more visual compared to traditional dietary collection tools. Hence, they are well received and found enjoyable by the users10. Additionally, electronic tools can significantly reduce researchers' time and the costs associated with collecting and analyzing data8,11. Furthermore, they provide participants with immediate feedback allowing for self-monitoring of nutritional intakes and higher compliance to personal goals12,13.
The here presented protocol was developed to test the functions and practicality of the 'Boden Food Plate', a web-based electronic food diary, as well as its agreement with a traditional three-day estimated food diary method. This platform allows users to record food and drink items consumed throughout the day on virtual plates in the form of visual depictions, which are one of the strengths of the application. Foods and drinks are selected from an embedded database which contains approximately 1,200 items with fixed serving sizes. The dietary data entered in the electronic food diary is automatically analyzed and researchers can export the results. Additionally, the application generates graphs illustrating the adequacy or non-adequacy of the diet for total energy and some important nutrients which can be accessed by both researchers and users. Compared to other currently available nutritional platforms, this newly created electronic diary is innovative and practical to use. Therefore, it can be a useful dietary data collection tool to be used in future studies.
The present paper describes in detail the entire protocol for dietary data collection utilizing both electronic and paper-based food diaries and presents some results that are published in full in Fuller et al.14
NOTE: All experimental procedures described below were approved by the Sydney Local Health District (Royal Prince Alfred Zone) Ethics Review Committee.
1. Participant Recruitment
2. Preparing Participants for Dietary Data Collection
3. Written Food Diary
NOTE: Food intake was self-reported and collected by utilizing both the traditional written paper diary method and the electronic web-based platform ('Boden Food Plate') over the same three-day period.
4. Electronic Food Diary ('Boden Food Plate')
5. Analysis of the Dietary Data
6. Analysis of the Questionnaires
Out of the 76 participants recruited, only 67 self-recorded their food intake for three days on both the electronic and paper-based food diary at both time periods (baseline and week six). Only the dietary data from these 67 subjects was utilized for the nutritional analysis. The 9 participants excluded from this study did not complete food intake records from the required time points.
Table 1 shows no significant differences in mean energy and macronutrient intake between the written and electronic food diary. However, the 95% limits of agreement are fairly wide, particularly for energy intake, and some cases can be observed lying outside the 95% confidence intervals of the Bland Altman plots (Figure 8A-D).
The Pearson product-moment correlation coefficient was high for energy (0.878), protein (0.642), fat (0.682) and carbohydrate (0.792). This does not suggest good agreement despite a strong correlation between the two data collection methods15,16.
Out of the 67 participants whose dietary data was used for the nutritional analysis, 65 completed the feedback questionnaire. All questionnaire items had mean scores over 5 (neutral score), indicating that 'Boden Food Plate' was well accepted by participants and enjoyable to use. Participants indicated they were particularly satisfied with the 'visibility of the items on the screen', giving this item the highest score (mean score of 7.4). 'Fun compared to the paper food diary' and 'ease of use' had an equal second highest rating (mean score of 6.9). 'Search function' and 'range of food and drink items' were rated the lowest (mean scores of 6.1 and 6.3, respectively).
Figure 1: 'Example day' of the written food diary. Write the date (day of the week, day, month and year) corresponding to each day of dietary data recording on the top of the page. Always start a new day on a new page. Write the time and place of the meals consumed during the day under 'Time & place'. Record all foods and drinks and their amounts under 'Food description & amount'. Please click here to view a larger version of this figure.
Figure 2: Registration page. Fill in all fields marked with an asterisk. Please click here to view a larger version of this figure.
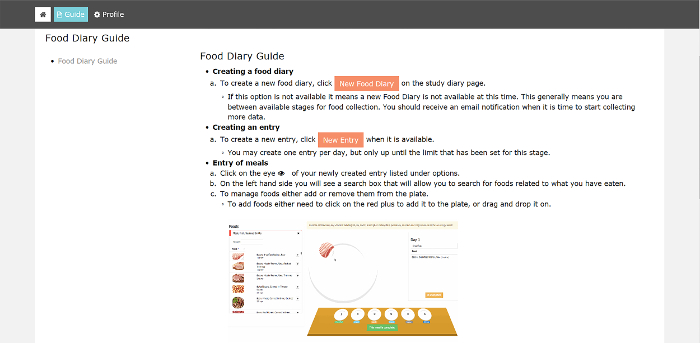
Figure 3: Visual instruction guide. Access the instruction guide by selecting 'Guide' from the top left corner of the homepage ('Dashboard'). Please click here to view a larger version of this figure.
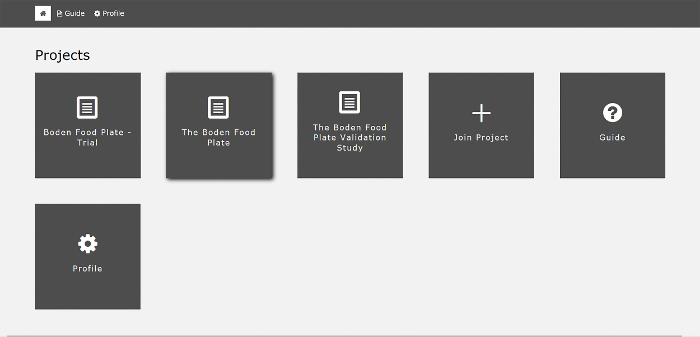
Figure 4: Selection of the study project. Select the icon corresponding to the study project from the homepage ('Dashboard') to access the electronic food diary. Please click here to view a larger version of this figure.
Figure 5: New electronic food diary entry. Select 'Make a new entry' to start recording a new day in the electronic food diary. Select the 'Graph' icon next to each completed entry to visualize the graphs that represent your dietary intakes. Please click here to view a larger version of this figure.
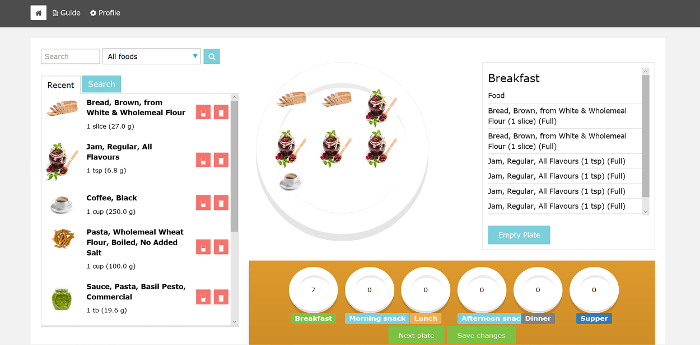
Figure 6: Entering food and drink items in the electronic food diary. Select one of the 6 small plates at the bottom of the screen. These represent the meals of the day (i.e., breakfast, morning snack, lunch, afternoon snack, dinner and supper). The selected small plate starts to bounce indicating that the large plate in the middle of the screen represents that meal. Use the 'Search' bar to find the desired food or drink item. A list of potential items with their visual depictions and serving sizes appears. Select the desired food or drink items in the appropriate serving size and virtually drag them on the large plate. The items appear on the plate and can be removed by simply dragging them out of the plate. Review the foods and beverages selected from the list on the right side of the large plate. Once all meals are recorded, select the 'Save changes' button to save the entries and exit the electronic food diary page. Please click here to view a larger version of this figure.
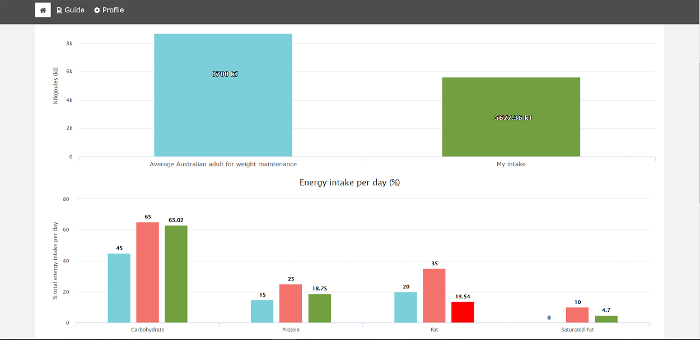
Figure 7: Examples of bar graphs comparing the user's dietary intakes with the average population intakes. The user's nutrient intakes are compared to the population average. The green bars represent an adequate intake of the nutrient. The red bars represent an inadequate intake of the nutrient. Please click here to view a larger version of this figure.
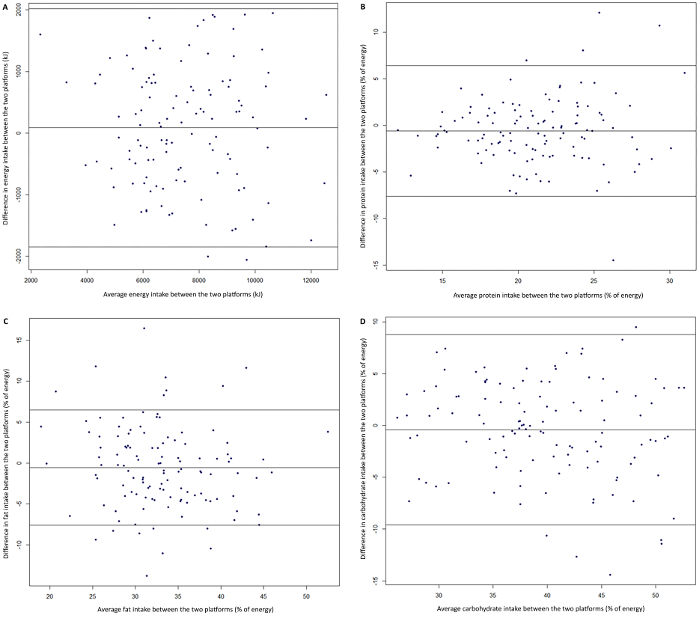
Figure 8: Bland Altman plots for the mean values for energy and macronutrient intake (x-axis) against the difference between the electronic and paper food diaries (y-axis). The Bland Altman plots for total energy intake in kilojoules (A), as well as protein (B), fat (C) and carbohydrate (D) as a percentage of total energy show that the 95% limits of agreement between the two methods of dietary data collection are fairly wide, particularly for total energy intake (A). In all plots, some cases do not lie within the 95% confidence intervals. Figure modified from Fuller et al.14 Please click here to view a larger version of this figure.
Nutrient | Written food diary | Electronic food diary ('Boden Food Plate') | Mean differencea | (95% confidence interval) | ||
Mean | Standard deviation | Mean | Standard deviation | |||
Energy (kJ) | 7541.01 | 1966.32 | 7451.7 | 2023.84 | 86.38 | (-1848.49, 2019.26) |
Protein (g) | 91.48 | 27.48 | 94.49 | 27.82 | -3.01 | (-43.74, 37.72) |
%kJ from protein | 20.91 | 4.35 | 21.51 | 4.12 | -0.6 | (-7.63, 6.43) |
Fat (g) | 66.99 | 21.79 | 67.3 | 23.21 | -0.31 | (-30.43, 29.80) |
%kJ from fat | 32.71 | 6.07 | 33.26 | 6.64 | -0.55 | (-7.58, 6.48) |
Carbohydrate (g) | 185.87 | 58.22 | 178.2 | 60.43 | 7.66 | (-46.34, 61.66) |
%kJ from carbohydrate | 39.47 | 6.87 | 39.87 | 7.54 | -0.41 | (-9.59, 8.77) |
a Mean difference between the written food diary and the electronic food diary. Percentage differences were obtained by subtracting the values calculated for the written food diary from the electronic food diary. |
Table 1: Comparison of mean values of each nutrient between paper diary and electronic food diary and 95% confidence interval (n=67). The mean values indicate no significant differences between the paper diary and the electronic food diary. However, the 95% confidence intervals are fairly wide, particularly for total energy intake. Table modified from Fuller et al.14
The web-based food diary utilized for this study, the 'Boden Food Plate', is a newly developed method for the collection of dietary information, designed to provide research groups with faster access to data. The results demonstrate that the energy and macronutrient intake data collected on the electronic method were accurate when compared to the dietary data recorded on the written estimated food diary, which is considered the gold standard for this study. The visual electronic tool has also proven to be easier and more enjoyable to use than its paper counterpart.
Electronic food diaries have been proven to be valid in collecting dietary intake. Representing each macronutrient as a percentage of total energy intake provides a more accurate insight, as it takes into consideration the large variation in energy intake across a population. Previous studies also showed that there is a correlation between traditional methods (24-h recalls and food diaries) and electronic food diaries17. Similarly, in the current study, Pearson's product-moment correlations showed strong correlations between electronic and paper food diary. However, the limits of agreement of the electronic method when compared to the paper diary were fairly wide. This suggests that further improvement and validation of the electronic tool are required14.
Participants scored all items of the feedback questionnaire above average, demonstrating that they were satisfied with the web-based application. They found the electronic food diary easier and more enjoyable to use than the paper food diary. This is likely due to the electronic platform being a visual method of recording dietary intake which encourages users to engage with the interactive functions of the application. As an additional function, 'pop-up' healthy food suggestions appear intermittently during the completion of the electronic food diary as a reminder for the user. Healthy food suggestions focus on swapping specific food items with healthier options, for example, foods high in saturated fat with those high in polyunsaturated or monounsaturated fat, and foods with a high glycemic index with those lower in glycemic index. In a previous review on mobile phone tools, electronic food diaries have also been reported to provide greater satisfaction, particularly in the form of mobile applications, when compared to paper diaries17. A trial using a mobile food diary tool, 'My Meal Mate', showed a greater user compliance and ease of use, as participants found recording dietary intake on a mobile phone more comfortable in public settings10,18.
In addition to greater user satisfaction, when compared to paper food diaries, the electronic platform provided researchers with a faster access to the dietary data as this was entered directly by the participants into the application. For this reason, valid and reliable electronic tools should be utilized by research groups to decrease time and costs associated with the data entry and analysis of written diaries19.
The most critical steps in the described protocol are the participants self-recording of dietary items in the electronic food diary and the appropriate use of the fixed serving sizes. Participants could incur the mistake of not recording foods and beverages that are difficult to find or unavailable in the electronic database. Additionally, users could record portion sizes incorrectly by just selecting the pre-determined portion sizes, which do not necessarily represent the actual portions consumed. This source of error was also seen in 'My Meal Mate'10. However, it can be argued that the pre-determined serving sizes have the potential to minimize participant's burden and increase user's experience of the web-based platform. It is important to provide participants with an adequate face-to-face training in how to utilize an electronic platform and to encourage them to contact the study investigators for assistance, should they encounter difficulties when using the electronic food diary outside the research facility. Giving participants the possibility to test the application before creating a new electronic food diary and providing them with a step-by-step guide with detailed instructions on how to use the electronic platform is critical to minimize sources of error and to improve participants' compliance.
The range of foods utilized in the 'Boden Food Plate' was not sufficiently large (approximately 1,200 foods against the 10,000 included in the Australian food databases), and it was found to be a limitation of the dietary data collection method. In the feedback questionnaire that participants completed, 'range of food and drink items' recorded the lowest mean score (6.3). However, with 5 being the neutral score in the questionnaire, users did not show to be excessively limited by the range of dietary items when using the application. The database still needs improvement to encompass a greater range of foods and drinks.
For future studies, the dietary data collection method would benefit from modifications of some of the currently used fixed serving sizes and from adding more foods and beverages to the existing database, particularly in the carbohydrate-rich foods and in certain culturally specific foods categories. Additionally, it would be valuable to incorporate the analysis of micronutrients intake14.
The authors have nothing to disclose.
The authors would like to thank Khanh Nguyen, who was involved in the build of the electronic platform as part of his Bachelor of Engineering degree. We also acknowledge Alice Gibson, who developed the paper food diary. Finally, we would like to acknowledge Mackenzie Fong, James Gerofi, Fatima Ferkh, Cholris Leung, Lisa Leung, and Shaoyu Zhang for their help with experimental methods. The work was funded by the Commercial Development and Industry Partnership Funding Scheme at the University of Sydney.
Boden Food Plate | Boden Food Plate | Electronic dietary data collection tool. | |
Paper Food Diary | Any | Written dietary data collection tool. | |
Food Works 7 Professional | Xyris Software 2012 | Software for the analysis of dietary intakes. | |
SPSS 19.0 | SPSS | Statistical software. | |
Computer | Any | This should be used by the study participants to complete the electronic food diary from outside the research facility. |