This study introduces a protocol for measuring microcirculation in human oral mucosa by laser speckle contrast imaging. The monitoring of wound healing after vestibuloplasty combined with a xenogenic collagen graft is presented on a clinical case.
Laser speckle contrast imaging (LSCI) is a novel method for measuring superficial blood perfusion over large areas. Since it is non-invasive and avoids direct contact with the measured area, it is suitable for monitoring blood flow changes during wound healing in human patients. Vestibuloplasty is periodontal surgery to the oral vestibule, aiming to restore vestibular depth with simultaneous enlargement of the keratinized gingiva. In this special clinical case, a split thickness flap was elevated at the first upper premolar and a xenogenic collagen matrix was adapted to the resulting recipient bed. LSCI was used to monitor the re- and neovascularization of the graft and the surrounding mucosa for one year. A protocol is introduced for the correct adjustment of microcirculation measurement in the oral mucosa, highlighting difficulties and possible failures.
The clinical case study presented demonstrated that — following the appropriate protocol — LSCI is a suitable and reliable method for following up microcirculation in a healing wound in the human oral mucosa and gives useful information on graft integration.
Monitoring long-term changes of human gingival microcirculation in a clinical situation is a hot topic in oral and periodontal surgery. However, reliable assessment of perfusion can be difficult. There are only a few methods that do not invasively measure changes in the blood circulation of the human mucosa. Two of these employ a laser beam1,2,3,4, but in a different way. Laser doppler flowmetry (LDF) makes use of the Doppler shift in a laser beam5,6, while the laser speckle contrast imaging (LSCI) method relies on the speckle pattern of the backscattered laser light to measure the velocity of red blood cells7.
LDF measures only in a single point, and reproducible standardization of the sensors' position is a desirable yet difficult task. Another problem is that the probe of the LDF is small in diameter (1 mm2). Measuring at predetermined points before surgery is too specific, and may be blind to postoperative circulatory changes, while edema, tissue removal, tissue movement or the implanted graft cause significant changes in the postoperative geometry of the affected soft tissue. The measuring distance of LDF is less than 1 mm which prohibits use of a dental splint with a predetermined hole for the probe in case of volumetric change of the tissue. LSCI does not require any special tools for localization and can measure in areas of several cm2. As a result, wound healing can be followed throughout the surgical site. In addition, LSCI can display blood perfusion in color-coded images at a fraction of a second, with a resolution of up to 20 μm.
The LSCI device presented in this paper is used mostly for animal research applications where high resolution in small measurement areas is desired. However, since the structure and histology of the human oral mucosa are different from area to area (attached gingiva, marginal gingiva, vestibular mucosa), blood circulation is also heterogeneous8. Therefore, high-resolution LSCI has a great advantage over normal-resolution LSCI which is usually used in human testing.
The LSCI instrument employs an invisible laser (wavelength 785 nm). The beam is diverged to illuminate the measurement area, creating a speckle pattern. A CCD camera images the speckle pattern in the illuminated area. The CCD camera used in this system has an active imaging area of 1386 x 1034 pixels and its resolution is between 20–60 µm/pixel depending on the size of the measurement area and on the setting of the software (low, medium, high). It can take images at a speed of 16 frames per second, or even more, up to 100 frames per second, if the image size is reduced. Blood perfusion is calculated by the built-in software. It analyzes variations in the speckle pattern and quantifies the contrast. The resulting flux is color coded to produce a perfusion image. According to our previous results, LSCI assesses the blood perfusion of the gingiva with good repeatability and reproducibility9. This implies that it is a reliable tool for monitoring changes in the microcirculation of the oral mucosa not only in short-term experiments, but also during long-term studies to track disease progression or wound healing10.
In this paper, we present a clinical case report to demonstrate that the high spatial resolution of LSCI makes it possible to reveal the neovascularization pattern of a xenogenic collagen graft. Furthermore, this case indicates that LSCI, owing to its high reliability, could sensitively detect individual variation. This is important as significant local anatomical variation and a different systemic background between the cases makes it difficult to standardize the surgical intervention in clinical trials of periodontal surgery.
The reported method was employed in a clinical trial which was granted ethical approval from the Hungarian Committee of the Health Registration and Training Center (approval number: 034310/2014/OTIG).
1. LSCI Setup
2. System Verification
3. Participant Preparation
4. Microcirculation Image Measurement
5. Offline Analysis
Vestibuloplasty is periodontal surgery to the oral vestibule, aiming to increase vestibular depth, the zone of keratinized gingiva and soft tissue thickness for enhanced aesthetics and function. The apically repositioned split thickness flap combined with a collagen matrix is a frequently used vestibuloplasty procedure. Xenogenic collagen matrix is a viable alternative to autogenous gingival graft for increasing the amount of keratinized gingiva11,12,13; however, no data are available on the direction of graft revascularization and on how it affects the microcirculation of the surrounding tissues. Understanding these mechanisms may facilitate proper flap and incision design in periodontal surgery.
A 17 year-old male patient with an inadequate width of keratinized gingiva at the first premolar in the maxilla was treated by vestibuloplasty, using an apically repositioned split thickness flap combined with a collagen matrix. Intraoral photographs (taken by a photo camera) and blood flow (BF) measurements by LSCI were taken before the vestibuloplasty (baseline) as well as 1, 2, 3, 4, 5, 7, 9, 11, 14, 21, 27 days and 2, 3, 4, 5, 6 and 12 months postoperatively. Blood pressure and pulse were evaluated before and after each measurement.
During offline analysis, multiple ROIs were determined in the area of the augmented mucosa; some in the graft region and others in the surrounding mucosa, defined as 'peri' regions. As shown in Figure 3, the 'peri' and graft regions were further split into zones depending on distance from the center of the implanted graft, marked as zone F in the picture. Zones A and B were defined in the 'peri' region and zones C, D and E in the graft region. Each of these zones was delimited separately at all four sides of the graft (mesial, distal, apical and coronal). Each 30-second shot was identified as a TOI (Figure 2). Data at each ROI and TOI were exported into a spreadsheet program. Blood flow curves were constructed by a suitable software used for statistical analysis.
There was no significant change in mean arterial pressure (MAP) during the one-year experiment, either in MAP before or after the blood flow measurements per session. Figure 4 shows a color photo, an intensity image and a perfusion image of the operated gingiva on the representative days of our study. During the first postoperative week complete flap closure, a thick layer of fibrin on the grafted area, and mild erythema and edema in the surrounding gingiva were visible. Blood perfusion images showed ischemia in the operated region and hyperemia in the 'peri' regions. From day 14, the grafted area was clinically erythematous, in parallel with severe hyperemia observed on blood perfusion images. By the third month after graft incorporation, the wound healed, and gingival perfusion was close to preoperative circulation levels.
Figure 5 shows a blurred intensity image and the perfusion graph of the entire image. The sudden peak on the graph indicates movement by the patient. The measurement was repeated immediately, after making sure that the patient is in a comfortable position. Changes in BF in the different zones within the graft and in the 'peri' regions are shown in Figure 6. It is common in all curves that from the fourth month, blood flow did not change any further until the end of the investigation. The average blood flow for this period could be used as a resting blood flow value for the new tissue and the random variation between time points allowed us to calculate the time-based variance component for each ROI respectively, using a linear mixed model. The minimum detectable difference could be calculated then to identify real change (with 95% confidence) between time points during the healing period (before the fourth month) in order to determine the hyperemic and the ischemic phase. The basic characteristics of curves were similar in all ROIs within the graft, starting with an ischemic phase followed by a hyperemic phase. However, the length of these two phases was different (Table 1). Ischemia was longest (7–9 days) in the central and in all coronal zones, with late hyperemia starting between day 11 and 27. In other zones of the graft, ischemia lasted only 4–7 days and hyperemia started earlier, between day 7 and 21.
The BF curves of the zones at the different sides of the graft had unique characteristics (Figure 6). At the apical side, all four zones had similar blood flow curves. At the coronal side, perfusion was regained in the outer zone later than in the inner zones, contrary to the mesial and distal side. At both lateral sides, BF increased first in zone C, then in zone D, followed by BF increase in zone E and finally in the central zone F. In the zones of the surrounding mucosa (zone A and B) no significant ischemia was observed. Instead, hyperemia of a different magnitude and extent was observed at the different sides.
There were two time points when the BF value did not tally with the overall characteristics of the BF curve. On day 9, there was a sudden drop in most zones and mainly in the 'peri' zones of the apical and distal side. It cannot be stated with certainty that this was a measurement error, as no measurements were taken on the previous and on the following day. However, according to a note in the measurement report, the buccal fold was retracted with too much pressure by the operator, resulting in a drop in BF. This makes sense considering that mainly the circulation of the distal and apical sides could have been affected by pulling the cheek. On day 182 (6 months later), due to longer intervals between measurement times, the patient has forgotten to keep to the agreed restrictions before the measurement. The bleeding of the marginal gingiva on the colored photograph (Figure 6) indicates harsh tooth brushing prior to the measurement. In the meantime, the patient underwent orthodontic treatment, too, and he used intermaxillary elastics. Both factors could greatly increase BF14,15, so the measurement was repeated at a later time under more carefully controlled circumstances.
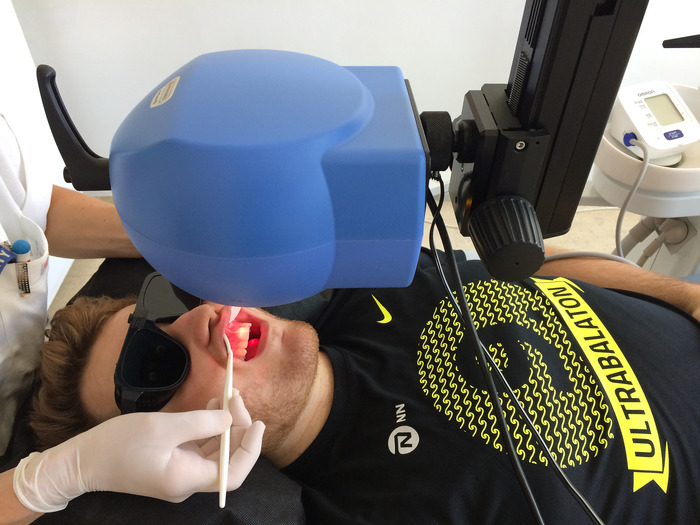
Figure 1: Experimental LSCI setup and patient preparation for blood flow measurement in the operated area. The lips are retracted by dental mirrors. Please click here to view a larger version of this figure.
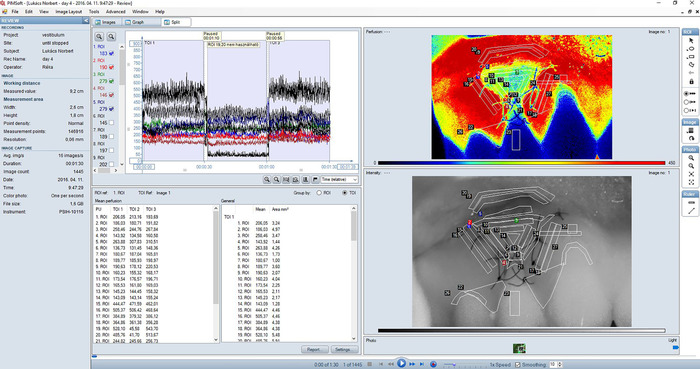
Figure 2: Split view (combination of the Images view and the Graph view) of a typical recording of gingival blood flow in the treated area. Perfusion image (upper right sub-view) is a color-coded representation of blood perfusion in the gingiva. Areas of high perfusion are shown in red while areas of low perfusion are blue. The color range of perfusion images corresponds to 0-450 LSPU; smoothing was set to 10. An intensity image (lower right sub-view) is created by the total backscattered laser light. It corresponds exactly with the perfusion image and is useful for orientation and for identifying details in the perfusion image. Regions of interest (ROI) are always defined in the intensity image. The graph (upper left panel) shows real-time blood perfusion traces for each ROI in the recording. Check boxes to the left can be used to select which traces to show. Three consecutive measurements are shown on the graph. Each 30 s shot was identified as a TOI. A mean value table showing mean perfusion values in each ROI and TOI is also displayed in Split view (lower left panel). Please click here to view a larger version of this figure.
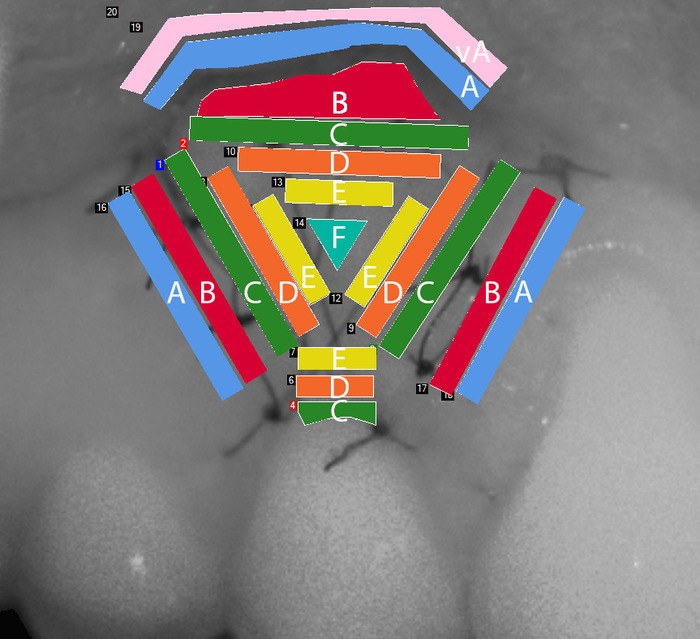
Figure 3: Regions of interest (ROI) defined within the examined gingival area in the intensity image. Zone A and B are in the 'peri' region, while zone C, D and E are in the graft at decreasing distances from the center of the graft, marked as zone F. Zone A is situated on the vestibular surface of the lips. Please click here to view a larger version of this figure.
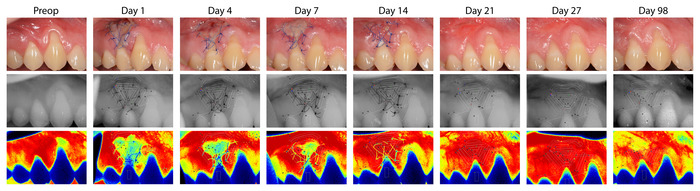
Figure 4: Representative photographs (upper line), LSCI intensity image (middle line) and LSCI perfusion image (lower line) of the operated gingiva. The images represent the preoperative state and perfusion, and wound healing and perfusion 1, 4, 7, 14, 21, 27 and 98 days postoperatively. Please click here to view a larger version of this figure.
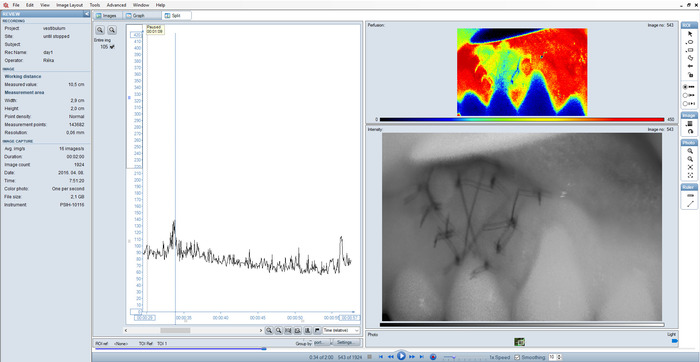
Figure 5: Split view of a sub-optimal recording. Blurred intensity image and outlying peaks on the graph as a result of incorrect setting. Please click here to view a larger version of this figure.
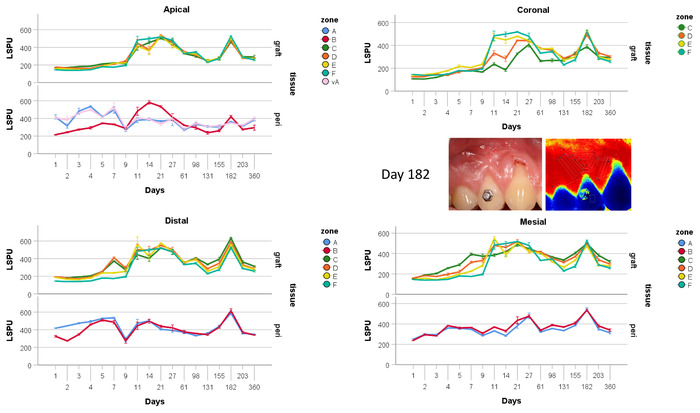
Figure 6: Scatter plot of BF over time at the coronal (a), mesial (b), distal (c) and apical (d) side of the graft. The central part of the graft (zone F) was depicted in all graphs to serve as a reference for more external zones. Please click here to view a larger version of this figure.
Side | Zone | Ischemia end | Hyperemia start | Hyperemia end |
coronal | c | 9 | 27 | 27 |
coronal | d | 9 | 21 | 27 |
coronal | e | 7 | 11 | 98 |
central | f | 9 | 11 | 98 |
mesial | c | 5 | 21 | 27 |
mesial | d | 5 | 11 | 61 |
mesial | e | 7 | 11 | 61 |
distal | c | 5 | 11 | 27 |
distal | d | 4 | 7 | 98 |
distal | e | 4 | 11 | 98 |
apical | c | 4 | 11 | 27 |
apical | d | 5 | 11 | 61 |
apical | e | 5 | 11 | 61 |
Table 1: Time frame of the ischemic and hyperemic phase in the various zones in the graft, in days
The aim of this study was to introduce a novel technique for monitoring the neovascularization of a graft in the human gingiva. According to our previous results, LSCI assesses the blood perfusion of the gingiva with good repeatability and reproducibility9, when strict implementation of each step of the planned protocol as a critical requirement is met. LSCI is regarded as a semi-quantitative technique that requires calibration periodically to ensure accuracy and stability. During verification, the room temperature must be measured as accurately as possible, because this value is used by the verification algorithm to calculate perfusion.
The LSCI method is highly sensitive to the working distance setting and movement artifacts as well. In this study, working distance was fixed at 10 cm. The measurement area was 2.7 cm x 2 cm, which corresponds to an approximately three teeth wide gingival area. The effective frame rate was 16 images/s and 0.06 s/image as the arterial pulse induces pulsatile changes in gingival microcirculation9, which has to be averaged out from the recording. Rapid imaging reduced the risk of movement artefacts, too. However, in case of incorrect settings or patient movements, the recording should be stopped and repeated under optimum conditions.
Two operators took part in every measurement: one adjusted the LSCI head and controlled the computer while the other retracted the lips of the patient. In this study, three repeated measurements were performed in each session, each taking 30 s. Since measurements always involve some kind of irritation to the soft tissue due to the inevitable retraction of the lips and cheeks, which disturbs the microcirculation of the gingiva, an increase in random error occurs. Such inter-day variation, however, can be minimized by repeating the entire measurement process, i.e., by re-opening the mouth, retracting the soft tissue again, re-setting the camera's position and re-selecting ROIs in the software9.
Gingival microcirculation showed high regional variation8. Therefore, a method such as LSCI which measures blood flow in a wide area has a great advantage over single point measurement techniques like LDF. In this study, the measurement area covered the whole surgical field. The wide measurement area allowed us to compare re- or neovascularization in various regions within the wounded area in our study. Contrary to LDF, where the probe is fixed by stents fabricated before surgery, in the case of the LSCI method, there is no need to define the region to be examined in advance. For the primary aim of monitoring wound healing in personalized medicine is to recognize unexpected patterns anywhere around the wound or the flap. In addition, postoperative changes in tissue geometry and edema caused by soft or hard tissue augmentation would make the pre-fabricated stents useless after surgery. To help visual evaluation, smoothing was turned on during recording and the smoothing value was set to 10. This means that perfusion was averaged over ten images for a smoother appearance of the perfusion image and in order to decrease background noise. However, smoothing is only a visual effect and does not influence actual recorded perfusion values.
Gingival blood flow has a high temporal variation as well. This may be related to many physiological factors which accompany everyday life, such as gingival inflammation16,17,18, circadian rhythm19, blood pressure20, temperature16,21, mechanical pressure8,22,23,24, tooth brushing14,17,25 or orthodontic force15. Therefore, the standardization and stabilization of these factors is obligatory for successful follow-up measurements.
The methods used earlier for investigating graft vascularization are highly invasive, which meant a major restriction on measurement time points during healing, especially in human studies26,27,28,29,30,31,32. They also have limitations in terms of measuring regional differences quantitatively. Our previous studies9,10 have already proved the high reliability of LSCI in clinical trials and it was found to be useful to determine the time of soft tissue healing of an individual after tooth extraction in order to optimize implant placement33. In this study, the wound area covered by a xenogenic collagen graft showed excellent neovascularization, as on the 11th postoperative day all zones within the graft achieved the maximum blood flow level. However, it could be presumed that the collagen graft sloughed off or was resorbed by day 11 and we actually measured the revascularization of the recipient bed. In addition to its non-invasive feature, another special attribute of LSCI is a capability to characterize reperfusion curves at various regions of a graft during incorporation at individual level. The centripetal characteristics of graft neovascularization are similar to previous histology observations30. This suggests that graft revascularization not only occurs from the periosteal vascular plexus but also from the wound margin.
The experiment presented shows that the revascularization of a graft can be clearly followed up if every step is followed strictly. However, on day 182, non-compliant patient preparation and instruction resulted in a significant increase in BF.
LSCI is extensively used for full-field imaging of vascular structure and associated blood flow in other tissues, like in the retina34,35, the skin7,36 and the brain37,38. The most promising clinical applications of LSCI are burn wound assessment39,40, evaluation of flaps41 and intraoperative cerebral blood flow monitoring42. Apparently, there are serious limitations to widespread gingival measurements by LSCI in human subjects. This tool is very robust and heavy. The main difficulties arise in connection with the documentation camera, which has low resolution and is located a few centimeters away from the measurement camera. These features make it difficult to identify regions of interest directly on color photos. The size of the LSCI machine head prevents shooting inside the oral cavity. Therefore, areas which are not visible directly may not be measured. We have demonstrated earlier that using an indirect approach with a photographic mirror may serve as an alternative method9. However, using a mirror involves more movement artifacts which LSCI is sensitive to, makes it more difficult to capture a perpendicular image and decreases the focal distance. When the measured area cannot be captured perpendicularly, the blood flow value may be correct9,39, but region identification on the image remains complicated because of 3D torsion.
The authors have nothing to disclose.
This work was carried out in part from support by the Hungarian Scientific Research Fund under Grant Number K112364, by the Hungarian Ministry of Human Capacities, Higher Education Excellence Program to Semmelweis University, Therapy Research Module and by the National Research, Development and Innovation Office KFI_16-1-2017-0409. The authors thank Dr. Bálint Molnár, co-worker of the Department of Periodontology, Semmelweis University, who performed the vestibuloplasty in the presented clinical case.
PeriCam PSI-HR | Perimed AB, Stockholm, Sweden | The PeriCam PSI System is an imaging system based on LASCA technology (LAser Speckle Contrast Analysis). The system measures superficial blood perfusion over large areas at fast capture rates. This makes it ideal for investigations of both the spatial and temporal dynamics of microcirculation in almost any tissue. | |
PIMSoft | Perimed AB, Stockholm, Sweden | PIMSoft is a data acquisition and analysis software, intended for use together with the PeriCam PSI System and the PeriScan PIM 3 System, for measurement and imaging of superficial blood perfusion. | |
Geistlich Mucograft | Geistlich, Switzerland | It's a unique 3D collagne matrix designed specifically for soft tissue regeneration. It's indicated for the gain of keratinized tissue and recession coverage. | |
Omron M4 | Omron Healthcare Inc., Kyoto, Japan | Blood pressure monitor, which gives accurate readings. | |
Nikon D5200 | Nikon Corportation, Tokyo, Japan | Taking intra oral photos | |
MS Excel | Microsoft Corporation, Redmond, Washington, USA | The software used for data management | |
IBM SPSS Statistics 25 | IBM Corp., Armonk, NY, USA | The software used for statistical analysis |