This technique describes real time recording of oxygen consumption and extracellular acidification rates in explanted mouse retinal tissues using an extracellular flux analyzer.
High acuity vision is a heavily energy-consuming process, and the retina has developed several unique adaptations to precisely meet such demands while maintaining transparency of the visual axis. Perturbations to this delicate balance cause blinding illnesses, such as diabetic retinopathy. Therefore, the understanding of energy metabolism changes in the retina during disease is imperative to the development of rational therapies for various causes of vison loss. The recent advent of commercially-available extracellular flux analyzers has made the study of retinal energy metabolism more accessible. This protocol describes the use of such an analyzer to measure contributions to retinal energy supply through its two principle arms – oxidative phosphorylation and glycolysis – by quantifying changes in oxygen consumption rates (OCR) and extracellular acidification rates (ECAR) as proxies for these pathways. This technique is readily performed in explanted retinal tissue, facilitating assessment of responses to multiple pharmacologic agents in a single experiment. Metabolic signatures in retinas from animals lacking rod photoreceptor signaling are compared to wild-type controls using this method. A major limitation in this technique is the lack of ability to discriminate between light-adapted and dark-adapted energy utilization, an important physiologic consideration in retinal tissue.
The retina is among the most energy-demanding tissues in the central nervous system1. Like most tissues, it generates adenosine triphosphate (ATP) via glycolysis in the cytosol or via oxidative phosphorylation in mitochondria. The energetic advantage of oxidative phosphorylation over glycolysis to produce ATP from one molecule of glucose is clear: 36 molecules of ATP generated from the former vs. 2 molecules of ATP generated from the latter. Accordingly, retinal neurons primarily depend on mitochondrial respiration for energy supply and this is reflected by their high density of mitochondria2. Yet, the retina also relies heavily on glycolytic machinery even when oxygen is abundant. This process of aerobic glycolysis was originally described in cancer cells by Otto Warburg3, who once noted that the retina was the only post-mitotic tissue capable of this form of metabolism4. Since those initial observations, many post-mitotic tissues have been described to engage in varying degrees of glycolysis in addition to oxidative phosphorylation to meet their ATP demands.
Phototransduction, visual pigment recycling, biosynthesis of photoreceptor outer segments, and synaptic activity are all energy demanding processes in photoreceptors, the predominant neuronal subclass in the retina. But the need to actively transport ions against their electrical and concentration gradients is by far the most energetically consuming process in neurons1. Photoreceptors are peculiar neurons in the sense that they are depolarized in the absence of stimulation (i.e., in the dark), whereas a light stimulus triggers channel closure and subsequent hyperpolarization. Therefore, in the dark, the retina consumes large quantities of ATP to maintain its depolarization or "dark current" as it is commonly called. From an adaptive standpoint, a major challenge in supplying these vast quantities of ATP is the need for organisms to maintain visual clarity through the optical axis. The inverted retinal architecture seen in modern creatures is the dominant solution, as it keeps the dense capillary network supplying photoreceptors away from the path of light. But this marvel of natural bioengineering places the retina at a precipice in terms of metabolic reserve. Even small insults to retina can potentially disrupt the delicate balance of energy supply to demand, and visual dysfunction or frank blindness may ensue quickly.
Given the unique energetic demands of the neural retina, coupled with its tight restriction of vascular supply, accurate measurement of ATP consumption in the retina and its changes during disease could have profound implications in understanding and treating blinding conditions such as retinitis pigmentosa and diabetic retinopathy. Traditionally, these measurements require costly, custom-designed equipment with most studies emerging from a handful of laboratories entirely dedicated to measurements of metabolic activity2,5,6,7,8. Techniques include individual assays for specific metabolites, tracer studies using radio-labeled precursors, oxygen consumption recording using Clark electrodes, and metabolomic profiling9.
With advances in high-throughput technology and increased availability of commercial devices, techniques to record retinal metabolism are increasingly accessible and affordable. The method described here measures both oxidative phosphorylation and glycolysis in retina using explanted tissue and a commercially-available extracellular flux analyzer9,10,11,12. This analyzer separately records oxygen consumption rate (OCR) and the extracellular acidification rate (ECAR), serving as indirect indicators of oxidative phosphorylation and glycolysis, respectively13. These measurements are done by a probe submersed within a microchamber created over the tissue of interest. This adaptation of previously published methods uses a capture plate originally designed for pancreatic Islets of Langerhans to record metabolic activity in small, circular sections of mouse retina. Multiple pharmacologic exposures can be delivered to the tissue during the course of a single recording because the system contains 4 injection ports for each sample well. Using this system with separate protocols optimized for ECAR and OCR recordings, the responses of wild-type retinas can be compared to retinas lacking transducin (Gnat1-/-), a cause of congenital stationary night blindness in humans14.
Protocols followed the Association for Research in Vision and Ophthalmology Statement for the Use of Animals and were approved by Washington University.
1. Animal Preparation
2. Solution Preparation
3. Instrument Calibration
4. Isolation of Fresh Mouse Retinal Tissue
Note: This step is adapted from the technique of Dr. Barry Winkler15.
5. Assay Protocol
Using the described techniques (summarized in Figure 1), retinal explants from 8 week-old wild type (WT) mice were compared to age- and background-matched transducin null mice (Gnat1-/-). Because Gnat1-/- animals lack the machinery to close cyclic-nucleotide gated ion channels in response to light stimuli, their rod photoreceptors remain depolarized even in light14. The subsequent need to maintain potassium efflux would create a large ATP demand, resulting in bioenergetic strain. To determine if such shifts in energy demands would increase oxidative phosphorylation or glycolytic flux, tissues from wild type mice and Gnat1-/- mice were compared using the extracellular flux analyzer. At baseline, in the presence of 5 mM glucose and 1 mM pyruvate, retinal tissues from wild-type animals have similar rates of acid efflux compared to Gnat1-/- mutants. Similar patterns are seen after addition of 20 mM glucose and the glycolytic inhibitor 2-DG (Figure 2A). These data may also be mathematically transformed to represent fractional changes from baseline (Figure 2B), a format which may allow for better comparison between different experimental interventions.
Absolute OCR at baseline is equivalent between WT and mutant retinal tissue (Figure 3A). The addition of 20 mM glucose increases mitochondrial respiration, but no change is observed between groups in terms of absolute quantification or in terms of change from baseline (Figure 3B). The addition of 1mM FCCP (an uncoupling agent) to demonstrate maximal mitochondrial respiratory rates does not significantly increase OCR above the level seen with high glucose in WT or Gnat1-/- tissues. However, signals from both mice drastically drop after the addition of RAA cocktail.
Ideally, extracellular flux experiments run in the presence of the ATP synthase inhibitor oligomycin aid in identifying sources of proton leak, occurring when movement through the electron transport chain is not associated with ATP production16. In retinal explants from 8 week-old C57BL/6J mice, oligomycin treatment robustly lowers OCR, as expected (Figure 4). But subsequent addition of FCCP, to find maximal OCR, only nominally increases the OCR to about 60% of baseline, consistent with a prior study11.
The XF24 analyzer uses submersible probes that make a tight seal within the tissue well, creating a transient microenvironment for measurement of oxygen and acid flux. Positioning of retinal tissue in the well plate (in relation to the sensors) could potentially influence OCR recordings, and lead to unwanted confounders, and some reserachers have advocated placing retinal tissue directly underneath the oxygen sensor with the photoreceptor outer segments oriented toward the sensor11. To test the effects of retinal tissue position on OCR measurements, tissues from young C57BL/6J mice (8 weeks old) were analyzed in two orientations: retinal ganglion cells facing down onto the plate (i.e., photoreceptors placed upright closest to sensor) or facing up toward the sensor. No differences in relative OCR in response to FCCP or RAA were observed, indicating equivalent sensitivity for maximal and minimal mitochondrial respiratory rates in either orientation (Figure 5A). In addition, absolute OCR measurements were also equivalent between retinal tissues in either orientation (Figure 5B).
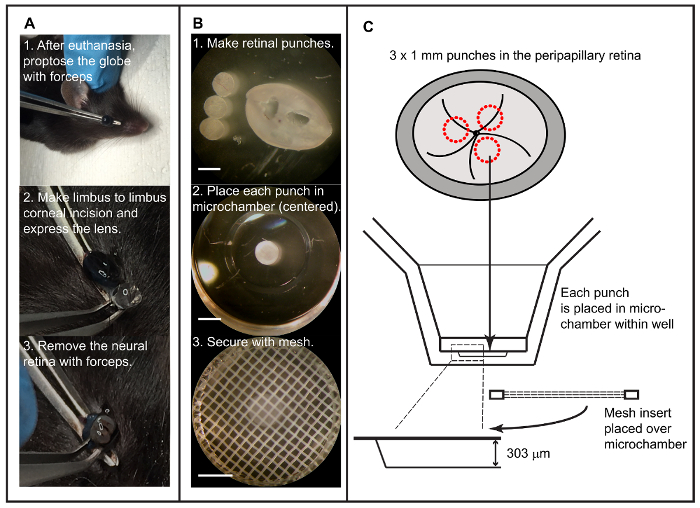
Figure 1: Isolation of retinal explant and setup into the extracellular flux analyzer. A. Isolation of the neural retina in situ by applying propulsive force on globe with forceps, incising the cornea, and removing retina after discarding lens and anterior hyaloid membranes. B. Preparation of tissue for flux recording with retinal punch creation, placement of individual punches into islet capture microplate, and use of a mesh insert to minimize tissue movement with microchambers (scale bars = 1 mm). C. A schematic, derived from manufacturer-provided data, showing the procedure outline and demonstrating that height of the microchamber is adequate to accommodate the murine retina. Please click here to view a larger version of this figure.
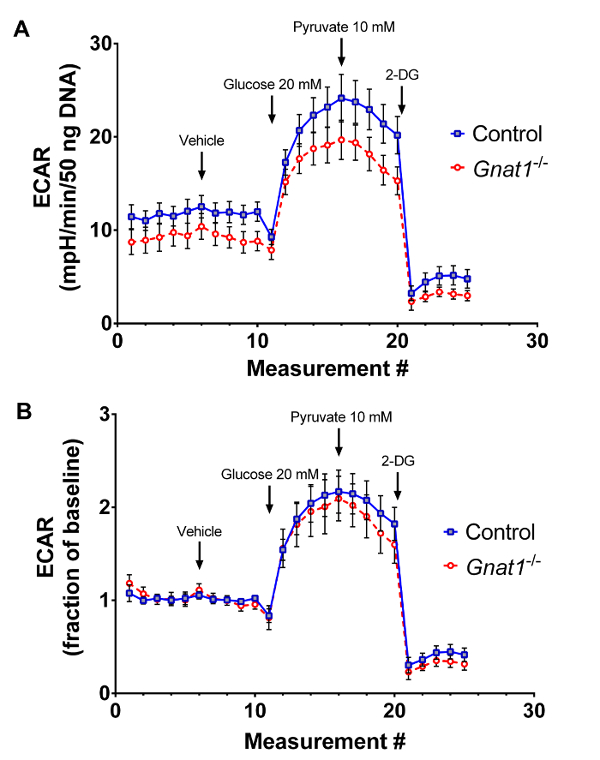
Figure 2: Mitochondrial stress analysis using explanted retina from 8 week-old animals. A. Averaged tracings with standard error of measurement (SEM), normalized to DNA content of the tissue, from an experiment optimized for oxygen consumption recordings, comparing transducin knockout animals (Gnat1-/-) to wild type controls. B. Same experiment with data transformed such that baseline recordings are set as the reference. Please click here to view a larger version of this figure.
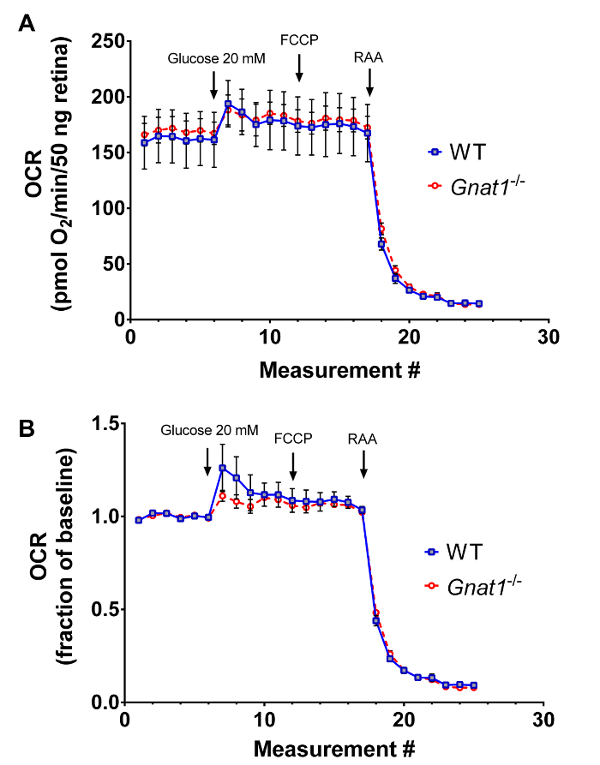
Figure 3: Analysis of glycolytic rate using explanted retina from 8-week old animals. A. Averaged, DNA content-normalized, tracings from an experiment optimized for acid efflux recordings comparing transducin knockout animals (Gnat1-/-) to wild type controls. B. Data from the same experiment normalized to baseline recordings. Traces show mean ± SEM. Please click here to view a larger version of this figure.
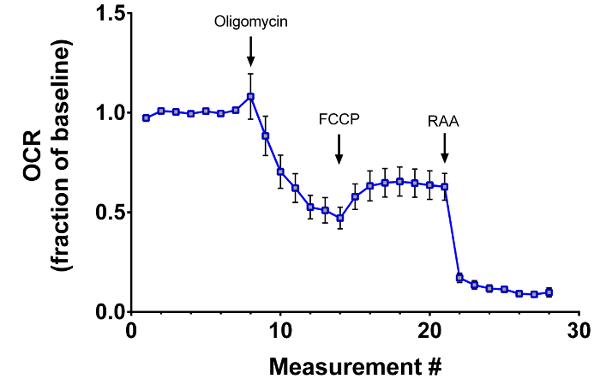
Figure 4: Irreversible effects of oligomycin on retinal respiratory rates. In acutely prepared retinal explants from 8 week-old C57BL/6J mice, oligomycin treatment reduces the maximal OCR induced by subsequent addition of FCCP. Traces show mean ± SEM. Please click here to view a larger version of this figure.
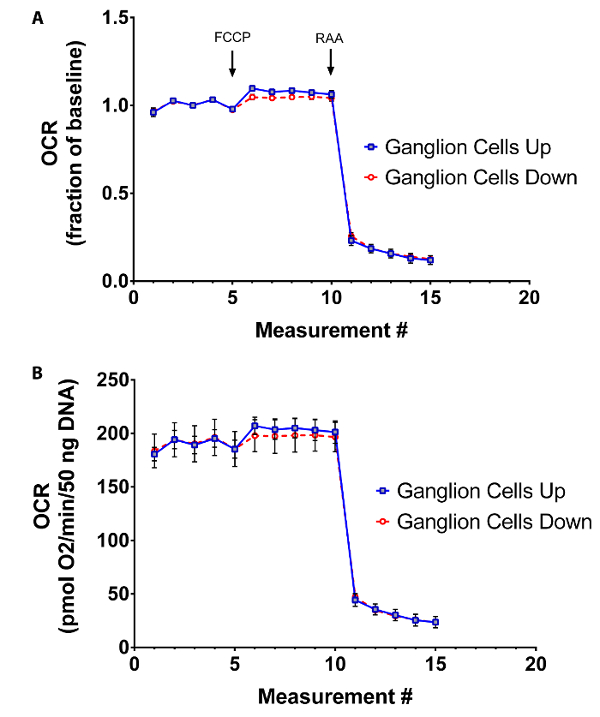
Figure 5: Effects of tissue positioning on OCR measurement. Retinal tissues from 8 week-old C57BL/6J mice were placed in wells with ganglion cells facing toward the sensor (Ganglion Cells Up) or away from the sensor (Ganglion Cells Down). Between groups, similar extracellular flux recordings are observed in terms of (A) respiratory capacity relative to baseline or (B) in terms of absolute quantification. Traces show mean ± SEM. Please click here to view a larger version of this figure.
OCR and ECAR are readily measured in explanted retinal tissue using a bioanalyzer using the described techniques. This method departs from those of other groups in several critical steps. Retinal tissues are isolated through a large corneal incision without enucleating the globe, as originally described by Winkler15. This method of retinal isolation allows for a rapid transfer from the living eye into the tissue capture plate (often within 5 minutes). Tissues are kept at 37 °C throughout the process, which preserves cellular respiration better than when they are placed on ice. Media with minimal additives are used for initial measurements, omitting any buffering agents such as HEPES or sodium bicarbonate, serum, or excess macronutrients, as this allows for more reliable measurements of basal energy metabolism and does not inhibit assessment of ECAR. Retinal punches are best recorded in a 24-well format, rather than in 96-wells, to minimize trauma to the tissue. Retinal tissue is placed in the center of the well, within the tissue microchamber, and secured with a mesh insert. Doing so allows for accurate recording of ECAR and OCR, while preventing excessive tissue movement during the run, and eliminates the need for other reagents such as tissue adhesives. A vehicle injection during the run is recommended, especially when setting up recording experiments for the first time, as this will provide a sense of how well the tissue is secured within the capture plate. OCR recordings using this technique are independent of retinal orientation within the well, but the orientation must be kept consistent among samples within experiments. All measurements are taken only after retinal metabolism has reached steady state following injection of test compounds.
This protocol describes normalization of data to total DNA content, as a proxy for cell number. Such a technique is advantageous because it will account for changes to cell number driven by variation in retinal thickness, punch size, or differences in cellularity between genetically dissimilar samples. Total protein-based normalization is also a reliable method, and has the advantage of minimizing differences in total mitochondrial mass between retinal samples. However, normalization based on protein content in whole tissue may be confounded by changes in extracellular matrix between samples. Normalization of flux recordings to the baseline, as shown in the representative results, is advantageous because it minimizes variability in retinal punch size between replicates and easily allows interpretation of changes due to pharmacologic interventions. However, reporting of raw values allows for better comparison between different experiments and for experiments performed using different flux recording methods.
Results using these techniques are comparable to those reported elsewhere. Though oligomycin – an ATP synthase inhibitor – is typically used to measure proton leak within tissues or cells of interest, this compound has untoward effects on retinal metabolism. In the experiments reported here, a 60% decrease in maximal retinal OCR elicited by FCCP is observed after exposure to oligomycin (Figure 4), nearly identical to a previous study11. A potential explanation for this finding is irreversible damage or modification to retinal mitochondria by ATP synthase inhibition. Furthermore, as Kooragayala and colleagues first reported11, retinal mitochondria are likely operating at near maximal rates in basal conditions since an electron transport chain uncoupling agent, FCCP, only increases OCR by about 15% (Figure 3, Figure 5).
Extracellular flux recordings in explanted retinal tissues demonstrate a large reserve glycolytic capacity, since the addition of 20 mM glucose elicits a two-fold increase in ECAR (Figure 2). Because oligomycin, usually used to gauge maximal glycolytic capacity, has deleterious effects in retinal tissue (Figure 4), the use of high glucose addition to the recording may serve as better proxy to gauge glycolytic reserve in the retina. An important caveat preventing the use of ECAR as a pure proxy for glycolytic rate is that CO2 liberated by the citric acid cycle can be a significant source of acid in cultured tissue17. Excess pyruvate does not increase ECAR above the levels elicited by high glucose, and glycolytic flux is nearly eliminated in retinal explants using excess molar ratios of 2-DG (Figure 2). Since ATP is used to regenerate membrane potential occurring from depolarization events in the dark-adapted retina, animals lacking transducin are expected to expend more energy than WT counterparts. However, in explants, differences in retinal energy metabolism between Gnat1-/- and controls were not seen in the experiments described here (Figure 2 and 3). These results are consistent with those obtained using a custom perfusion apparatus to measure OCR in Gnat1-/- animals18. Notably, the custom apparatus used by Du and colleagues allowed for measurement of OCR under light-adapted and dark adapted conditions. By doing so, a small but significant decrease in OCR after light exposure is detected in wild-type retinas, but not in Gnat1-/- retinas18. This illustrates a major limitation of the current technique in measuring ECAR and OCR in explanted retinas – the extracellular flux analyzer used here relies on visible light excitation of fluorophores embedded in its oxygen and pH sensors, eliminating the possibility of performing measurements in dark-adapted tissues. Such measurements are highly relevant to visual physiology and will still require the use of older techniques designed exclusively for the study of retinal metabolism.
The authors have nothing to disclose.
We thank Dr. Alexander Kolesnikov and Dr. Vladimir Kefalov for providing Gnat1-/- mice, for helpful feedback and advice, and for reading the manuscript.
This work was supported by NIH EY025269 (RR), the Diabetes Research Center at Washington University – NIH DK020579 (JRM and RR), a Career Development Award from Research to Prevent Blindness (RR), the Horncrest Foundation (RR), a Career Development Award from JDRF (JRM), NIH DK101392 (CFS), DK020579 (CFS), DK056341 (CFS), and DK114233 (JRM).
Seahorse XF24 Extracellular Flux Analyzer | Agilent, Santa Clara, CA | ||
Seahorse XF24 Islet Capture FluxPak (includes: Islet Capture Microplate, Sensor Cartridge and Calibrant Solution) | Agilent, Santa Clara, CA | 101174-100 | Includes islet capture microplate, sensor cartridge and calibrant solution |
RPMI 1640 Media (Powdered medium) | Millipore-Sigma | R1383 | RPMI 1640 Media with L-Glutamine and without glucose or sodium bicarbonate |
D-Glucose | Millipore-Sigma | G8270 | 1M D-Glucose filtered, for media preparation |
Sodium pyruvate | Corning | 25000CI | 100 mM sodium pyruvate |
Antimycin-A | Millipore-Sigma | A8674 | Mitochondrial stress protocol component |
FCCP | Millipore-Sigma | C2920 | Mitochondrial stress protocol component |
Rotenone | Millipore-Sigma | R8875 | Mitochondrial stress protocol component |
2-deoxyglucose | Millipore-Sigma | D6134 | Glycolysis protocol component |
1 mm skin biopsy punches with plunger | Integra-Miltex | 33-31AA-P/25 | Explanting retinal tissue tool |
Dumont Mini-Forceps Straight | Fine Science Tools | 11200-10 | Explanting retinal tissue tool |
Dumont Medical #5/45 Forceps- Angled 45 degrees | Fine Science Tools | 11253-25 | Explanting retinal tissue tool |
Dumont #7 Forceps – Curved | Fine Science Tools | 11271-30 | Explanting retinal tissue tool |
Quant-iT Picogreen dsDNA Assay Kit | Fisher Scientific | P7589 | Loading normalization assay |
Trizma base (Tris base) | Millipore-Sigma | T6066 | Component of lysis buffer |
Triton X-100 (polyethylene glycol tert-octylphenyl ether) | Millipore-Sigma | X100 | Component of lysis buffer |
0.5M EDTA pH 8.0 | Ambion | AM9262 | Component of lysis buffer |
C57BL/6J mice | Jackson Laboratories | Strain 000664 | Animals |
Gnat1-/- and background-matched Gnat1+/+ | Vladimir Kefalov, PhD; Washington University School of Medicine | Animals |