We compared two different homogenization methods (DH versus PD) applied to mouse brain and spinal cord, to test the efficiency in retrieving different viable cell types suitable for downstream applications. To do so, we exploited a 9-color flow cytometry panel designed to characterize, in the same sample, different CNS cell types including microglia, lymphocytes, neurons, astrocytes, oligodendrocytes and endothelium.
Brain and spinal cord tissues were retrieved from different mice (n ≥ 6), split in two halves longitudinally, weighed and processed in parallel by applying either mechanical disruption using the Dounce homogenizer (DH method) or gently minced and digested enzymatically using the commercial NTDK based on papain (PD method) (Figure 1A). After debris removal, cells from the brain or the spinal cord were diluted 1/10 or 1/2−1/5, respectively, in Trypan blue to determine cell yield and viability with a Neubauer chamber (Figure 1B,C). The DH method overall produced a higher cell yield from both brain and spinal cord. However, majority of the cells retrieved were dead, resulting in only 13.8% ± 3.3% of viable cells in the brain and 10.5% ± 1.5% in the spinal cord (Figure 1B). Many of the dead cells formed aggregates (Figure 1C); this phenomenon could be due to the presence of highly interconnected cell networks (like the endothelial and glial cells lining the CNS vasculature) that could not be disaggregated by the shearing force applied with the DH. These aggregates of death cells were likely not removed by the density gradient and ended up in the final cell pellet used for cytofluorimetric analysis. On the contrary, the PD method determined an overall better preservation of cellular viability (90.6% ± 0.6% in the brain and 85.2% ± 2.8% in the spinal cord). Papain is able to digest the extracellular matrix and cell-to-cell junctions efficiently, leading to a more uniform single cell suspension. Some of the cells that die during the mincing process could be further digested by papain leading to formation of cell debris that are more efficiently separated through the density gradient. Overall, this likely determined a better preservation of cell viability with PD method, despite a slightly lower cell yield as compared with the DH method.
An aliquot of 100 µL from the brain and spinal cord cell suspensions was stained with the antibody mix (Table 1) and analyzed by flow cytometry with a 9-color panel. Figure 2A shows the gating strategy used to identify the different cell types from the brain and spinal cord cell suspensions. Briefly, the first gate identifies the general population according to forward scatter (FSC) and side scatter (SSC), excluding small cell debris. Then live (7-AAD-) cells are identified. Within total live cell population, CD45+ and CD45- cells are highlighted. Within the CD45+ gate, CD45+CD11b+ microglia/macrophages and CD45+CD11b- lymphocytes are identified. Within CD45- gate, cells are discriminated according to positivity for ACSA2 (astrocytes) or O4 (oligodendrocytes). CD45-ACS2-O4- cells are further subdivided according to positivity for Thy1 (neurons) or CD31 (endothelium). Remaining Thy1-CD31- cells are classified as “other cell types”, not accounted by our antibody mix.
As shown in Figure 2B, with DH method about 38% of the viable cells retrieved from the brain and about 32% of the viable cells retrieved from the spinal cord were of hematopoietic origin (CD45+). On the other hand, PD method allowed to retrieve a significantly high yield of viable cells in both tissues, with a very large fraction represented by non-hematopoietic CD45- cells (about 82% in the brain and 92% in the spinal cord). Remarkably, CD45+CD11b+ microglia/macrophages represented the most abundant viable cell fraction with the DH method (Figure 2C). However, PD method produced a more heterogeneous representation of cell types, including ACSA+ astrocytes, O4+ oligodendrocytes, CD31+ endothelial cells and Thy1+ neurons (Figure 2C). Interestingly, viable neurons and endothelial cells were hardly detectable with the DH method.
The DH method relies on mechanical grinding of the tissue between the glass pestle and mortar of the Dounce homogenizer to obtain tissue homogenization. This could cause some shear stress that will likely damage and affect viability of large or very sensitive cells such as neurons or cells of the neurovasculature. We evaluated the cellular viability (percentage of 7-AAD- cells) within each cell subpopulation identified through the antibody panel (Figure 3). Hematopoietic cells (CD45+) isolated from brain and spinal cord, including microglia/macrophages (CD45+CD11b+) and other non-myeloid cells (CD45+Cd11b-), displayed very high viability independently from the homogenization method that was used (Figure 3A). On the contrary, the DH method determined a significant reduction of viability of CD45- populations (Figure 3B) whereas the PD method determined an extensive preservation of different CNS cell types. In detail, neurons and endothelial cells were the subpopulations most significantly affected by DH and preserved by the PD method.
A schematic presentation of the critical steps required for proper sample preparation and efficient debris removal are summarized in Figure 4.
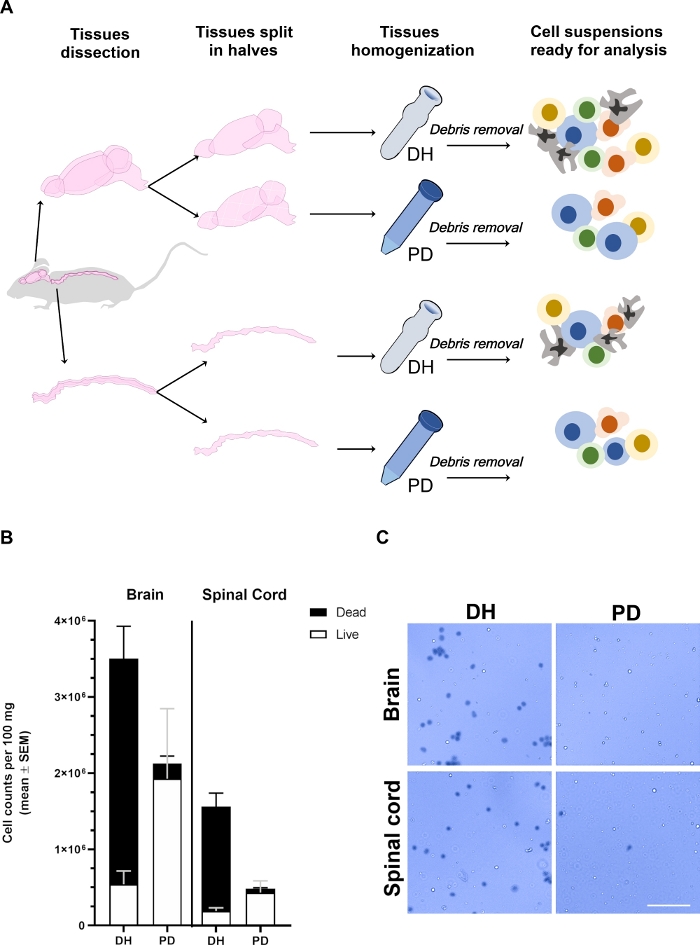
Figure 1: Yield of cells retrieved from brain and spinal cord is affected by the homogenization method.
(A) Experimental outline. Mice were anesthetized and intracardiacally perfused with PBS to remove intra-vascular circulating blood cells. The brain and spinal cord were carefully dissected and split in two halves longitudinally. Tissues were homogenized using either Dounce homogenizer (DH) or papain digestion (PD) as detailed in the main text. Myelin and tissue debris were then removed by centrifugation in a 30% density gradient medium solution resulting in a heterogeneous cell suspension containing different cell types that could be analyzed by flow cytometry. (B) Histograms showing the yield of cells retrieved from the brain or the spinal cord upon tissue homogenization with the DH or PD method. The mean ± SEM of at least 6 animals per condition is represented. (C) Representative brightfield microscope photomicrographs of Trypan blue positive (dead) and negative (live) cells retrieved from brain or spinal cord by the two methods. Scale bar = 100 µm. Please click here to view a larger version of this figure.
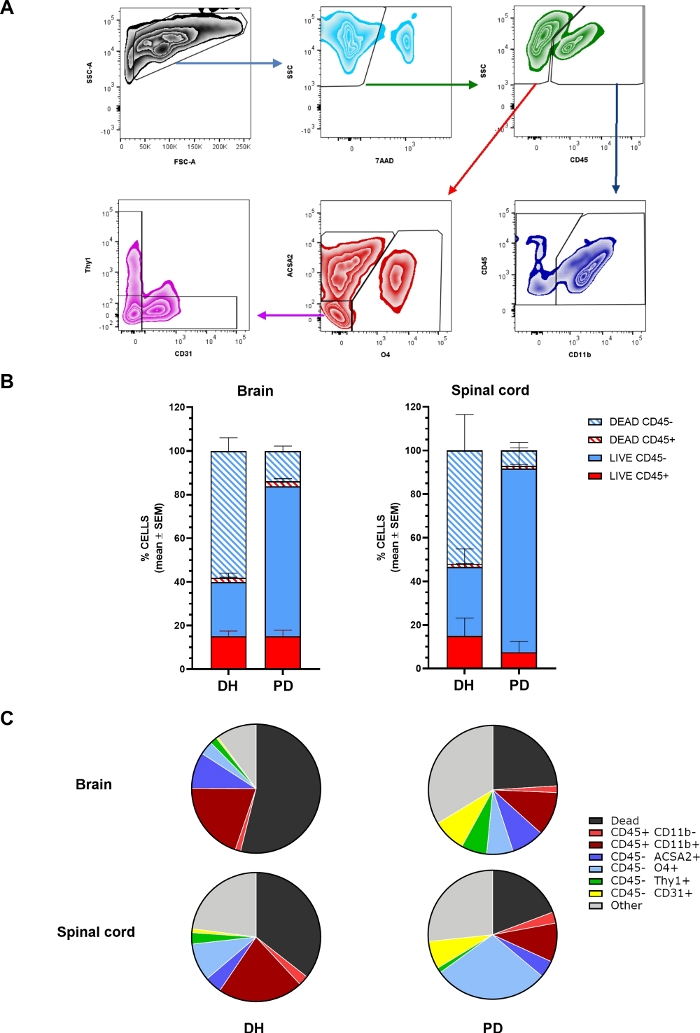
Figure 2: Relative proportions of different cell types retrieved from the CNS are affected by the tissue homogenization method.
(A) Representative flow cytometry plots showing the gating strategy to identify different cell subpopulation within cell preparations obtained from brain or spinal cord: cell population is gated on FSC and SSC physical parameters, followed by selection for 7-AAD- live cells; then cells are discriminated according to positivity for CD45 marker; microglia/macrophages are identified as CD11b+ cells within the CD45+ fraction whereas lymphocytes are CD11b-. Astrocytes, oligodendrocytes, endothelial and neuronal cells are identified as ACSA2+, O4+, CD31+ or Thy1+ cells within CD45-, respectively. (B) Histograms showing the percentage of CD45+ and CD45- cells within total live or dead cell populations, in brain or spinal cord upon homogenization with the DH or PD method. The statistical analysis of the results shown in the graphs is reported in Table 2. (C) Pie charts showing the percentage of different viable cell subtypes within total cell population, in brain or spinal cord upon homogenization with the DH or PD method. The percentage of total dead cells is also reported. N ≥ 6. CD45+CD11b+ = microglia/macrophages; CD45+CD11b- = lymphocytes/non-myeloid cells; CD45-ACSA2+ = astrocytes; CD45-O4+ = oligodendrocytes; CD45-Thy1+ = neurons; CD45-CD31+ = endothelial cells; Other = cells negative for all above-mentioned markers. The statistical analysis of the results shown in the graphs is reported in Table 2. Please click here to view a larger version of this figure.
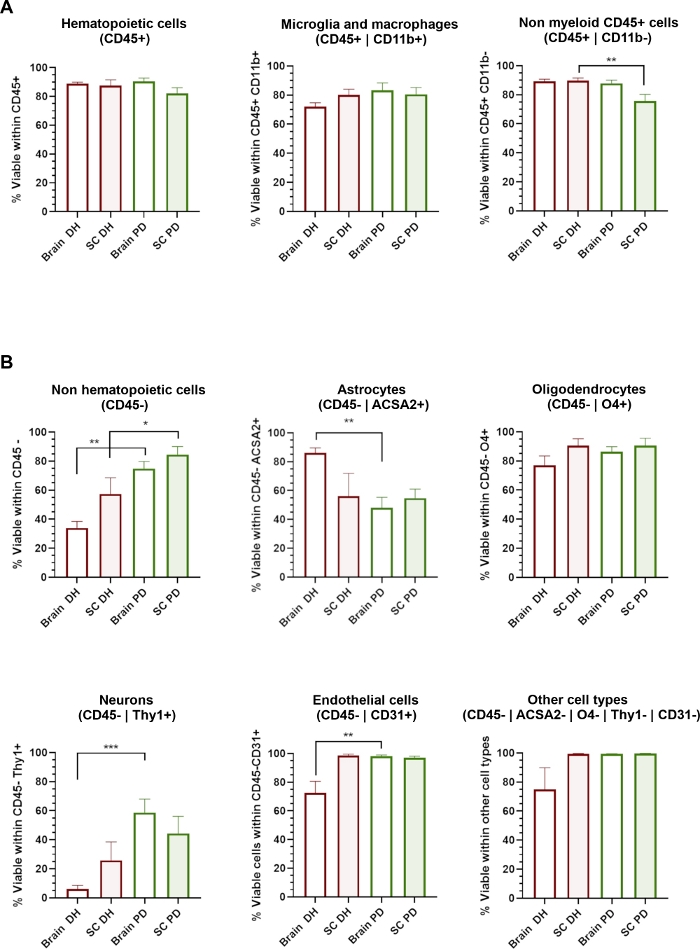
Figure 3: Cellular viability of different CNS cell types is affected by the homogenization method applied.
(A) Histograms showing the percentage of 7-AAD- live cells within CD45+ hematopoietic populations including CD11b+ microglia/macrophages and CD11b- non-myeloid cells. (B) Histograms showing the percentage of 7-AAD- live cells within CD45- non-hematopoietic populations including astrocytes, oligodendrocytes, neurons, endothelial and other cell types. * = p < 0.05, ** = p < 0.01, Mann-Whitney between DH and PD. Please click here to view a larger version of this figure.
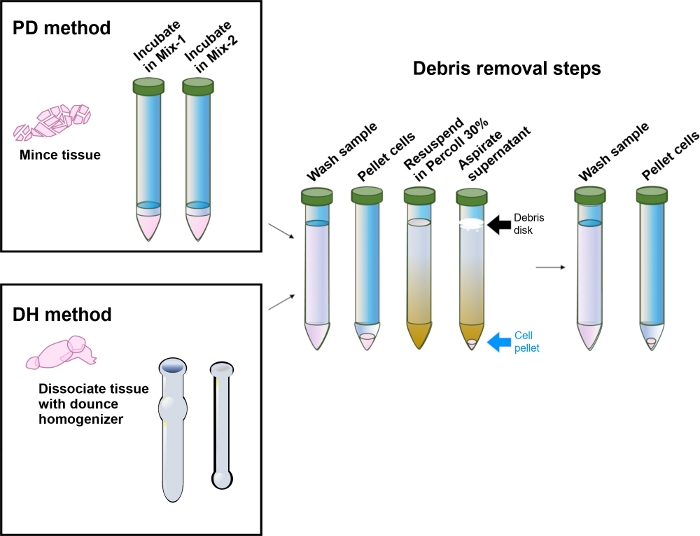
Figure 4: Schematic representation of the critical steps required for proper tissue processing.
A list of the most critical steps required for proper tissue processing and efficient removal of debris is shown. It is important to identify properly the debris disk (black arrow) and the cell pellet (blue arrow) formed after centrifugation of the samples on the 30% density gradient. The debris disk, together with the rest of the supernatant, must be carefully removed by aspiration without dislodging the cell pellet to avoid sample loss. Please click here to view a larger version of this figure.
| Antibody mix | Initial concentration (µg/mL) | Final concentration (µg/mL) | Dilution factor |
| anti CD45/BV510 | 200 | 2 | 100 |
| anti CD11b/APC.780 | 200 | 2 | 100 |
| anti CD31/BV421 | 200 | 2 | 100 |
| anti ACSA2/APC | 150 | 0.75 | 200 |
| anti O4/biotin | na | na | 40 |
| anti CD90.2/PE.Cy7 | 200 | 2 | 100 |
| Streptavidin mix | Initial concentration (µg/mL) | Final concentration (µg/mL) | Dilution factor |
| Streptavidin/Alexa 680 | 1000 | 1 | 1000 |
Table 1: Recipe for preparation of mixes for flow cytometry staining. The table describes the optimal concentrations of antibodies and streptavidin used to allow flow cytometric analyses of multiple cell types. Please refer to Table of Materials for details on catalogue numbers of each reagent mentioned in the table.
| Statistics for Figure 2B | ||||||||||
| BRAIN (% cells) | ||||||||||
| CD45+ | CD45- | |||||||||
| LIVE | DEAD | LIVE | DEAD | |||||||
| Method | mean | ± SEM | mean | ± SEM | mean | ± SEM | mean | ± SEM | ||
| DH | 15.20 | ± 2.32 | 1.90 | ± 0.30 | 24.78 | ± 4.045 | 51.58 | ± 6.033 | ||
| PD | 15.20 | ± 2.65 | 2.33 | ± 1.10 | 68.53 | ± 3.618 | 13.93 | ± 2.180 | ||
| Mann-Whitney | ns | ns | *** | ** | ||||||
| p-value | 0.9989 | 0.738 | 0.0006 | 0.0015 | ||||||
| SPINAL CORD (% cells) | ||||||||||
| CD45+ | CD45- | |||||||||
| LIVE | DEAD | LIVE | DEAD | |||||||
| Method | mean | ± SEM | mean | ± SEM | mean | ± SEM | mean | ± SEM | ||
| DH | 15.00 | ± 8.21 | 1.41 | ± 0.11 | 31.64 | ± 8.21 | 51.95 | ± 16.52 | ||
| PD | 7.49 | ± 4.99 | 1.15 | ± 0.68 | 84.27 | ± 9.39 | 7.09 | ± 3.75 | ||
| Mann-Whitney | ns | ns | * | ns | ||||||
| p-value | 0.5548 | 0.7236 | 0.0438 | 0.1144 | ||||||
| Statistics for Figure 2C | |||||||||||||||||
| BRAIN (% cells) | |||||||||||||||||
| CD45+ | CD45- | ||||||||||||||||
| CD11b+ | CD11b- | ACSA2 | O4 | Thy1 | CD31 | Other | Dead | ||||||||||
| Method | mean | ± SEM | mean | ± SEM | mean | ± SEM | mean | ± SEM | mean | ± SEM | mean | ± SEM | mean | ± SEM | mean | ± SEM | |
| DH | 19.32 | ± 3.88 | 1.17 | ± 0.27 | 9.52 | ± 2.68 | 3.41 | ± 1.01 | 1.39 | ± 0.77 | 0.48 | ± 0.29 | 10.52 | ± 4.49 | 53.83 | ± 5.79 | |
| PD | 10.88 | ± 2.03 | 1.65 | ± 0.48 | 8.17 | ± 2.66 | 6.54 | ± 0.76 | 6.37 | ± 1.76 | 8.27 | ± 1.25 | 33.28 | ± 6.34 | 23.72 | ± 5.31 | |
| Mann-Whitney | ns | ns | ns | * | ** | *** | ** | ** | |||||||||
| p-value | 0.1206 | 0.4819 | 0.5894 | 0.0264 | 0.0093 | 0.0003 | 0.0084 | 0.0022 | |||||||||
| SPINAL CORD (% cells) | |||||||||||||||||
| CD45+ | CD45- | ||||||||||||||||
| CD11b+ | CD11b- | ACSA2 | O4 | Thy1 | CD31 | Other | Dead | ||||||||||
| Method | mean | ± SEM | mean | ± SEM | mean | ± SEM | mean | ± SEM | mean | ± SEM | mean | ± SEM | mean | ± SEM | mean | ± SEM | |
| DH | 21.23 | ± 6.25 | 2.51 | ± 0.57 | 4.26 | ± 2.34 | 9.40 | ± 1.89 | 2.82 | ± 1.51 | 0.97 | ± 0.50 | 22.74 | ± 9.04 | 35.28 | ± 1.89 | |
| PD | 9.63 | ± 1.67 | 2.77 | ± 0.48 | 4.23 | ± 1.59 | 28.62 | ± 3.57 | 1.26 | ± 0.49 | 6.94 | ± 2.14 | 26.39 | ± 8.17 | 19.09 | ± 4.76 | |
| Mann-Whitney | ns | ns | ns | * | ns | * | ns | ns | |||||||||
| p-value | 0.1905 | >0.9999 | 0.7302 | 0.0159 | 0.7302 | 0.0317 | 0.7302 | 0.1111 | |||||||||
Table 2: Statistical analysis of different populations retrieved by applying the DH or PD method. The table describes the statistics for the graphs shown in Figure 2B and Figure 2C. The average and SEM of at least six independent samples is represented. The p value and details on statistical test applied for each comparison are also reported.
