Summary

Inner Mitochondrial Membrane Sensitivity to Na+ Reveals Partially Segmented Functional CoQ Pools

Published: July 20, 2022
doi:

Summary

This protocol describes a comparative assay, using mitochondrial complex activities CI+CIII and CII+CIII in the presence or absence of Na+, to study the existence of partially segmented functional CoQ pools.

Abstract

Ubiquinone (CoQ) pools in the inner mitochondrial membrane (IMM) are partially segmented to either complex I or FAD-dependent enzymes. Such subdivision can be easily assessed by a comparative assay using NADH or succinate as electron donors in frozen-thawed mitochondria, in which cytochrome c (cyt c) reduction is measured. The assay relies on the effect of Na+ on the IMM, decreasing its fluidity. Here, we present a protocol to measure NADH-cyt c oxidoreductase activity and succinate-cyt c oxidoreductase activities in the presence of NaCl or KCl. The reactions, which rely on the mixture of reagents in a cuvette in a stepwise manner, are measured spectrophotometrically during 4 min in the presence of Na+ or K+. The same mixture is performed in parallel in the presence of the specific enzyme inhibitors in order to subtract the unspecific change in absorbance. NADH-cyt c oxidoreductase activity does not decrease in the presence of any of these cations. However, succinate-cyt c oxidoreductase activity decreases in the presence of NaCl. This simple experiment highlights: 1) the effect of Na+ in decreasing IMM fluidity and CoQ transfer; 2) that supercomplex I+III2 protects ubiquinone (CoQ) transfer from being affected by lowering IMM fluidity; 3) that CoQ transfer between CI and CIII is functionally different from CoQ transfer between CII and CIII. These facts support the existence of functionally differentiated CoQ pools in the IMM and show that they can be regulated by the changing Na+ environment of mitochondria.

Introduction

Mitochondrial oxidative phosphorylation system (OXPHOS) is the main pathway driving adenosine triphosphate (ATP) synthesis, reactive oxygen species (ROS) production, and consumption of reducing equivalents, such as nicotinamide adenine dinucleotide (NADH) or succinate, by mitochondria. OXPHOS system is composed of five protein complexes: Complex I (CI) oxidizes NADH and reduces CoQ into ubiquinol (CoQH2). Complex II (CII) oxidizes succinate into fumarate and reduces CoQ into CoQH2. Complex III (CIII) oxidizes CoQH2 back into CoQ, reducing cytochrome c (cyt c). Finally, complex IV (CIV) oxidizes cyt c and reduces oxygen to water. This oxidoreduction chain, the so-called electron transport chain (mETC), is coupled to pumping of H+ across the IMM, which creates an electrochemical gradient used by complex V (CV) to phosphorylate adenosine diphosphate (ADP) into ATP.

mETC complexes can either be alone in the IMM or assemble into quaternary structures called supercomplexes. CIV can assemble with CIII, forming the III2+IV or Q-respirasome (as it is able to respire in the presence of CoQH2)1,2,3 or forming homodimers or homooligomers4. CIII can interact with CI, forming the supercomplex I+III25. Finally, CI is also able to interact with the Q-respirasome, building the I+III2+IV or N-respirasome (as it can respire consuming NADH)1,6,7,8,9,10.

CoQ and cyt c are mobile electron carriers in charge of transferring electrons from CI/CII to CIII, and from CIII to CIV, respectively. Whether or not supercomplexes impose a functional local restriction for these carriers has been a matter of intense debate through the last two decades2,7,11,12,13,14,15,16,17. However, several independent groups have demonstrated that CoQ and cyt c can be functionally segmented into pools in the IMM. In respect of the CoQ, it can be functionally segmented into a specific CoQ pool for CI (CoQNAD) and another pool dedicated to FAD-dependent enzymes (CoQFAD)1,7,12,18,19. However, in order to differentiate the existence of partially segmented functional CoQ pools, the overexpression of the alternative oxidase (AOX) and the generation of specific mtDNA mutants, which can assemble CI in the absence of CIII, were required1,19,20.

The mechanism of reactive oxygen species (ROS) production during hypoxia was unknown until recently. Upon acute hypoxia, CI undergoes the active/deactive (A/D) transition, which involves the decrease in its H+ pumping NADH-CoQ oxidoreductase activity. Such a decrease in H+ pumping acidifies the mitochondrial matrix and partially dissolves the calcium-phosphate precipitates in the mitochondrial matrix, releasing soluble Ca2+. This increase in soluble Ca2+ activates the Na+/Ca2+ exchanger (NCLX), which extrudes Ca2+ in exchange for Na+. Mitochondrial Na+ increase interacts with phospholipids in the inner side of the IMM, decreasing its fluidity and CoQ transfer between CII and CIII, finally producing superoxide anion, a redox signal21. Interestingly, CoQ transfer was only diminished between CII and CIII, but not between CI and CIII, highlighting that 1) Na+ was able to modulate only one of the existing CoQ pools in the mitochondria; 2) there exists functionally differentiated CoQ pools in the IMM. Thus, a widely used protocol for the study of mitochondrial enzyme activities can be used to assess the existence of the mentioned CoQ pools.

The current protocol is based on the measurement of the reduction of oxidized cyt c, the substrate of CIII, by absorbance in the presence of succinate (i.e., CII substrate) or NADH (i.e., CI substrate). The same sample is divided into two, one of which will be treated with KCl, and the other one with the same concentration of NaCl. In this way, given that Na+ decreases IMM fluidity, if CoQ existed in a unique pool in the IMM, both CI+CIII and CII+CIII would decrease in the presence of Na+. However, if CoQ existed in partially segmented functional CoQ pools, the effect of Na+ would mostly (or only) be evident on the CII+CIII activity, but not on the CI+CIII. As recently published21, Na+ only affects the CoQ transfer between CII and CIII (Figure 1C,D), but not between CI and CIII (Figure 1A,B).

This protocol, together with a panoply of techniques, has been used to confirm the existence of partially segmented functional CoQ pools in the IMM, one dedicated to CI (i.e., CoQNAD), and another dedicated to FAD-linked enzymes (i.e., CoQFAD)1,3,7; an observation that, though it continues to be debated22, has been corroborated independently by several groups7,19. Thus, the superassembly of CI into supercomplexes impacts on the local mobility of CoQ, facilitating its usage by the CIII within the supercomplex1,7,13,14,23,24,25.

Protocol

All animal experiments were performed following the Guide for the Care and Use of Laboratory Animals and were approved by the institutional ethics committee of the Centro Nacional de Investigaciones Cardiovasculares Carlos III (CNIC), Spain, in accordance with the European Union Directive of 22 September 2010 (2010/63/UE) and with the Spanish Royal Decree of 1 February 2013 (53/2013). All efforts were made to minimize the number of animals used and their suffering.

NOTE: This comparative assay to study the segmentation of mitochondrial CoQ pools is described as follows:

1. Protein quantification

  1. Freeze and thaw the isolated mitochondria26 from a wild-type mouse liver three times (i.e., mitochondrial membranes) before experimentation to make the organelles permeable to the reaction substrates.
  2. Quantify the protein amount of the isolated mitochondria sample by Bradford or Bicinchoninic acid (BCA) methods. In the case of Bradford, add 2 µL of sample into 1 mL of 1x Bradford reagent.
  3. Split the sample into four subsamples of 20 µg each (namely: A, B, C, D; Figure 2A).

2. Measuring CI+CIII activity

NOTE: This part of the protocol uses samples A and B to measure CI+CIII activity (Figure 2B).

  1. Split samples A and B into two subsamples of 10 µg each (namely A1, A2, B1, and B2). Mix each of the subsamples in a 1 mL cuvette with 30 µL of cyt c (10 mg/mL), 10 µL of 100 mM malonate, and add preheated C1/C2 buffer (Table 1) at 37 °C up to 980 µL (979 µL for cuvettes A2 and B2).
    CAUTION: This step involves the use of the toxic reagents malonate and potassium cyanide.
    NOTE: cyt c (10 mg/mL) must be prepared fresh by mixing 10 mg of cyt c in 1 mL of 10 mM K2HPO4 solution, pH adjusted to 7.2, and it must be maintained in ice throughout the experiment.
  2. Add 10 µL of 1 M KCl in cuvettes A1 and A2, and add 10 µL of 1 M NaCl in cuvettes B1 and B2.
  3. Add 1 µL of 1 mM rotenone into the cuvette containing subsamples A2 and B2.
    CAUTION: This step involves the use of the toxic reagent rotenone.
  4. Right before the measurement, add 10 µL of NADH (10 mM) into all cuvettes.
    NOTE: The 10 µL is preferably added on the step of the cuvette, so the reaction starts upon mixing.
  5. Mix the cuvette by carefully flipping it three times. Place it in the absorbance cuvette reader (UV/VISJASCO spectrophotometer).
  6. Click on Measure > Parameters > General and set the measurement parameters at Wavelength: 550 nm, and Time: 4 min of reading; press Accept and Start buttons to begin the experiment.
  7. At the end of the measurement, save the slope comprising the linear increase of absorbance by clicking on File and Save As. The slope can also be collected manually.

3. Measuring CII+CIII activity

NOTE: This part of the protocol uses samples C and D to measure CII+CIII activity (Figure 2C).

  1. Split samples C and D into two subsamples of 10 µg each (namely C1, C2, D1, and D2). Mix each of the subsamples in a 1 mL cuvette with 30 µL of cyt c (10 mg/mL), 1 µL of 1 mM rotenone, and add preheated C1/C2 buffer at 37 °C up to 980 µL (970 µL for cuvettes C2 and D2).
    CAUTION: This step involves the use of the toxic reagents potassium cyanide and rotenone.
    NOTE: cyt c (10 mg/mL) must be prepared fresh by mixing 10 mg of cyt c in 1 mL of 10 mM K2HPO4 solution, pH adjusted to 7.2, and it must be maintained in ice throughout the experiment.
  2. Add 10 µL of 1 M KCl in cuvettes C1 and C2, and add 10 µL of 1 M NaCl in cuvettes D1 and D2.
  3. Add 1 µL of 1 mM antimycin A into the cuvette containing subsamples C2 and D2.
    CAUTION: This step involves the use of the toxic reagent antimycin A.
  4. Right before the measurement, add 10 µL of succinate (1 M) into all cuvettes.
    NOTE: The 10 µL is preferably added on the step of the cuvette, so the reaction starts upon mixing.
  5. Mix the cuvette carefully, flipping it three times. Place it in the absorbance cuvette reader (UV/VIS spectrophotometer).
  6. Click on Measure > Parameters > General and set the measurement parameters at Wavelength: 550 nm, and Time: 4 min of reading; press Accept and Start buttons to begin the experiment.
  7. At the end of the measurement, save the slope comprising the linear increase of absorbance by clicking on File and Save As. The slope can also be collected manually.

Representative Results

Typical results from this protocol are represented below (Figure 3). As reduced cyt c absorbance locates at 550 nm, all uninhibited subsamples must show an increase in the absorbance at 550 nm. Inhibited subsamples ideally show a flat-line or slightly increasing slope (Figure 3). Slopes from inhibited subsamples are to be subtracted from uninhibited subsamples.

Samples A and B, both corrected by their correspondent inhibition and which represent NADH:cyt c oxidoreductase activity, have a similar slope (Figure 3A). However, subsamples C and D, both corrected by their correspondent inhibition and which represent succinate:cyt c oxidoreductase activity, are different, in that the activity of subsample C is higher than the activity of subsample D (Figure 3B). Note that basal absorbance can be slightly different between samples (Figure 3A).

These results (i.e., slopes already corrected by their inhibitor; Table 2) can be represented by dividing the amount of protein used (0.01 mg) as a.u./min/mg protein. From this value, the rate of cyt c reduction can be further calculated using the Lamber-Beer law21.

Importantly, these results may vary according to several factors: (i) Origin of the samples. Given that different tissues and cell types have a variable composition of OXPHOS complexes and supercomplexes, absolute values and relative changes may vary across samples. (ii) Given that different tissues may have a variable composition of OXPHOS complexes and supercomplexes, adding more frozen-thawed mitochondria (to compensate lower absolute values of a certain tissue) to the reaction mixture may have a secondary effect, which is that the ratio of Na+ or K+ per mg of protein/phospholipid in the sample decreases. Thus, caution should be taken when varying either the amount of mitochondria or the Na+/K+ concentration added to the sample. (iii) Interexperimental variation may arise from duration and temperature of freeze-thaw cycles, reagents commercial batch, or varying storage buffer of isolated mitochondria.

Figure 1
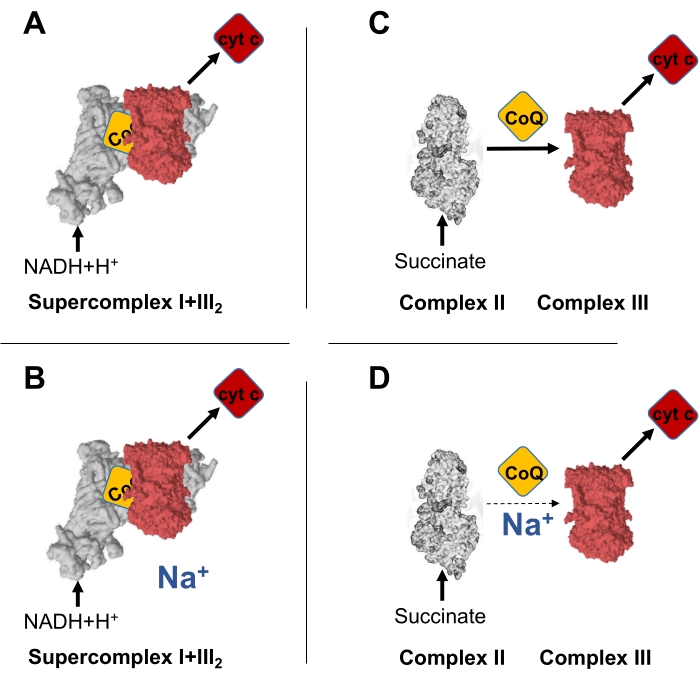
Figure 1: Na+ decreases specifically electron transfer between CII and CIII, but not between CI and CIII. (A) Schematic representation of the electron transfer between NADH and cyt c, occurring through the CoQNAD in the supercomplex I+III2. (B) Electron transfer between NADH and cyt c, occurring through the CoQNAD in the supercomplex I+III2, is not affected by intramitochondrial Na+. (C) Schematic representation of the electron transfer between succinate and cyt c, occurring through the CoQFAD in CII. (D) Electron transfer between NADH and cyt c, occurring through the CoQFAD in the supercomplex I+III2, is decreased by high intramitochondrial Na+. Please click here to view a larger version of this figure.

Figure 2
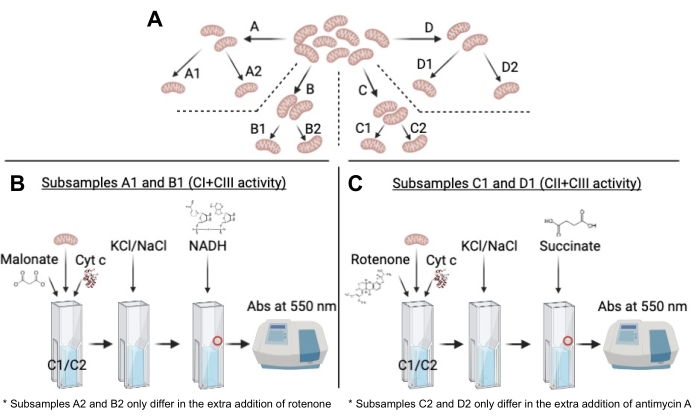
Figure 2: Schematic representation of the protocol from the subdivision of the original sample to the kinetic measurement. (A) Schematic representation of the subsample division, highlighting the same origin of all subsamples. (B) Scheme of the successive steps of reagent's additions for CI+CIII activity in subsamples A1 and B1. The red circle represents the location where NADH should ideally be added. Note that the only difference with subsamples A2 and B2 is the extra addition of rotenone in the latter. (C) Scheme of the successive steps of reagent's additions for CII+CIII activity in subsamples C1 and D1. The red circle represents the location where succinate should ideally be added. Note that the only difference with subsamples C2 and D2 is the extra addition of antimycin A in the latter. Please click here to view a larger version of this figure.

Figure 3
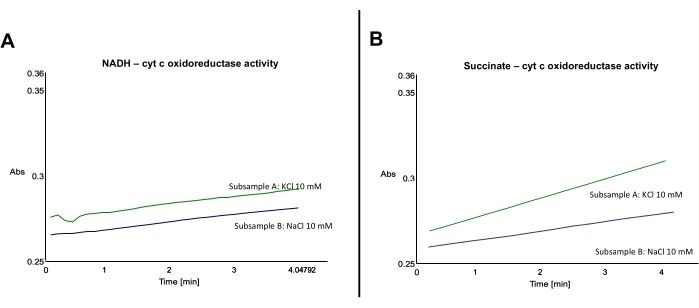
Figure 3: Effect of Na+ on cyt c reduction by mouse liver mitochondrial membranes upon NADH or succinate addition. (A) Representative traces showing the effect of Na+ on cyt c reduction by mouse liver mitochondrial membranes oxidizing NADH. (B) Representative traces showing the effect of Na+ on cyt c reduction by mouse liver mitochondrial membranes oxidizing succinate. Please click here to view a larger version of this figure.

Compound Concentration
K2HPO4 25 mM
MgCl2 5 mM
KCN 3 mM
Bovine Serum Albumin (BSA) 2.5 mg/mL

Table 1: Composition of C1/C2 buffer. Buffer composition is presented in molar concentrations.

Expected rates +KCl (Mean) +KCl (SD) +NaCl (Mean) +NaCl (SD) Mann-Whitney P value
CII + CIII (n = 4) 0.050659 0.0068377 0.023217 0.0024511 0.0286
Individual values 0.0509629 0.02250151
0.0561086 0.02664035
0.0393956 0.01984683
0.0561695 0.0238827
CI + CIII (n = 4) 0.016681 0.00237326 0.017756 0.0029472 0.4857
Individual values 0.01610133 0.01780299
0.01878711 0.01901848
0.01303777 0.01308397
0.01879871 0.02112066

Table 2: Expected rates ranges. The expected values for each activity are presented in arbitrary units. The corresponding statistical test between +KCl and +NaCl is also presented. "n" represents the number of replicates.

Discussion

Though this protocol represents a very straightforward procedure to identify the existence of the partially segmented CoQ pools, there are a few critical steps to take into account. Substrates (i.e., NADH or succinate) are preferably added last since autooxidation of these compounds may occur. Cuvette's flipping must be careful in order to avoid the formation of bubbles which may interfere with the reading.

In addition, the present technique presents a few limitations which are worth mentioning. Measurements are not performed in intact mitochondria. Thus, the artificial content and proportion of the buffer may result in differences with the native environment of mitochondria.
Reagents are added in excess, and they may not represent the true availability of substrates in intact tissues.

Current methods imply the generation and use of very specific genetic models and equipment that are not readily available in many laboratories1. This protocol provides a reliable and easy-to-do method to measure the existence of the partially differentiated CoQ pools using broadly available reagents and tools. Thus, it is possible that it may be applied in future studies comparing genetic models of mitochondrial disease.

The mobility of the mobile electron carriers in the mETC is still a highly debated topic25,27, though the existence of partially differentiated pools is becoming accepted7,12,18,28,29. Recently, high-resolution respirometry and detailed biochemical characterization of several OXPHOS mutants expressing AOX1, together with refined cryoelectron microscopy studies preserving the natural lipid milieu7, have brought light into the discussion. This poses heavy arguments in favor of the existence of partially segmented functional CoQ pools.

In addition, physiological stimuli have been shown to be regulated by the different CoQ pools; in particular, the acute hypoxic response driven by intramitochondrial Na+. Higher Na+ levels in mitochondria during hypoxia decrease the electron transfer between CII and CIII, uncoupling the Q cycle at the level of CIII and producing a superoxide anion. In contrast, electron transfer between CI and CIII did not decrease21. The current protocol extensively explains the procedure by which these results were obtained.

Further controls can be applied to the current protocol if the treatment under study is performed in cellule or in vivo, which are the isolated complex activities of CI, CII, and CIII, as their individual amounts or single activities may vary along with the treatment. Following a very similar procedure as described above, differences were not seen in any of these isolated activities21 in the presence or absence of Na+. To note, it has been described that Na+ can increase the D/A transition30. However, the protocol used on this observation involved the use of submitochondrial particles (SMPs), whereas our protocol uses mitochondrial membranes, highlighting the necessity of membrane potential across the IMM for the accounted effect30.

It should be noted that freeze-thaw cycles do not dissolve the membranes as detergents do, thus single complexes and supercomplexes are still attached to phospholipid bilayers. This is evidenced by the fact that frozen-thawed mitochondria oxygen consumption through either CI or CII can be measured in the presence of cytochrome c31. In addition, if there was an effect of freeze-thaw cycles on CII+CIII activity, it would not only be seen in "NaCl 10 mM" samples, but also in "KCl 10 mM" samples. This would make either the measurement impossible (as CII would be separated from CIII through membrane decomposition) or lower to a point in which differences between K+ and Na+ would not be seen. However, as seen in Figure 2B, this is not the case. The addition of KCl in the protocol is designed to discard possible effects of either osmolarity or ionic strength on the measured activities. The final osmolarity in both cases, "10 mM KCl" sample and "10 mM NaCl" sample, is equal (116 mEq/L) and the only difference between samples is the presence of 10 mM K+ or 10 mM Na+. Nonetheless, if K+ cations from the buffer had an effect, it would manifest in both "KCl 10 mM" and "NaCl 10 mM" samples, making such an effect undiscernible in either sample.

In the ability of the different cations to bind phospholipids, what is indeed crucial is the coordination chemistry and the ionic radius of each cation (as highlighted experimentally in our original paper21, and theoretically in Böckmann et al.32). Whereas K+ displays an average coordination number of six, the Na+ average coordination number is five, resulting in a different coordination complex geometry, which translates into very different effects of K+ and Na+ on a phospholipid bilayer33.

It should also be noted that the ionic radius of K+ and Na+ are different. Whereas K+ has an ionic radius of 280 pm, Na+ has an ionic radius of 227 pm. This difference directly impacts on their interaction with anions (or zwitterions), since a lower ionic radius (i.e. less electron shells) results in a stronger interaction with a negatively charged molecule as the positive ionic nucleus is more exposed as if it had extra electron shells (i.e. higher ionic radius). Indeed, all cations are possibly able to interact with phospholipids; however, only those with specific chemical-physical properties are able to have specific effects on a phospholipid bilayer, such as Na+.

Divulgations

The authors have nothing to disclose.

Acknowledgements

We thank Dr. R. Martínez-de-Mena, M. M. Muñoz-Hernandez, A., Dr C. Jimenez and E. R. Martínez-Jimenez for technical assistance. This study was supported by MICIN: RTI2018-099357-B-I00 and HFSP (RGP0016/2018). The CNIC is supported by the Instituto de Salud Carlos III (ISCIII), the Ministerio de Ciencia, Innovación y Universidades (MCNU) and the Pro CNIC Foundation and is a Severo Ochoa Center of Excellence (SEV-2015-0505). Figure 2 created with BioRender.com.

Materials

Antimycin A Sigma-Aldrich A8674
Bovine Serum Albumin (BSA) Sigma-Aldrich 10775835001
Bradford protein assay Bio-Rad 5000001
Cytochrome c from equine heart Sigma-Aldrich C7752
K2HPO4 Sigma-Aldrich P3786
KCl Sigma-Aldrich P3911
Malonic acid Sigma-Aldrich M1296
MgCl2 Sigma-Aldrich M8266
NaCl Sigma-Aldrich S9888
NADH Roche 10107735001
Potassium cyanide Sigma-Aldrich 207810
Rotenone Sigma-Aldrich R8875
Spectra Manager software JASCO version 2
Spectrophotometer UV/VISJASCO
Succinate Sigma-Aldrich 398055

References

  1. Calvo, E., et al. Functional role of respiratory supercomplexes in mice: SCAF1 relevance and segmentation of the Qpool. Science Advances. 6 (26), (2020).
  2. Garcia-Poyatos, C., et al. Scaf1 promotes respiratory supercomplexes and metabolic efficiency in zebrafish. EMBO Reports. 21 (7), 50287 (2020).
  3. Lapuente-Brun, E., et al. Supercomplex assembly determines electron flux in the mitochondrial electron transport chain. Science. 340 (6140), 1567-1570 (2013).
  4. Cogliati, S., et al. Mechanism of super-assembly of respiratory complexes III and IV. Nature. 539 (7630), 579-582 (2016).
  5. Letts, J. A., Fiedorczuk, K., Degliesposti, G., Skehel, M., Sazanov, L. A. Structures of respiratory Supercomplex I+III2 reveal functional and conformational crosstalk. Molecular Cell. 75 (6), 1131-1146 (2019).
  6. Acin-Perez, R., Fernandez-Silva, P., Peleato, M. L., Perez-Martos, A., Enriquez, J. A. Respiratory active mitochondrial supercomplexes. Molecular Cell. 32 (4), 529-539 (2008).
  7. Jeon, T. J., et al. A dynamic substrate pool revealed by cryo-EM of a lipid-preserved respiratory supercomplex. Antioxidants and Redox Signaling. , (2021).
  8. Gu, J., et al. The architecture of the mammalian respirasome. Nature. 537 (7622), 639-643 (2016).
  9. Letts, J. A., Fiedorczuk, K., Sazanov, L. A. The architecture of respiratory supercomplexes. Nature. 537 (7622), 644-648 (2016).
  10. Sousa, J. S., Mills, D. J., Vonck, J., Kuhlbrandt, W. Functional asymmetry and electron flow in the bovine respirasome. Elife. 5, 21290 (2016).
  11. Andreasson, C., Ott, M., Buttner, S. Mitochondria orchestrate proteostatic and metabolic stress responses. EMBO Reports. 20 (10), 47865 (2019).
  12. Berndtsson, J., et al. Respiratory supercomplexes enhance electron transport by decreasing cytochrome c diffusion distance. EMBO Reports. 21 (12), 51015 (2020).
  13. Bianchi, C., Genova, M. L., Parenti Castelli, G., Lenaz, G. The mitochondrial respiratory chain is partially organized in a supercomplex assembly: kinetic evidence using flux control analysis. Journal of Biological Chemistry. 279 (35), 36562-36569 (2004).
  14. Enriquez, J. A. Supramolecular organization of respiratory complexes. Annual Review of Physiology. 78, 533-561 (2016).
  15. Genova, M. L., Lenaz, G. A critical appraisal of the role of respiratory supercomplexes in mitochondria. Biological Chemistry. 394 (5), 631-639 (2013).
  16. Letts, J. A., Sazanov, L. A. Clarifying the supercomplex: the higher-order organization of the mitochondrial electron transport chain. Nature Structural and Molecular Biology. 24 (10), 800-808 (2017).
  17. Milenkovic, D., Blaza, J. N., Larsson, N. G., Hirst, J. The enigma of the respiratory chain supercomplex. Cell Metabolism. 25 (4), 765-776 (2017).
  18. Moe, A., Di Trani, J., Rubinstein, J. L., Brzezinski, P. Cryo-EM structure and kinetics reveal electron transfer by 2D diffusion of cytochrome c in the yeast III-IV respiratory supercomplex. Proceedings of the National Academy of Sciences of the United States of America. 118 (11), 2021157118 (2021).
  19. Szibor, M., et al. Bioenergetic consequences from xenotopic expression of a tunicate AOX in mouse mitochondria: Switch from RET and ROS to FET. Biochimica et Biophysica Acta. Bioenergetics. 1861 (2), 148137 (2020).
  20. Guaras, A., et al. The CoQH2/CoQ ratio serves as a sensor of respiratory chain efficiency. Cell Reports. 15 (1), 197-209 (2016).
  21. Hernansanz-Agustin, P., et al. Na(+) controls hypoxic signalling by the mitochondrial respiratory chain. Nature. 586 (7828), 287-291 (2020).
  22. Vercellino, I., Sazanov, L. A. The assembly, regulation and function of the mitochondrial respiratory chain. Nature Reviews. Molecular Cell Biology. 23 (2), 141-161 (2022).
  23. Acin-Perez, R., Enriquez, J. A. The function of the respiratory supercomplexes: the plasticity model. Biochimica et Biophysica Acta. 1837 (4), 444-450 (2014).
  24. Enriquez, J. A., Lenaz, G. Coenzyme q and the respiratory chain: coenzyme q pool and mitochondrial supercomplexes. Molecular Syndromology. 5 (3-4), 119-140 (2014).
  25. Hernansanz-Agustin, P., Enriquez, J. A. Functional segmentation of CoQ and cyt c pools by respiratory complex superassembly. Free Radical Biology and Medicine. 167, 232-242 (2021).
  26. Fernandez-Vizarra, E., et al. Isolation of mitochondria for biogenetical studies: An update. Mitochondrion. 10 (3), 253-262 (2010).
  27. Cogliati, S., Cabrera-Alarcon, J. L., Enriquez, J. A. Regulation and functional role of the electron transport chain supercomplexes. Biochemical Society Transactions. 49 (6), 2655-2668 (2021).
  28. den Brave, F., Becker, T. Supercomplex formation boosts respiration. EMBO Reports. 21 (12), 51830 (2020).
  29. Perez-Mejias, G., Guerra-Castellano, A., Diaz-Quintana, A., Dela Rosa, M. A., Diaz-Moreno, I. Cytochrome c: Surfing off of the mitochondrial membrane on the tops of Complexes III and IV. Computational and Structural Biotechnology Journal. 17, 654-660 (2019).
  30. Stepanova, A., Valls, A., Galkin, A. Effect of monovalent cations on the kinetics of hypoxic conformational change of mitochondrial complex I. Biochimica et Biophysica Acta. 1847 (10), 1085-1092 (2015).
  31. Acin-Perez, R., et al. A novel approach to measure mitochondrial respiration in frozen biological samples. The EMBO Journal. 39 (13), 104073 (2020).
  32. Böckmann, R. A., Hac, A., Heimburg, T., Grubmüller, H. Effect of sodium chloride on a lipid bilayer. Biophysical Journal. 85 (3), 1647-1655 (2003).
  33. Cordomí, A., Edholm, O., Perez, J. J. Effect of ions on a dipalmitoyl phosphatidylcholine bilayer. a molecular dynamics simulation study. The Journal of Physical Chemistry B. 112 (5), 1397-1408 (2008).
check_url/fr/63729?article_type=t

Play Video

Citer Cet Article
Hernansanz-Agustín, P., Enríquez, J. A. Inner Mitochondrial Membrane Sensitivity to Na+ Reveals Partially Segmented Functional CoQ Pools. J. Vis. Exp. (185), e63729, doi:10.3791/63729 (2022).

View Video